Review
. 2022 Jun 28;6(7):e740.
doi: 10.1097/HS9.0000000000000740. eCollection 2022 Jul.

Metabolic Regulation of Hematopoietic Stem Cells

Affiliations
Review

Metabolic Regulation of Hematopoietic Stem Cells

Claudia Morganti et al. Hemasphere. .

Abstract

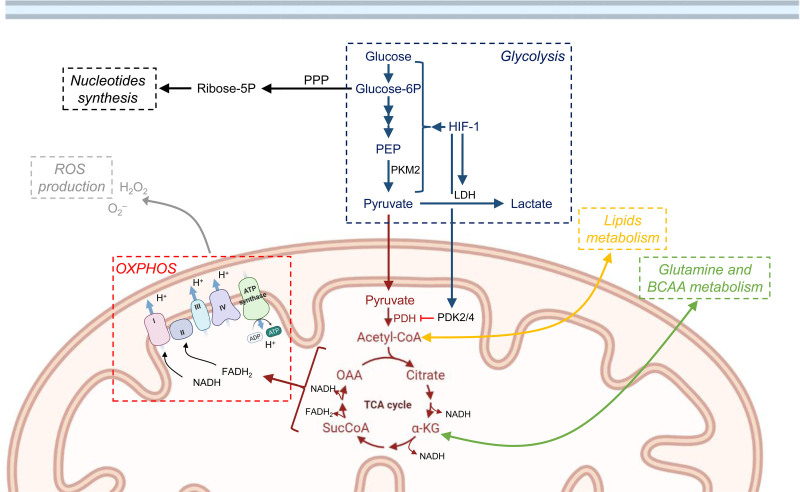
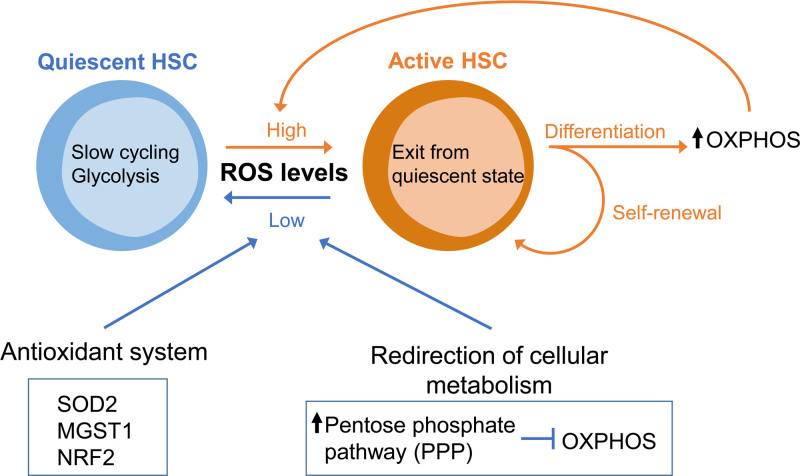
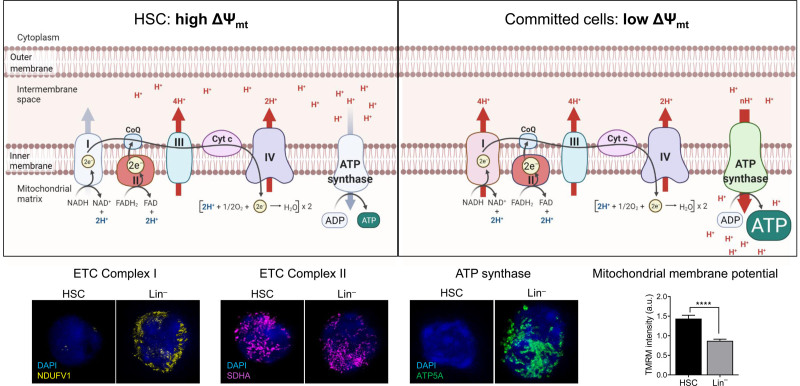
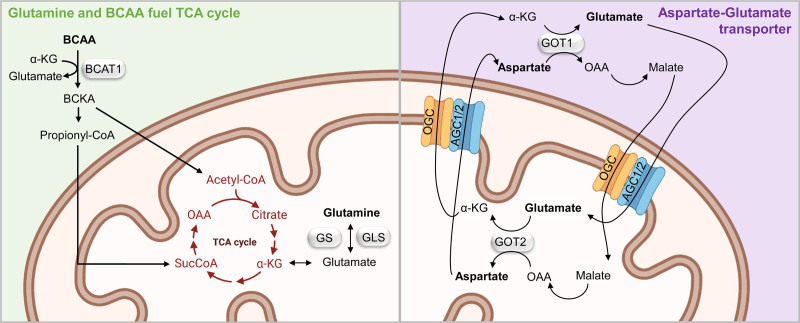
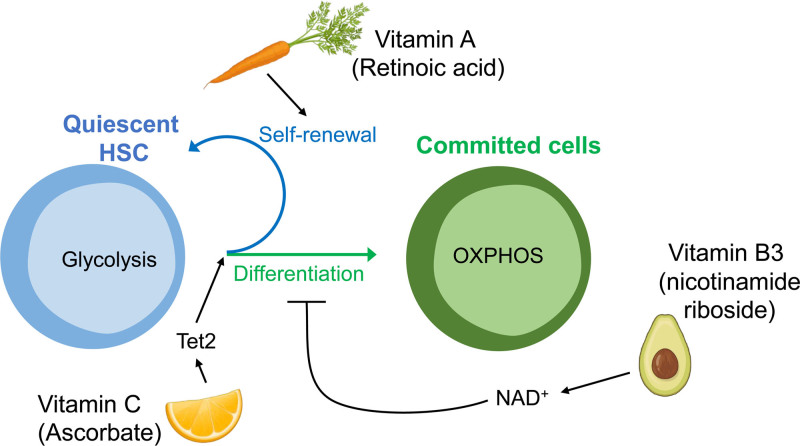
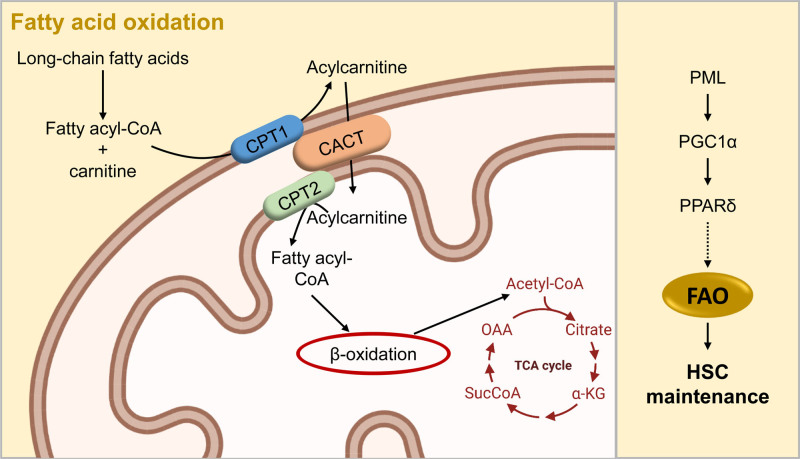
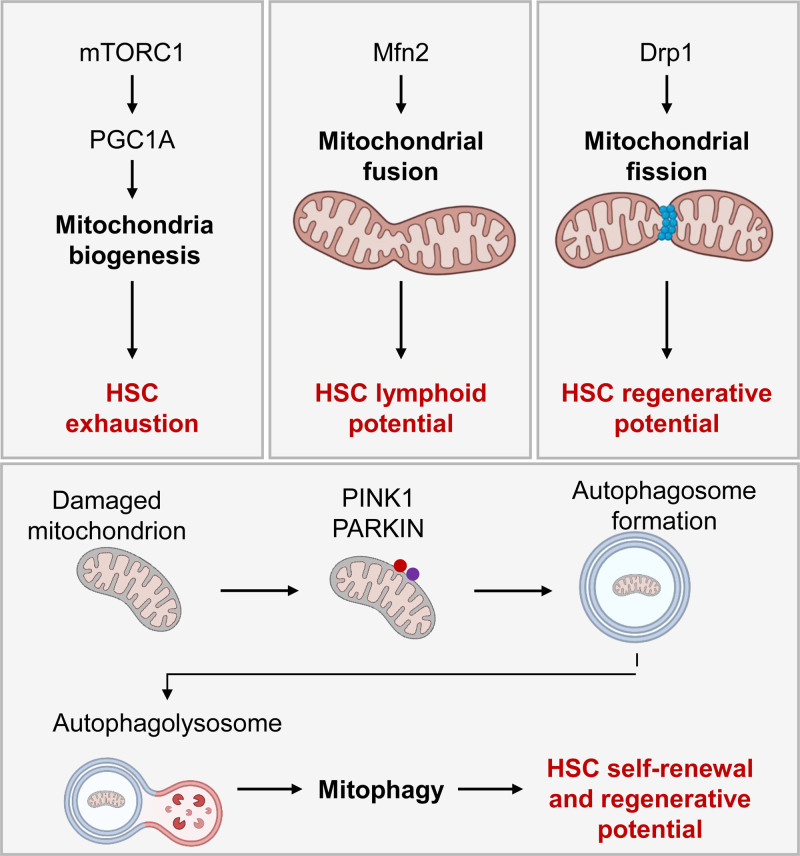
Cellular metabolism is a key regulator of hematopoietic stem cell (HSC) maintenance. HSCs rely on anaerobic glycolysis for energy production to minimize the production of reactive oxygen species and shift toward mitochondrial oxidative phosphorylation upon differentiation. However, increasing evidence has shown that HSCs still maintain a certain level of mitochondrial activity in quiescence, and exhibit high mitochondrial membrane potential, which both support proper HSC function. Since glycolysis and the tricarboxylic acid (TCA) cycle are not directly connected in HSCs, other nutrient pathways, such as amino acid and fatty acid metabolism, generate acetyl-CoA and provide it to the TCA cycle. In this review, we discuss recent insights into the regulatory roles of cellular metabolism in HSCs. Understanding the metabolic requirements of healthy HSCs is of critical importance to the development of new therapies for hematological disorders.


Figures

Figure 1.
Figure 1.
Mitochondria play a central role in metabolic pathways contributing to HSC maintenance. Overview of metabolic pathways contributing to HSC self-renewal and differentiation. HSCs mainly rely on glycolysis, which starts with the conversion of glucose into glucose-6P, and results in the generation of pyruvate, transformed from PEP by PKM2. Upon differentiation, pyruvate enters the TCA cycle in the mitochondria, fueling OXPHOS, and generating NADH and FADH2 to sustain high energy demands. OXPHOS produce ROS, and increased ROS negatively affects stem cell properties. To avoid the activation of OXPHOS and ROS production, HSCs utilize several alternative metabolism pathways. HIF-1 promotes glycolysis pathway and the conversion of pyruvate into lactate, enhancing the activity of LDH. Glucose-6P can be used by PPP to generate Ribose-5P to sustain nucleotides synthesis. HIF-1 also activates the PDK2/4, which is highly expressed in HSCs, and downregulates aerobic metabolism through inhibition of PDH-mediated conversion of pyruvate to acetyl-CoA. TCA cycle intermediates, Acetyl-CoA, and αKG link to lipids and amino acid metabolisms, respectively. Templates created with BioRender.com. -5P = -5 phosphate; -6P = 6-phosphate; HIF-1 = Hypoxia-inducible factor 1; HSC = hematopoietic stem cell; LDH = lactate dehydrogenase; OXPHOS = oxidative phosphorylation; PDH = pyruvate dehydrogenase; PDK = pyruvate dehydrogenase kinase; PEP = phosphoenolpyruvic acid; PKM2 = pyruvate kinase M2; PPP = pentose phosphate pathway; ROS = reactive oxygen species; TCA = tricarboxylic acid; αKG = α-ketoglutarate.
Figure 2.
Figure 2.
Metabolic ROS control is necessary to preserve HSC quiescence. Quiescent HSCs depend on glycolysis and exhibit low ROS level, whereas active HSCs instead increase proliferation and differentiation while switching to OXPHOS metabolism with high ROS production. ROS levels heavily influences HSC fate, thus antioxidant enzyme [SOD2, Mgst1, and NRF2] and redirection of cellular metabolism (fueling glucose metabolites into the PPP, instead of OXPHOS) maintain low the level of ROS in quiescent HSCs. HSC = hematopoietic stem cell; Mgst1 = microsomal glutathione transferase 1; NRF2 = nuclear factor erythroid 2-related factor 2; OXPHOS = oxidative phosphorylation; PPP = pentose phosphate pathway; ROS = reactive oxygen species ; SOD2 = superoxide dismutase.
Figure 3.
Figure 3.
The balance between electron transport chain complexes sustains high mitochondrial membrane potential in HSC. Top: Schematic representation of the ETC complex in HSC and committed cells. ETC complexes I–IV transfer protons from the mitochondrial matrix to the periplasmic space to contribute to increase mitochondrial membrane potential (ΔΨmt). This proton-motive force of ΔΨmt is used and depolarized by F1FO ATP synthase (or complex V) to generate ATP. Unlike complex I and complex V, complex II expression is similar between HSCs and mature populations. This allows HSCs to sustain a high ΔΨmt, which cannot be dissipated by ATP synthase, since it is barely expressed. Bottom: Representative immunofluorescence images of NDUFV1 (ETC complex I), SDHA (ETC complex II) and ATP5A (ATP Synthase) in HSC and committed cells (Lin). Mitochondrial membrane potential measured by TMRM in HSCs and Lin cells. Data are modified from. Template created with BioRender.com. ATP = adenosine triphosphate; ETC = electron transport chain; HSC = hematopoietic stem cell; TMRM = tetramethylrhodamine methyl ester perchlorate.
Figure 4.
Figure 4.
Glutamine and BCAA fuel TCA cycle. Green box: glutamine and BCAA pathway. In the mitochondria, glutamine is converted in glutamate by Gls and then αKG to fuel TCA cycle. Catabolism of BCAA by BCAT1 produces cytosolic Glu. The resulting BCKA fuel the TCA cycle via acetyl-CoA or are converted into propionyl-CoA, which enters the TCA cycle producing succinyl-COa (SucCoA). Purple box: glutamate-aspartate transporter. In the cytosol, OAA is converted into malate, which is then imported into the mitochondria by OCG in exchange for αKG. In the mitochondria, malate is reconverted in OAA, which in turn is transformed into aspartate by GOT2. GOT2 also produces αKG, which is used to exchange malate from the cytosol to the mitochondria. AGC1/2 simultaneously transports glutamate from the cytosol to the mitochondrial matrix, whereas exporting aspartate from the matrix to the cytosol. In the cytosol, OAA and glutamate are regenerated by GOT1. Silver box label enzymes. Template created with BioRender.com. AGC1/2 = Aspartate/glutamate carrier 1 and 2; BCAA = branched-chain amino acid; BCAT1 = BCAA transaminase 1; BCKA = branched chain keto acids; Gls = glutaminase; Glu = glutamate; GOT2 = glutamic-oxaloacetic transaminase 2; OAA = oxaloacetate; OCG = 2-oxoglutarate carrier; TCA = tricarboxylic acid; αKG = α-ketoglutarate.
Figure 5.
Figure 5.
Dietary habits maintain a healthy HSC pool. Vitamin C (Ascorbate) is one of the most enriched metabolites in HSCs and decreased with differentiation. In homeostasis, Vitamin C regulates the balance between self-renewal and differentiation by promoting Tet2 activity. Vitamin A is crucial to maintain HSC quiescence, since Vitamin A-free diet leads to HSCs exhaustion and disrupted re-entry into dormancy. Dietary supplementation with the NAD+ precursor nicotinamide riboside, a form of vitamin B3, improves HSC function reducing mitochondrial metabolism. Icons created with BioRender.com. HSC = hematopoietic stem cell.
Figure 6.
Figure 6.
Fatty acid oxidation sustains HSCs. FAO, a key catabolic pathway for energy production, fuels the TCA cycle rather than glycolysis. Long-chain fatty acids are first activated in the cytosol in fatty acyl-CoA, and then transported by the carnitine shuttle system, which is composed by CPT1, CACT, and CPT2, into the mitochondria. Here, β-oxidation through multi-step reactions generates acetyl-CoA, which fuels the TCA cycle. Mitochondrial FAO is critical for HSC maintenance: PML regulates the PPARδ, through the transcription factor PGC1α. PPARδ is a regulator of FAO, and its deletion results in loss of HSC reconstitution potential. Template created with BioRender.com. CACT = carnitine-acylcarnitine translocase; CPT1 = carnitine palmitoyltransferase 1; CPT2 = carnitine palmitoyltransferase 2; FAO = fatty acid oxidation; HSC = hematopoietic stem cell; PGC1α = PPARg coactivator-1α; PML = promyelocytic leukemia; PPARδ = peroxisome-proliferator activated receptor delta; TCA = tricarboxylic acid.
Figure 7.
Figure 7.
Effects of mitochondria dynamism on HSC. Mitochondrial biogenesis, fission, fusion, and mitophagy control mitochondrial mass and shape affecting HSC homeostasis. mTORC1 upregulates the transcription factor Pgc1α to activate mitochondria biogenesis, which leads to HSC exhaustion. Mfn2 promotes mitochondrial fusion and is specifically required for the maintenance of lymphoid potential HSCs but not myeloid-dominant HSCs. Drp1 creates a ring-like structure able to divide mitochondrial network filaments (mitochondrial fission). Deficiency for Drp1 causes loss of HSC regenerative potential while maintaining HSC quiescence. Damaged mitochondria are selectively cleared through mitophagy. Pink1 and ubiquitin ligase Parkin label damaged mitochondria, which are incorporated into the autophagosome and removed by fusion with the lysosome (authophagolysosome). Parkin recruitment in the mitochondria enhances HSC self-renewal, and lysosome activity is critical to maintaining HSC repopulation capacity. Icons created with BioRender.com. Drp1 = dynamin-related protein 1; HSC = hematopoietic stem cell; Mfn2 = mitofusion 2; mTORC1 = mammalian target of rapamycin complex-1; Pink1 = Pten-induced putative kinase 1.

References

    1. Jagannathan-Bogdan M, Zon LI. Hematopoiesis. Development. 2013;140:2463–2467. - PMC - PubMed
    1. Weissman IL, Anderson DJ, Gage F. Stem and progenitor cells: origins, phenotypes, lineage commitments, and transdifferentiations. Annu Rev Cell Dev Biol. 2001;17:387–403. - PubMed
    1. Suda T, Takubo K, Semenza GL. Metabolic regulation of hematopoietic stem cells in the hypoxic niche. Cell Stem Cell. 2011;9:298–310. - PubMed
    1. Baldwin JE, Krebs H. The evolution of metabolic cycles. Nature. 1981;291:381–382. - PubMed
    1. Spinelli JB, Haigis MC. The multifaceted contributions of mitochondria to cellular metabolism. Nat Cell Biol. 2018;20:745–754. - PMC - PubMed