Review
. 2022 Jun 17:13:885218.
doi: 10.3389/fneur.2022.885218. eCollection 2022.

Myelin Oligodendrocyte Glycoprotein Antibody-Associated Disease (MOGAD): A Review of Clinical and MRI Features, Diagnosis, and Management

Affiliations
Review

Myelin Oligodendrocyte Glycoprotein Antibody-Associated Disease (MOGAD): A Review of Clinical and MRI Features, Diagnosis, and Management

Elia Sechi et al. Front Neurol. .

Abstract

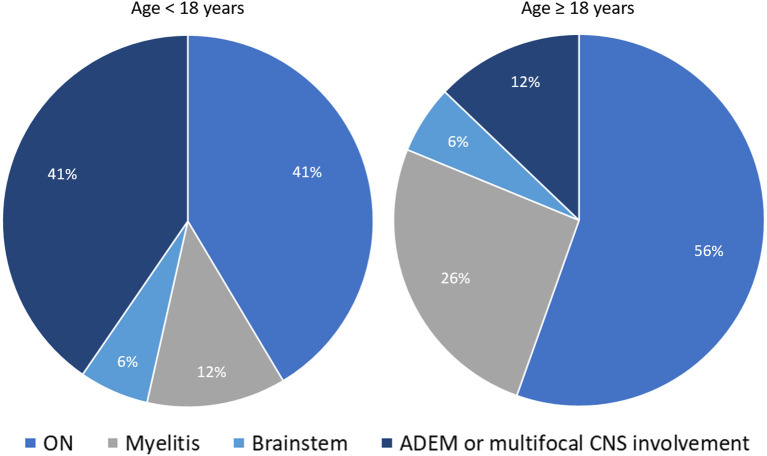
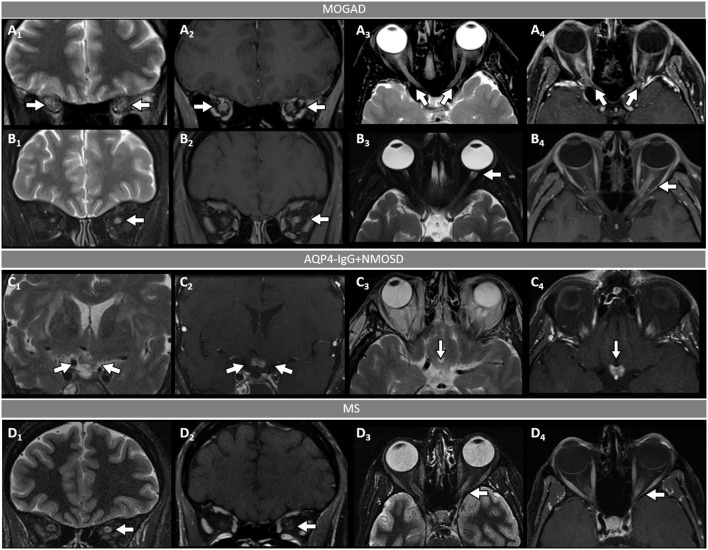
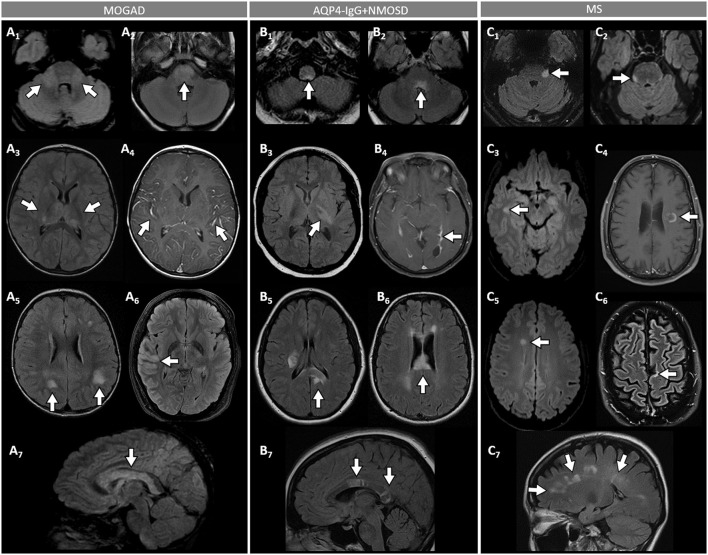
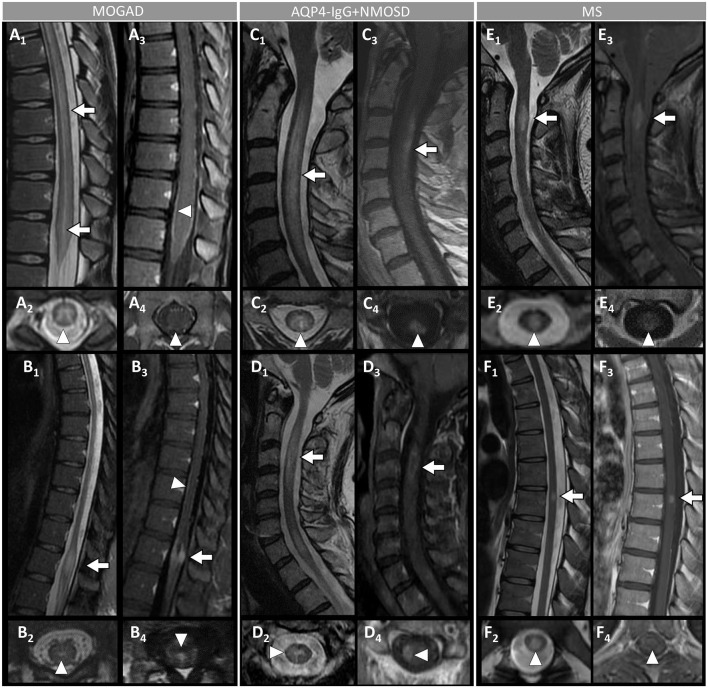
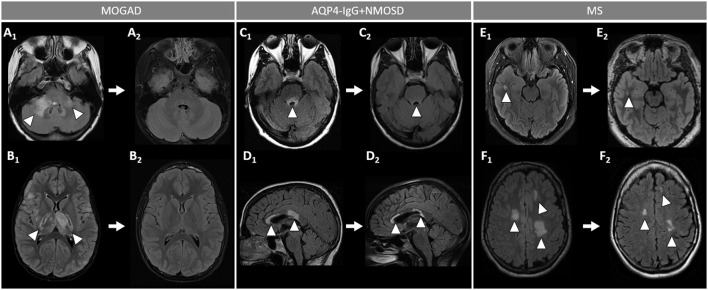
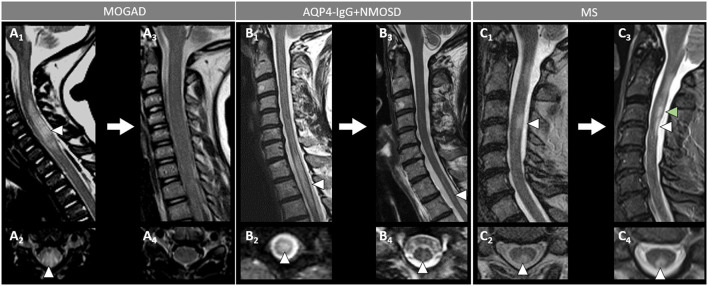
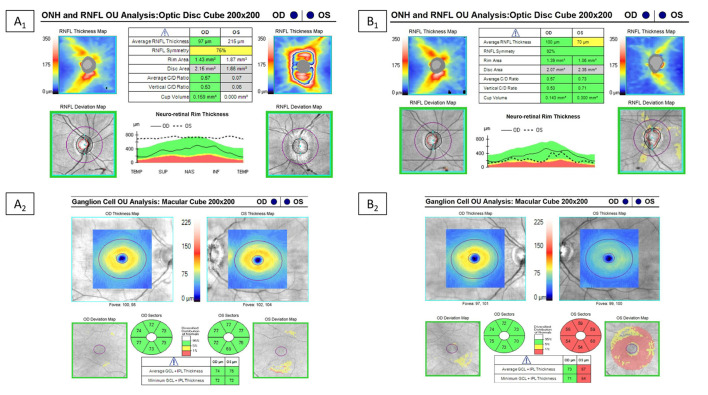
Myelin oligodendrocyte glycoprotein (MOG) antibody-associated disease (MOGAD) is the most recently defined inflammatory demyelinating disease of the central nervous system (CNS). Over the last decade, several studies have helped delineate the characteristic clinical-MRI phenotypes of the disease, allowing distinction from aquaporin-4 (AQP4)-IgG-positive neuromyelitis optica spectrum disorder (AQP4-IgG+NMOSD) and multiple sclerosis (MS). The clinical manifestations of MOGAD are heterogeneous, ranging from isolated optic neuritis or myelitis to multifocal CNS demyelination often in the form of acute disseminated encephalomyelitis (ADEM), or cortical encephalitis. A relapsing course is observed in approximately 50% of patients. Characteristic MRI features have been described that increase the diagnostic suspicion (e.g., perineural optic nerve enhancement, spinal cord H-sign, T2-lesion resolution over time) and help discriminate from MS and AQP4+NMOSD, despite some overlap. The detection of MOG-IgG in the serum (and sometimes CSF) confirms the diagnosis in patients with compatible clinical-MRI phenotypes, but false positive results are occasionally encountered, especially with indiscriminate testing of large unselected populations. The type of cell-based assay used to evaluate for MOG-IgG (fixed vs. live) and antibody end-titer (low vs. high) can influence the likelihood of MOGAD diagnosis. International consensus diagnostic criteria for MOGAD are currently being compiled and will assist in clinical diagnosis and be useful for enrolment in clinical trials. Although randomized controlled trials are lacking, MOGAD acute attacks appear to be very responsive to high dose steroids and plasma exchange may be considered in refractory cases. Attack-prevention treatments also lack class-I data and empiric maintenance treatment is generally reserved for relapsing cases or patients with severe residual disability after the presenting attack. A variety of empiric steroid-sparing immunosuppressants can be considered and may be efficacious based on retrospective or prospective observational studies but prospective randomized placebo-controlled trials are needed to better guide treatment. In summary, this article will review our rapidly evolving understanding of MOGAD diagnosis and management.

Keywords: MOG; NMOSD; demyelinating diseases; differential diagnosis; false positive; multiple sclerosis; neuromyelitis optica.


Conflict of interest statement

The authors declare that the research was conducted in the absence of any commercial or financial relationships that could be construed as a potential conflict of interest.

Figures

Figure 1
Figure 1
Distribution of different disease phenotypes at MOGAD presentation stratified by age. The two pie-charts show the relative frequency of different disease phenotypes at MOGAD onset in patients below 18 years of age and older: ON (optic neuritis, unilateral or bilateral); myelitis; brainstem syndromes; ADEM (acute disseminated encephalomyelitis), or multifocal central nervous system involvement without encephalopathy. Note that the frequency of ADEM is significantly higher in younger patients. The reported frequencies are abstracted from Cobo-Calvo et al. (52).
Figure 2
Figure 2
Orbital fat-saturated MRI in optic neuritis with MOGAD, AQP4-IgG+NMOSD, and MS. [(A,B): MOGAD] Bilateral optic nerve sheath thickening (A1, coronal view, arrows) and optic nerve T2-hyperintensity (A3, axial view, arrows) on T2-weighted images, and corresponding longitudinally extensive optic nerve and sheath enhancement on T1-post gadolinium images (A2, coronal view, arrows, and A4, axial view, arrows). Unilateral left optic nerve T2-hyperintensity on T2-weighted images (B1, coronal view, arrow, and B3, axial view, arrow) and longitudinally extensive enhancement of the left optic nerve on T1-post-gadolinium images (B2, coronal view, arrow, and B4, axial view, arrow). [(C): AQP4-IgG+NMOSD] Bilateral optic chiasm T2-hyperintensity on T2-weighted images (C1, coronal view, arrows, and C3, axial view, arrow) and optic chiasm enhancement on T1-post-gadolinium images (C2 coronal views, arrow, and C4, axial view, arrow). [(D): MS] Unilateral left optic nerve T2-hyperintensity on T2-weighted images (D1, coronal view, arrow, and D3, axial view, arrow), with a corresponding short segment of gadolinium-enhancement on T1-post-gadolinium images (D2, coronal view, arrow, and D4, axial view, arrow). MOGAD, myelin oligodendrocyte glycoprotein antibody-associated disease; AQP4-IgG+NMOSD, aquaporin-4-IgG seropositive neuromyelitis optica spectrum disorder; MS, multiple sclerosis. Definitions: Longitudinally extensive gadolinium enhancement= enhancement involving >50% the length of the optic nerve. Short-segment gadolinium enhancement= enhancement involving <50% the length of the optic nerve.
Figure 3
Figure 3
Brain MRI features in patients with MOGAD, AQP4-IgG+NMOSD, and MS. [(A): MOGAD] T2-hyperintense lesions on axial FLAIR images diffusely involving the middle cerebellar peduncles bilaterally (A1, arrows), pons (A2, arrow), and bilateral thalami (A3, arrows); while extensive leptomeningeal enhancement is noted on axial T1-post gadolinium images (A4, arrows); axial FLAIR images reveal T2-hyperintensities that are poorly marginated or “fluffy” in the hemispheric white matter (A5, arrows), with thickening of the right temporal-parietal cortex (A6, arrow), and diffuse involvement of the corpus callosum on sagittal view (A7, arrow). [(B): AQP4-IgG+NMOSD] Axial FLAIR images show T2-hyperintense lesions in the area postrema (B1, arrow), dorsal pons adjacent to the 4th ventricle (B2, arrow), and left corticospinal tract at level of the internal capsule (B3, arrow); axial T1-post gadolinium image reveals linear ependymal enhancement in the posterior horn of the left lateral ventricle (B4, arrow); FLAIR images reveal T2-hyperintense lesions involving the splenium of the corpus callosum (B5, arrow, axial view) and a diffuse “marble pattern” hyperintensity of the corpus callosum (B6, axial view, arrow, and B7, sagittal view, arrows). [(C): MS] Axial FLAIR images reveal small foci of T2-hyperintensity involving the pons at the emergence of the left trigeminal nerve (C1, arrow), and on its ventral-right surface (C2, arrow); axial FLAIR images reveal periventricular T2-hyperintense lesions in the inferior temporal pole (C3, arrow) and frontal horn with an ovoid appearance (C5, arrow); on axial T1-post gadolinium images an incomplete ring enhancing white matter lesion is shown (C4, arrow); FLAIR images reveal a juxtacortical T2-hyperintense lesion (C6, axial view, arrow) and Dawson's fingers T2-hyperintense lesions (C7, sagittal view, arrows). MOGAD, myelin oligodendrocyte glycoprotein antibody-associated disease; AQP4-IgG+NMOSD, aquaporin-4-IgG seropositive neuromyelitis optica spectrum disorder; MS, multiple sclerosis; FLAIR, fluid attenuated inversion recovery.
Figure 4
Figure 4
Spinal cord MRI features in patients with MOGAD, AQP4-IgG+NMOSD, and MS. [(A,B): MOGAD] A longitudinally-extensive T2-hyperintense lesion involving the conus medullaris on sagittal images (A1, arrows), with T2-hyperintensity restricted to the gray matter forming a H-sign on the axial view (A2), accompanied by leptomeningeal enhancement but no spinal cord parenchymal enhancement on T1-post-gadolinium images (A3, sagittal view, arrowhead, and A4, axial view, arrowhead); a sagittal short T2-hyperintense lesion involving the conus (B1, arrow), centrally located on axial images (B2, arrowhead), with corresponding gadolinium-enhancement (B3, arrow) and leptomeningeal enhancement on T1-post-gadolinium images (B3, sagittal view, arrowhead, and B4, axial view, arrowhead). [(C,D): AQP4-IgG+NMOSD] A sagittal longitudinally-extensive T2-hyperintense cervical cord lesion with spinal cord swelling (C1, arrow), gray matter involvement and T2-“bright spotty sign” on axial view (C2, arrowhead), and gadolinium-enhancement on T1-post-gadolinium images (C3, sagittal view, arrow, and C4, axial view, arrowhead); a sagittal longitudinally extensive T2-hyperintense cervical cord lesion (D1, arrow), predominantly involving the right hemi-cord on axial view (D2, arrowhead), accompanied by ring enhancement (D3, arrow; D4, arrowhead) on T1-post-gadolinium images. [(E,F): MS] A sagittal short T2-hyperintense cervical cord lesion (E1, arrow) involving central spinal cord (E2, arrowhead), showing homogeneous gadolinium-enhancement on T1-post-gadolinium images (E3, sagittal view, arrow, and E4, axial view, arrowhead); a sagittal short T2-hyperintens thoracic spinal cord lesion (F1, arrow), involving the gray matter and the dorsal white matter tracts (F2, arrowhead), with homogeneous enhancement on T1-post-gadolinium images (F3, sagittal view, arrow, and F4, axial view, arrowhead). MOGAD, myelin oligodendrocyte glycoprotein antibody-associated disease; AQP4-IgG+NMOSD, aquaporin-4-IgG seropositive neuromyelitis optica spectrum disorder; MS, multiple sclerosis. Definitions: Longitudinally extensive spinal cord lesion= lesion involving ≥3 vertebral segments. Short spinal cord lesion= lesion involving <3 vertebral segments.
Figure 5
Figure 5
Brain MRI lesion evolution in patients with MOGAD, AQP4-IgG+NMOSD, and MS on FLAIR images. [(A,B): MOGAD] Acute bilateral large T2-hyperintensities of middle cerebellar peduncles (right > left) (A1, arrowheads), and in the thalamus and cortico-spinal tract bilaterally (B1, arrowheads). All T2-lesions had resolved completely by the time of follow-up MRI (A2, B2). [(C D): AQP4-IgG+NMOSD] Acute T2-hyperintense lesion around the 4th ventricle (C1, arrowhead), resolving to nearly undetectable at follow-up MRI (C2, arrowhead); and lesions involving the corpus callosum (D1, arrowheads), undergoing reduction in size without resolution on follow-up MRI (D2, arrowheads). [(E,F): MS] Acute T2-hyperintense white matter lesions (E1, F1, arrowheads), reduced in size but still visible on follow-up MRI (E2, F2, arrowheads). MOGAD, myelin oligodendrocyte glycoprotein antibody-associated disease; AQP4-IgG+NMOSD, aquaporin-4-IgG seropositive neuromyelitis optica spectrum disorder; MS, multiple sclerosis. FLAIR, fluid attenuated inversion recovery.
Figure 6
Figure 6
Spinal cord MRI lesion evolution in patients with MOGAD, AQP4-IgG+NMOSD, and MS on T2-images. [(A): MOGAD) A longitudinally extensive T2-hyperintense spinal cord lesion with accompanying spinal cord swelling (A1, arrowhead) and gray matter involvement (A2, arrowhead), with complete resolution at follow-up (A3, sagittal, and A4, axial view). [(B): AQP4-IgG+NMOSD] A longitudinally extensive T2-hyperintense (B1, arrowhead), centrally located thoracic spinal cord lesion (B2, arrowhead). The T2-lesion has substantially reduced in size at follow-up (B3, arrowhead), with only a mild residual hyperintensity still visible on sagittal view (B3, arrowhead) and axial view (B4, arrowhead). [(C): MS] A short T2-hyperintense cervical cord lesion with accompanying spinal cord swelling (C1, arrowhead) and involving the posterior white matter tracts (C2, arrowhead), with residual T2-hyperintensity and local atrophy at follow-up (C3, sagittal view, white arrowhead, and C4, axial view, arrowhead). At follow-up, the patient also developed a new interval lesion (C3, green arrowhead). MOGAD, myelin oligodendrocyte glycoprotein antibody-associated disease; AQP4-IgG+NMOSD, aquaporin-4-IgG seropositive neuromyelitis optica spectrum disorder; MS, multiple sclerosis.
Figure 7
Figure 7
Example of optical coherence tomography alterations in patients with MOGAD ON. Optical coherence tomography in a MOGAD patient with optic neuritis in the left eye. Left images (A1,A2) are the OCT images at the time of the acute optic neuritis, which shows significant peripapillary retinal nerve fiber layer thickening (RNFL) in the left eye and a normal ganglion cell-inner plexiform layer (GC-IPL) thickness. Images on the right (B1,B2) are the repeat OCT 1 year after the optic neuritis attack, which shows thinning of the peripapillary RNFL and macular GC-IPL in the left eye despite recovery back to a visual acuity of 20/20.

Similar articles

Cited by

References

    1. Lennon VA, Wingerchuk DM, Kryzer TJ, Pittock SJ, Lucchinetti CF, Fujihara K, et al. . A serum autoantibody marker of neuromyelitis optica: distinction from multiple sclerosis. Lancet. (2004) 364:2106–12. 10.1016/S0140-6736(04)17551-X - DOI - PubMed
    1. O'Connor KC, McLaughlin KA, De Jager PL, Chitnis T, Bettelli E, Xu C, et al. . Self-antigen tetramers discriminate between myelin autoantibodies to native or denatured protein. Nat Med. (2007) 13:211–7. 10.1038/nm1488 - DOI - PMC - PubMed
    1. Reindl M, Waters P. Myelin oligodendrocyte glycoprotein antibodies in neurological disease. Nat Rev Neurol. (2019) 15:89–102. 10.1038/s41582-018-0112-x - DOI - PubMed
    1. Flanagan EP. Neuromyelitis optica spectrum disorder and other non-multiple sclerosis central nervous system inflammatory diseases. Continuum (Minneap Minn). (2019) 25:815–44. 10.1212/CON.0000000000000742 - DOI - PubMed
    1. Jarius S, Wildemann B. The history of neuromyelitis optica. J Neuroinflammation. (2013) 10:8. 10.1186/1742-2094-10-8 - DOI - PMC - PubMed

LinkOut - more resources