. 2022 Jun 16:13:871166.
doi: 10.3389/fneur.2022.871166. eCollection 2022.

A Novel Approach to Estimating the Cortical Sources of Sleep Spindles Using Simultaneous EEG/MEG

Affiliations

A Novel Approach to Estimating the Cortical Sources of Sleep Spindles Using Simultaneous EEG/MEG

Dimitrios Mylonas et al. Front Neurol. .

Abstract

Sleep spindles, defining oscillations of stage II non-rapid eye movement sleep (N2), mediate sleep-dependent memory consolidation. Spindles are disrupted in several neurodevelopmental, neuropsychiatric, and neurodegenerative disorders characterized by cognitive impairment. Increasing spindles can improve memory suggesting spindles as a promising physiological target for the development of cognitive enhancing therapies. This effort would benefit from more comprehensive and spatially precise methods to characterize spindles. Spindles, as detected with electroencephalography (EEG), are often widespread across electrodes. Available evidence, however, suggests that they act locally to enhance cortical plasticity in the service of memory consolidation. Here, we present a novel method to enhance the spatial specificity of cortical source estimates of spindles using combined EEG and magnetoencephalography (MEG) data constrained to the cortex based on structural MRI. To illustrate this method, we used simultaneous EEG and MEG recordings from 25 healthy adults during a daytime nap. We first validated source space spindle detection using only EEG data by demonstrating strong temporal correspondence with sensor space EEG spindle detection (gold standard). We then demonstrated that spindle source estimates using EEG alone, MEG alone and combined EEG/MEG are stable across nap sessions. EEG detected more source space spindles than MEG and each modality detected non-overlapping spindles that had distinct cortical source distributions. Source space EEG was more sensitive to spindles in medial frontal and lateral prefrontal cortex, while MEG was more sensitive to spindles in somatosensory and motor cortices. By combining EEG and MEG data this method leverages the differential spatial sensitivities of the two modalities to obtain a more comprehensive and spatially specific source estimation of spindles than possible with either modality alone.

Keywords: EEG; MEG (magnetoencephalography); cortical sources; sleep oscillations; sleep spindles; source localization; stage 2 NREM sleep.


Conflict of interest statement

The authors declare that the research was conducted in the absence of any commercial or financial relationships that could be construed as a potential conflict of interest.

Figures
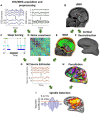
Figure 1
Figure 1
Schematic description of source space spindle detection. (A) Pre-processing of simultaneously acquired EEG/MEG data. (B) Structural MRI. (C) Sleep scoring of nap data. (D) Noise covariance estimates calculated using the EEG/MEG data from the 5 min resting-state scan filtered at 100–140 Hz. (E) Construction of a three-layer boundary element model (BEM) surfaces (inner, outer skull, and scalp) for forward modeling (F) Cortical reconstruction. (G) Source estimates of N2 calculated using the cortically constrained minimum-norm estimate of cortical currents. (H) Parcellation of the cortical surface into 448 regions. (I) Automatic spindle detection at each cortical region using a wavelet-based detector.
Figure 2
Figure 2
Definition of spindle events. Top: Example of 10 s of N2 signal from 20 EEG electrodes. Detected spindles at each sensor are highlighted in red. Bottom: The raw aggregate signal (red) and smoothed signal (black). Spindle events were defined as 1 s time-windows around the peaks of the smoothed signal (gray patch). The maximum amplitude within this window reflects the spatial extent of the detected spindle event. The same definition applies to MEG sensors and source space analyses.
Figure 3
Figure 3
Spindle events in source vs. sensor space EEG. (A) Spindle event density in source vs. sensor space. Regression line (black solid) and the identity line (gray dashed) are shown. (B) Correspondence of spindle events detected at the source vs. the sensor space (F1 = 0.83 ± 0.03, fP = 0.80 ± 0.04, fR = 0.86 ± 0.04). (C) Spatial extent of spindle events in source vs. sensor space with regression line.
Figure 4
Figure 4
Topography of spindle events detected only in source space EEG (FPs). The color of each region represents the number of FPs expressed in this region over the total number of FPs as a percentage.
Figure 5
Figure 5
Test-retest reliability of spindle events across naps for each modality. Plot of spindle event density for each subject during Nap 1 and Nap 2. Spindle events were detected (from top to bottom) at scalp EEG, source EEG, MEG, and EEG/MEG.
Figure 6
Figure 6
Spindle events in source space using EEG alone, MEG alone and combined EEG/MEG. (A) Venn diagram and violin plots depicting spindle event density in EEG, MEG, and EEG/MEG with p-values for pairwise comparisons. (B) Percent of uniquely detected spindle events by each modality for EEG vs. MEG, EEG vs. EEG/MEG, and MEG vs. EEG/MEG. (C) Spatial specificity of commonly detected spindle events (intersection of Venn diagrams). Spatial extent of spindle events detected by EEG and MEG, EEG and EEG/MEG, and MEG and EEG/MEG. Black circles represent individual data.
Figure 7
Figure 7
Topography of spindle events uniquely detected by (A) EEG and (B) MEG. The color represents the percent of spindle events detected in each region relative to the total spindle events detected.

References

    1. Steriade M, Domich L, Oakson G, Deschenes M. The deafferented reticular thalamic nucleas generates spindle rhythmicity. J Neurophysiol. (1987) 57:260–73. 10.1152/jn.1987.57.1.260 - DOI - PubMed
    1. Steriade M, Deschenes M, Domich L, Mulle C. Abolition of spindle oscillations in thalamic neurons disconnected from nucleus reticularis thalami. J Neurophysiol. (1985) 54:1473–97. 10.1152/jn.1985.54.6.1473 - DOI - PubMed
    1. Contreras D, Destexhe A, Sejnowski TJ, Steriade M. Spatiotemporal patterns of spindle oscillations in cortex and thalamus. J Neurosci. (1997) 17:1179–96. 10.1523/JNEUROSCI.17-03-01179.1997 - DOI - PMC - PubMed
    1. Cox R, Schapiro AC, Manoach DS, Stickgold R. Individual differences in frequency and topography of slow and fast sleep spindles. Front Hum Neurosci. (2017) 11:433. 10.3389/fnhum.2017.00433 - DOI - PMC - PubMed
    1. Purcell SM, Manoach DS, Demanuele C, Cade BE, Mariani S, Cox R, et al. . Characterizing sleep spindles in 11,630 individuals from the national sleep research resource. Nat Commun. (2017) 8:15930. 10.1038/ncomms15930 - DOI - PMC - PubMed