. 2022 Nov;29(11):3418-3448.
doi: 10.1111/ene.15483. Epub 2022 Jul 22.

Structural magnetic resonance imaging in dystonia: A systematic review of methodological approaches and findings

Affiliations

Structural magnetic resonance imaging in dystonia: A systematic review of methodological approaches and findings

Claire L MacIver et al. Eur J Neurol. 2022 Nov.

Abstract

Background and purpose: Structural magnetic resonance techniques have been widely applied in neurological disorders to better understand tissue changes, probing characteristics such as volume, iron deposition and diffusion. Dystonia is a hyperkinetic movement disorder, resulting in abnormal postures and pain. Its pathophysiology is poorly understood, with normal routine clinical imaging in idiopathic forms. More advanced tools provide an opportunity to identify smaller scale structural changes which may underpin pathophysiology. This review aims to provide an overview of methodological approaches undertaken in structural brain imaging of dystonia cohorts, and to identify commonly identified pathways, networks or regions that are implicated in pathogenesis.

Methods: Structural magnetic resonance imaging studies of idiopathic and genetic forms of dystonia were systematically reviewed. Adhering to strict inclusion and exclusion criteria, PubMed and Embase databases were searched up to January 2022, with studies reviewed for methodological quality and key findings.

Results: Seventy-seven studies were included, involving 1945 participants. The majority of studies employed diffusion tensor imaging (DTI) (n = 45) or volumetric analyses (n = 37), with frequently implicated areas of abnormality in the brainstem, cerebellum, basal ganglia and sensorimotor cortex and their interconnecting white matter pathways. Genotypic and motor phenotypic variation emerged, for example fewer cerebello-thalamic tractography streamlines in genetic forms than idiopathic and higher grey matter volumes in task-specific than non-task-specific dystonias.

Discussion: Work to date suggests microstructural brain changes in those diagnosed with dystonia, although the underlying nature of these changes remains undetermined. Employment of techniques such as multiple diffusion weightings or multi-exponential relaxometry has the potential to enhance understanding of these differences.

Keywords: MRI; diffusion MRI; dystonia; movement disorders; systematic review.


Conflict of interest statement

No conflict of interest to declare.

Figures

FIGURE 1
FIGURE 1
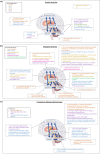
Motor control pathways and proposed pathological mechanisms in dystonia. Differences are relative to healthy controls unless otherwise stated [Colour figure can be viewed at wileyonlinelibrary.com]
FIGURE 2
FIGURE 2
Common structural measures. 2.1 Examples of structural measurements. (1a) DTI properties with examples showing a relatively high FA and AxD, a lower FA and MD, and a low FA but a high MD. (1b) Examples of volume/size‐based measures with the shaded area representing the measured volume for the segmented region and the arrow indicating the cortical thickness (CT). (1c) Relaxometry examples showing the hydrogen ions aligned in the magnetic field of an MR scanner, with the application of a radiofrequency pulse causing them to come out of alignment with the magnetic field (blue arrows) and their spins coming out of alignment with each other (black arrows). T1 is the time taken for longitudinal relaxation (i.e., the blue arrow to return to alignment with the main magnetic field) and T2 is the time taken for transverse relaxation (i.e., the black arrows to return to being out of phase with each other), with T2* being additionally influenced by local magnetic field differences. Proton density is a measure of how densely packed the protons are. (1d) Magnetization transfer imaging, showing bound and unbound protons in a magnetic field, with a radiofrequency pulse aimed mainly at bound protons applied, and then the transfer of this magnetization to the unbound protons which produces a measurable signal; this is MT weighting. MTR is the difference between an acquisition with and without this off‐resonance pulse. 2.2 Examples of factors influencing structural measures for FA (2a), volumetry (2b), T2 relaxometry (2c) and magnetization transfer ratio (2d) [Colour figure can be viewed at wileyonlinelibrary.com]
FIGURE 3
FIGURE 3
Structural imaging approaches. 3.1 Examples of factors influencing measured parameters. (1a–1c) Examples of the effect of differing voxel size and anisotropy on partial volume effect in white matter, with (1a) showing small isotropic voxels, (1b) larger voxels and (1c) anisotropic voxels, with more inclusion of tracts with different orientations in the larger and anisotropic voxels, which would influence the fractional anisotropy (FA) measured. (1d) Example of the effect of motion on a T2‐weighted image, (1e) a gradient deviation map showing variation in the magnetic field and (1f) an example of the signal removed from the Gibbs ringing artifact in diffusion MRI. 3.2 DTI as an example of the range of potential analysis approaches: (2a) a map of MD (mean diffusivity) values, (2b) a map of FA values, (2c) T directional orientation colour‐coded FA map, (2d) tract‐based spatial statistics, (2e) graph theoretical analysis, (2f) a region of interest delineated in the cerebellum and (2g) an example of a tractography reconstruction using regions of interest to define way‐points along the tract [Colour figure can be viewed at wileyonlinelibrary.com]
FIGURE 4
FIGURE 4
Summary of structural MRI findings in dystonia. (a) shows findings amongst genetic dystonias (b) amongst idiopathic dystonias and part (c) shows comparisons of different dystonia subtypes. Values are relative to healthy controls unless otherwise stated. FA, fractional anisotropy; MD, mean diffusivity; GM, grey matter; WM, white matter; L, left; R, right; TSD, task‐specific dystonia; NTSD, non‐task‐specific dystonia; NMC, non‐manifesting carriers [Colour figure can be viewed at wileyonlinelibrary.com]

References

    1. Bailey GA, Rawlings A, Torabi F, Pickrell WO, Peall KJ. Adult‐onset idiopathic dystonia: a national data‐linkage study to determine epidemiological, social deprivation and mortality characteristics. Eur J Neurol. 2022;29(1):91‐104. - PMC - PubMed
    1. Albanese A, Bhatia K, Bressman SB, et al. Phenomenology and classification of dystonia: a consensus update. Mov Disord. 2013;28(7):863‐873. - PMC - PubMed
    1. Wilson BK, Hess EJ. Animal models for dystonia. Mov Disord. 2013;28(7):982‐989. - PMC - PubMed
    1. Prudente CN, Pardo CA, Xiao J, et al. Neuropathology of cervical dystonia. Exp Neurol. 2013;241:95‐104. - PMC - PubMed
    1. Zoons E, Booij J, Nederveen AJ, Dijk JM, Tijssen MA. Structural, functional and molecular imaging of the brain in primary focal dystonia—a review. Neuroimage. 2011;56(3):1011‐1020. - PubMed

Publication types