Single-cell transcriptomics reveals a senescence-associated IL-6/CCR6 axis driving radiodermatitis
- PMID: 35785521
- PMCID: PMC9358397
- DOI: 10.15252/emmm.202115653
Single-cell transcriptomics reveals a senescence-associated IL-6/CCR6 axis driving radiodermatitis
Abstract
Irradiation-induced alopecia and dermatitis (IRIAD) are two of the most visually recognized complications of radiotherapy, of which the molecular and cellular basis remains largely unclear. By combining scRNA-seq analysis of whole skin-derived irradiated cells with genetic ablation and molecular inhibition studies, we show that senescence-associated IL-6 and IL-1 signaling, together with IL-17 upregulation and CCR6+ -mediated immune cell migration, are crucial drivers of IRIAD. Bioinformatics analysis colocalized irradiation-induced IL-6 signaling with senescence pathway upregulation largely within epidermal hair follicles, basal keratinocytes, and dermal fibroblasts. Loss of cytokine signaling by genetic ablation in IL-6-/- or IL-1R-/- mice, or by molecular blockade, strongly ameliorated IRIAD, as did deficiency of CCL20/CCR6-mediated immune cell migration in CCR6-/- mice. Moreover, IL-6 deficiency strongly reduced IL-17, IL-22, CCL20, and CCR6 upregulation, whereas CCR6 deficiency reciprocally diminished IL-6, IL-17, CCL3, and MHC upregulation, suggesting that proximity-dependent cellular cross talk promotes IRIAD. Therapeutically, topical application of Janus kinase blockers or inhibition of T-cell activation by cyclosporine effectively reduced IRIAD, suggesting the potential of targeted approaches for the treatment of dermal side effects in radiotherapy patients.
Keywords: CCR6; IL-6; alopecia; radiodermatitis; senescence.
© 2022 The Authors. Published under the terms of the CC BY 4.0 license.
Figures

- A
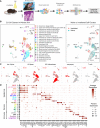
Schematic of scRNA‐seq experimental workflow.
- B
UMAP projection of 8,805 cells from irradiated and naïve mouse skin integrated into 21 clusters. Cells are colored by the assigned cluster (middle). (Right) UMAP projection showing cluster composition according to cell origin in naïve or irradiated skin.
- C
Naïve expression of the hair follicle (Ptn), IFE Basal (Krt14), IFE Differentiated (Krt10), fibroblast (Col3a1), and immune T cell (Cd3d) transcripts visualized by UMAP across scRNA‐seq datasets from integrated naïve and irradiated skin.
- D
Dot plot depicting integrated naïve‐irradiated clusters according to skin cell‐type‐specific marker expression in the naïve cells.

- A
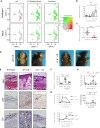
Relative expression and co‐localization of Senescence Score (red) and Cell Cycle Score (Mki67, Gmnn, Ccna1; green) in integrated skin cells by blended UMAPs. Blowup: Regions of IEF‐2 and uHF‐I/INFU‐B showing exclusive mitotic activity (outlined in blue).
- B
Dot plot depicting the relative expression of selected IPA‐defined senescence‐related markers and cell cycle markers (framed in red) (x‐axis) in naïve (blue dots) and irradiated (red dots) scRNA‐seq skin cell clusters.
- C
UMAP plots depicting relative expression and localization of urokinase‐type plasminogen activator receptor (Plaur) mRNA in irradiated and naïve skin‐derived clusters.
- D
Immunostaining and histochemical staining (brown) of urokinase‐type plasminogen activator receptor (uPAR), p16INK4a, and lipofuscin (SenTraGor®) in paraffin‐embedded skin thin sections from ventral neck and upper chest region of naïve and irradiated (15 Gy) wild type mice taken at 21 days post‐IR. p16INK4a immunostaining appears as nuclear and/or cytoplasmic staining (Arrows) in IFE keratinocytes, in cells comprising discrete hair follicle layers, and in distinct cells in the dermis. Scale bars, 20 μm.

- A
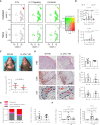
Relative expression and co‐localization of IL6 mRNA and IL‐6 Signaling Scoring in integrated skin cells by blended UMAPs.
- B
Quantification by real‐time qPCR analysis of Il6 mRNA in the skin of naïve and irradiated (15 Gy) WT mice at indicated times, (n = 3–6).
- C
Quantification of ventral hair loss area 21 days post‐IR (15 Gy) in WT and IL‐6−/− mice, (n = 11).
- D
Photographic images showing hair loss (area demarked by yellow dashed line) 21 days post‐IR (15 Gy) in wild type (WT) and IL‐6−/− mice.
- E
Histochemical (H&E) and immunostaining (red) showing skin morphology, and T‐cell (CD3+) and neutrophil (Ly6b+) infiltration in WT or IL‐6−/− mice before (naïve), and 14 days (H&E, Ly6b+), or 21 days (CD3+) post‐IR. Infiltrating CD3+ T cells (yellow arrows) within degenerating hair follicles (HF; dashed lines) are indicated. Scale bars, 100 μm.
- F
Quantification of epidermal thickness at 14 days post‐IR (n = 5–8).
- G
Kinetics of neutrophil (Ly6b+; n = 3–9) and T‐cell (CD3+; n = 3) infiltration.
- H
Quantification by real‐time qPCR analysis of Tnfa and Ccl3 mRNAs in whole skin of WT and IL‐6−/− mice at indicated times post‐IR (15 Gy), (n = 5–7).

- A
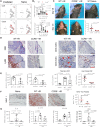
Photographic images depicting the kinetics of radiodermatitis and hair loss in ventral views of representative wild‐type mice irradiated (15 Gy) to the head and neck. Times (in days) post‐IR are indicated. Serous exudates appear under the chin at 8 days post‐IR with desquamation and alopecia beginning at about 14 days post‐IR.
- B
Photographic images showing ventral alopecia in wild‐type mice treated with neutralizing IL‐6 mAb (Anti‐IL‐6) or control mAb (IgG; 200 μg, i.p) prior to and 8 days following irradiation (14 Gy) to the head and neck. Two independent experiments.
- C
Quantification of the area of hair loss of mice in (B) at 14 days post‐IR, (n = 4–5). Data are individual mice. Two independent experiments.
- D
Histochemical (H&E) and immunostaining of skin thin sections from mice in (B) showing morphology and neutrophil (Ly6b) infiltration (red staining). Scale bar, 50 μm.
- E
Quantification of epidermal thickness in specimens from (D), (n = 4–5).
- F
Photographic images showing ventral alopecia in wild‐type mice (WT) and sgp130Fc transgenic mice irradiated (14 Gy) to the head and neck 21 days post‐IR. Five independent experiments.
- G
Quantification of the area of hair loss of mice in (F), (n = 4).
- H
Histochemical (H&E) staining of skin thin sections from mice in (F) and quantification of the epidermal thickness (right), (n = 4–7). Scale bar, 100 μm.

- A
Western blot analysis shows phosphorylated STAT3 (p‐Stat3), Erk1 and Erk2 (p‐Erk1/2), and β‐Actin in the skin of WT, IL‐6−/−, and IL‐1R−/− mice at indicated times (days) post‐IR (15 Gy).
- B
Histochemical (H&E) and immunostaining (red) staining of T cells (CD3+), neutrophils (Ly6b+), and phosphorylated Stat3 (p‐Stat3; red nuclear staining, black arrows) in skin thin sections prepared at 14 days post‐IR from mice treated by daily topical application of aquosum (control), ruxolitinib, or tofacitinib following irradiation (15 Gy). Scale bar, 100 μm. (CD3 and Ly6b immunostaining images from Tofacitinib‐treated mice represent separate analyses performed on serial thin sections.)
- C
Quantification of epidermal thickness, T cells (CD3+) and neutrophils (Ly6b+), and p‐STAT3+ cells in (B), (n = 4).
- D
Photographic images showing hair loss in mice at 14 days post‐IR (15 Gy) following treatment by daily topical application of aquosum (carrier control) or JAK inhibitors, ruxolitinib, or tofacitinib. Chest and neck hairs of mice in all groups were clipped prior to irradiation to enhance drug absorption.
- E
Quantification of the area of ventral hair loss (in pixels) in mice in (D), (n = 4).

- A
Relative expression and co‐localization of IL‐6 Signaling (Red; see also Appendix Fig S7B) and Senescence Pathway (Green; see also Fig EV1B) scoring in integrated skin cells by blended UMAPs.
- B
Photographic images showing immunostaining of p16INK4a (arrows) and lipofuscin (brown stain) in irradiated (15 Gy) IL‐6−/− mice skin thin sections compared to irradiated wild type (WT) mice 21 days post‐IR WT. Scale bar, 20 μm.
- C
Photographic images showing hair depigmentation in representative naïve WT and irradiated (15 Gy) WT and IL‐6−/− mice at 8 weeks post‐IR. (Four independent experiments.)

- A
UMAP plots depicting relative expression and localization of Il1a and Il1b mRNAs in irradiated and naïve skin‐derived cell clusters.
- B
Photographic images showing hair loss 14 days post‐IR (15 Gy) in WT and IL‐1R−/− mice.
- C
Quantification of ventral hair loss area 14 days post‐IR (15 Gy) in WT and IL‐1R−/− mice, (n = 4).
- D
Histochemical (H&E) and immunostaining (red) showing morphology and neutrophil (Ly6b) infiltration in the skin of mice in (B). Scale bar, 50 μm.
- E
Quantification of epidermal thickness, neutrophils (Ly6b), and T cells (CD3+) in specimens in (D), (n = 4).

- A
Relative expression and co‐localization of Il17a mRNA and IL‐17 Signaling in integrated skin cells by blended UMAPs.
- B
Quantification by real‐time qPCR analysis of Il17a and Il22 mRNAs in whole skin of naïve and irradiated (15 Gy) WT and IL‐6−/− mice at indicated times post‐IR, (n = 4–7).
- C
Photographic images showing hair loss and radiodermatitis at 14 days post‐IR (15 Gy) in representative WT and IL‐17−/− mice and quantification (below) of the area of ventral hair loss, (n = 6–8).
- D
Histochemical staining (H&E), immunostaining (red), and quantification (right) of acanthosis and infiltration of neutrophils (Ly6b+) and T cell (CD3+; red arrows) to the skin and to the hair follicle (HF; dashed lines) in irradiated WT and mice in (C), (n = 6–7). Scale bars, 50 μm (black) and 25 μm (red).
- E
Quantification of normal and degenerate hair follicles shown in H&E sections (left) and of T cell (CD3) infiltration into the hair follicle (HF; right) shown in (D), (n = 6–7).
- F
Quantification by real‐time qPCR analysis of Il6 and Ccl3 mRNAs in the skin of WT and IL‐6−/− mice before (naïve) and 14 days post‐IR (15 Gy, n = 4–7).

- A
UMAP plots depicting relative expression and localization of Ccr6 and Ccl20 mRNAs in irradiated and naïve skin‐derived cell clusters.
- B
Quantification by real‐time qPCR analysis of Ccr6 and Ccl20 mRNAs in whole skin of naïve and irradiated (15 Gy) WT and IL‐6−/− mice at indicated times post‐IR, (n = 5–7).
- C
Photographic images showing the development of radiodermatitis and alopecia in irradiated (15 Gy) WT and CCR6−/− mice at indicated times post‐IR. Escalating radiodermatitis, which manifests on day 7–10 as serous exudates on the chin and neck, is visible in both strains and progresses in WT mice to alopecia by day 14 post‐IR but resolves spontaneously in the CCR6−/− mice. Quantification (lower right) of the area of hair loss at 14 days post‐IR, (n = 6).
- D
Histochemical staining (H&E) and immunostaining (red) show morphology and infiltration of neutrophils (Ly6b+) and T cells (CD3+; red arrows) to the skin and to the hair follicle (HF; dashed lines) in WT or CCR6−/− mice 14 days post‐IR. Scale bars, 50 μm (black) and 25 μm (red).
- E
Quantification of epidermal thickness, neutrophils (Ly6b+), total T‐cell (CD3+) infiltration to the skin, and (F) CD3+ cells infiltration to the hair follicle in (D), (n = 5–6).
- F
MHC class I immunostaining (red) of skin thin sections prepared at 14 days post‐IR from mice in (C), and quantification (right) of MHC I‐positive hair follicles, (n = 4–5). Scale bar, 50 μm.
- G
Quantification by real‐time qPCR analysis of Il6, Il17a, Ccl20, and Ccl3 mRNAs in the skin of naïve WT and irradiated (15 Gy) WT and CCR6−/− mice at 14 days post‐IR, (n = 3–5).

- A
Photographic images showing hair loss in control (PBS) and cyclosporine (CsA) treated WT mice at 14 days post‐IR (15 Gy).
- B
Quantification of the area of ventral hair loss in mice in (A), (n = 6).
- C
Histochemical (H&E) and immunostaining (red) show T cell (CD3+) and neutrophil (Ly6b+) infiltration in the skin of mice in (A). Scale bar, 100 μm. (Images of CD3 and Ly6b immunostaining from CsA‐treated mice represent separate analyses performed on serial thin sections.)
- D
Quantification of epidermal thickness, and T‐cell (CD3+) and neutrophil (Ly6b+) infiltration (red staining) in skin thin sections from (C), (n = 6).
- E
Quantification by real‐time qPCR analysis of Il6, Il17a, II22, Ccl3, Ccr6, and Ccl20 mRNAs in whole skin of naïve and irradiated (15 Gy) control (PBS) and CSA‐treated WT mice at 14 days post‐IR, (n = 5).
References
-
- Albanesi C, Cavani A, Girolomoni G (1999) IL‐17 is produced by nickel‐specific T lymphocytes and regulates ICAM‐1 expression and chemokine production in human keratinocytes: synergistic or antagonist effects with IFN‐gamma and TNF‐alpha. J Immunol 162: 494–502 - PubMed
-
- Becht E, McInnes L, Healy J, Dutertre CA, Kwok IWH, Ng LG, Ginhoux F, Newell EW (2018) Dimensionality reduction for visualizing single‐cell data using UMAP. Nat Biotechnol 37: 38–44 - PubMed
-
- Brown KR, Rzucidlo E (2011) Acute and chronic radiation injury. J Vasc Surg 53: 15S–21S - PubMed
-
- Burdelya LG, Gleiberman AS, Toshkov I, Aygun‐Sunar S, Bapardekar M, Manderscheid‐Kern P, Bellnier D, Krivokrysenko VI, Feinstein E, Gudkov AV (2012) Toll‐like receptor 5 agonist protects mice from dermatitis and oral mucositis caused by local radiation: Implications for head‐and‐neck cancer radiotherapy. Int J Radiat Oncol Biol Phys 83: 228–234 - PMC - PubMed
Publication types
MeSH terms
Substances
Associated data
- Actions
LinkOut - more resources
Full Text Sources
Molecular Biology Databases
Research Materials

