. 2022 Nov;42(11):2017-2031.
doi: 10.1177/0271678X221109997. Epub 2022 Jul 3.

High-resolution 3D demonstration of regional heterogeneity in the glymphatic system

Affiliations

High-resolution 3D demonstration of regional heterogeneity in the glymphatic system

Xu-Zhong He et al. J Cereb Blood Flow Metab. 2022 Nov.

Abstract

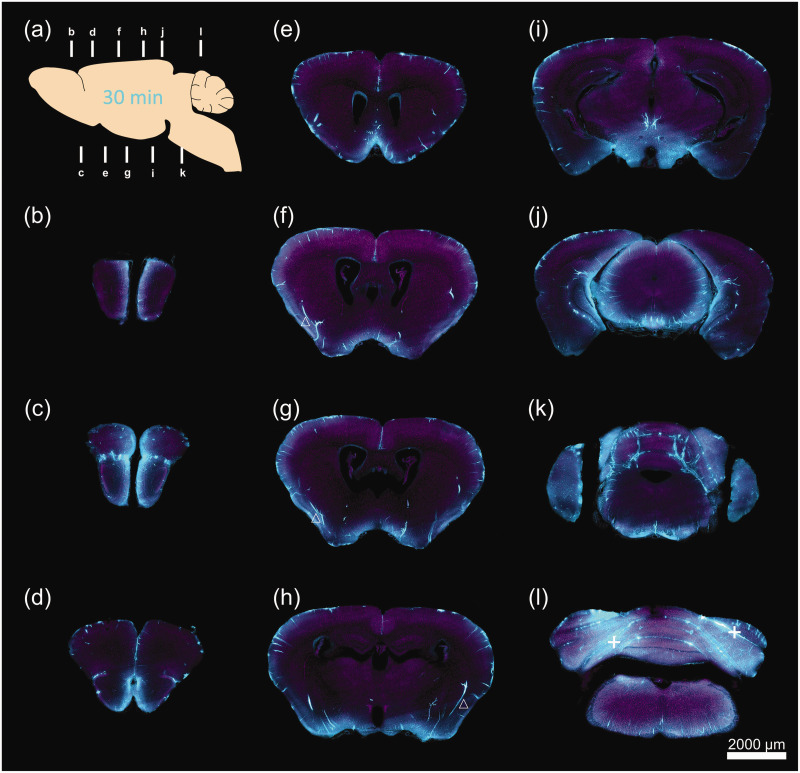
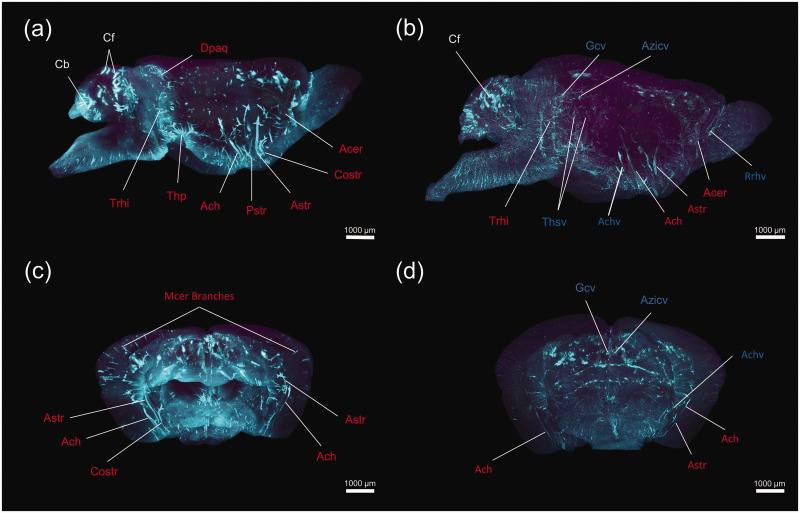
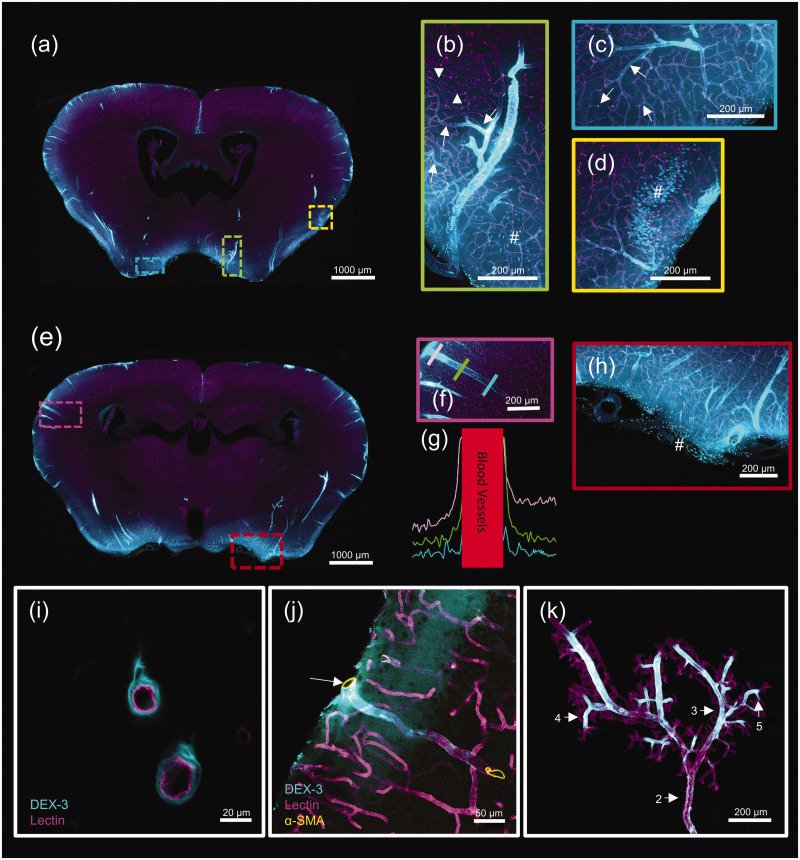
Accumulating evidence indicates that the glymphatic system has a critical role in maintaining brain homeostasis. However, the detailed anatomy of the glymphatic pathway is not well understood, mostly due to a lack of high spatial resolution 3D visualization. In this study, a fluorescence micro-optical sectioning tomography (fMOST) was used to characterize the glymphatic architecture in the mouse brain. At 30 and 120 min after intracisternal infusion with fluorescent dextran (Dex-3), lectin was injected to stain the cerebral vasculature. Using fMOST, a high-resolution 3D dataset of the brain-wide distribution of Dex-3 was acquired. Combined with fluorescence microscopy and microplate array, the heterogeneous glymphatic flow and the preferential irrigated regions were identified. These cerebral regions containing large-caliber penetrating arteries and/or adjacent to the subarachnoid space had more robust CSF flow compared to other regions. Moreover, the major glymphatic vessels for CSF influx and fluid efflux in the entire brain were shown in 3D. This study demonstrates the regional heterogeneity in the glymphatic system and provides an anatomical resource for further investigation of the glymphatic function.

Keywords: Glymphatic system; cerebrospinal fluid; fluorescence micro-optical sectioning tomography; paravascular spaces; vasculature.


Conflict of interest statement

The author(s) declared no potential conflicts of interest with respect to the research, authorship, and/or publication of this article.

Figures

Figure 1.
Figure 1.
A 3D visualization of CSF tracer distribution on the whole-brain surface. Representative images of whole-brain ventral view (a and d), dorsal view (b and e), and lateral view (c and f) 3D reconstruction of CSF tracer (Dex-3, green) in mice brain. Dex-3 distribution 30 min (a–c) and 120 min (d–f) after CM infusion. The brain regions and blood vessels with strong tracer labeling are marked in each panel. Olfa: olfactory artery; Acer: anterior cerebral artery; Mcer: middle cerebral artery; Ictd: internal carotid artery; Pcer: posterior cerebral artery; Scba: superior cerebellar artery; Bas: basilar artery; Aica: anterior inferior cerebellar artery; Sos: superior olfactory sinus; Rcs: rostral confluence of sinuses; Sss: Superior sagittal sinus; Ts: transverse sinus; Ss: sigmoid sinus; Rrhv: rostral rhinal vein; Crhv: caudal rhinal vein; Mcerv: middle cerebral vein; HYP: hypothalamus; PGN: pontine gray nuclei; MED: medulla; SC: superior colliculus.
Figure 2.
Figure 2.
A 2D demonstration of CSF tracer penetration into the mouse brain 30 min after CM infusion. (a) Schematic diagram of sagittal plane showing the locations of slicing for coronal sections. (b-l) Representative images of reconstructed coronal brain slices demonstrating the penetration of Dex-3 (blue) into the brain at 11 different locations. The inner wall of blood vessels was stained by lectin (purple). (b) +4.28, (c) +3.08, (d) +2.68, (e) +1.10, (f) −0.10, (g) −0.22, (h) −1.58, (i) −2.80, (j) −4.04, (k) −4.72 and (l) −5.68 mm from bregma. △ tracers along arteries. + tracers along cerebellar fissures.
Figure 3.
Figure 3.
A 2 D demonstration of tracer distribution in the mouse brain 120 min and quantification analysis of tracer intensity 30 and 120 min after CM infusion. (a) Schematic diagram of sagittal plane exhibiting the locations of slicing for coronal sections. (b-l) Representative images of reconstructed coronal brain slices demonstrating the residual Dex-3 (blue) in the brain at 11 different locations. (b) +4.28, (c) +3.08, (d) +2.68, (e) +1.10, (f) −0.10, (g) −0.22, (h) −1.58, (i) −2.30, (j) −3.28, (k) −4.72, (l) −5.68 mm from bregma. (m–n) Quantification of tracer fluorescence within defined brain regions on the slices obtained from conventional vibratome slicing 30 min (m) and 120 min (n) after CM infusion (representative images and ROI see Supplementary Figure 2). N = 5 for all groups, *P < 0.05, **P < 0.01, ***P < 0.001 vs DC. ▲ tracers along veins, + tracers along cerebellar fissures. DC: dorsal cortex; LC: lateral cortex; VC: ventral cortex; WM: white matter; STR: striatum; HIP: hippocampus; TH: thalamus; HTH: hypothalamus; MID: midbrain; SN: substantia nigra; OB(m): olfactory bulb (medial); OB(l): olfactory bulb (lateral); CERE: cerebellum; BS: brainstem.
Figure 4.
Figure 4.
Regional preference of the glymphatic flow. (a-b) Representative images of reconstructed sagittal brain slices (lateral 0.60 mm) showing the distribution of Dex-3 (blue) in the brain 30 min (a) and 120 min (b) after CM infusion. (c–d) Representative images of reconstructed horizontal brain slices exhibiting the distribution of Dex-3 (blue) in the brain 30 min (interaural 4.56, 3.44, 0.44 mm from left to right) (c) and 120 min (interaural 4.40, 3.44, 0.44 mm from left to right) (d) after CM infusion. (e–f) The content of Dex-3 in 10 defined brain regions assessed using the microplate assay 30 min (e) and 120 min (f) after CM infusion. N = 5 for all regions, **P < 0.01, ***P < 0.001 vs DC. DC, dorsal cortex. LC: lateral cortex; VC: ventral cortex; OB: olfactory bulb; STR: striatum; SN: substantia nigra; SCR: subcortical region; HIP: hippocampus; CERE: cerebellum; BS: brainstem.
Figure 5.
Figure 5.
A 3D visualization of the glymphatic vessels in the whole mouse brain. Representative images of lateral view (a, b) and coronal view (c, d) demonstrating the brain-wide 3D reconstruction of Dex-3 (blue) distribution in the PVSs 30 min (a, c) and 120 min (b, d) after CM infusion. The major arteries for the glymphatic influx and veins for the glymphatic efflux are marked in each panel. Dpaq: dorsal periaqueductal arteries; Trhi: transverse hippocampal arteries; Thp: thalamo-perforating arteries; Acer: anterior cerebral artery; Costr: corticostriate artery; Astr: anterior striate artery; Pstr: posterior striate artery; Ach: anterior choroidal artery; Gcv: great cerebral vein of Galen; Azicv: azygos internal cerebral vein; Achv: anterior choroidal vein; Thsv: thalamostriate veins; Cb: cerebellar lobule; Cf: cerebellar fissures.
Figure 6.
Figure 6.
Detailed demonstration of the glymphatic influx vessels. Representative images of coronal sections demonstrating Dex-3 (blue) distribution on the PVSs (the inner wall of blood vessels stained by lectin, purple). (a) The coronal section at bregma −0.22 mm. The three regions inside the rectangles are the positions of (b), (c), and (d). (e) The coronal section at bregma −1.58 mm. The two regions inside the rectangles are the positions of (f) and (h). (g) Evaluation of the fluorescence intensity in linear ROS extending outward from penetrating blood vessels showed in panel (f). Lines of different colors representing different depths. (i) Representative images of a cross-section of blood vessels demonstrating Dex-3 surrounding the outside of blood vessels. (j) Immunostaining on vibratome sections confirming Dex-3 accumulating around the arteries (positive for α-SMA staining, brown) and (k) A 3 D reconstruction of Mcer branches, in which the branch levels are marked. ↑ Blood vessels surrounded by tracers, ▲ Blood vessels without tracer signal, # Cellular uptake of tracers.
Figure 7.
Figure 7.
Detailed demonstration of the glymphatic efflux vessels. Representative images demonstrating Dex-3 (blue) distribution on the PVSs (the inner wall of blood vessels stained by lectin, purple). (a) The coronal section at bregma 2.68 mm. The two regions inside the rectangles are the positions of (b) and (c). (d) The coronal section at bregma −0.82 mm. The two regions inside the rectangles are the positions of (e) and (f). (g) The coronal section at bregma −4.47 mm. The two regions inside the rectangles are the positions of (h) and (i). (j) Immunostaining on vibratome sections exhibiting Dex-3 accumulation around veins (negative for α-SMA staining, brown). Rrhv: rostral rhinal vein; Crhv: caudal rhinal vein; Achv: anterior choroidal vein. ↑ Blood vessels surrounded by tracers: # Cellular uptake of tracers.

Similar articles

Cited by

References

    1. Jessen NA, Munk ASF, Lundgaard I, et al.. The glymphatic system: a beginner's guide. Neurochem Res 2015; 40: 2583–2599. - PMC - PubMed
    1. Iliff JJ, Wang MH, Liao YH, et al.. A paravascular pathway facilitates CSF flow through the brain parenchyma and the clearance of interstitial solutes, including amyloid beta. Sci Transl Med 2012; 4: 147ra111. - PMC - PubMed
    1. Rasmussen MK, Mestre H, Nedergaard M. The glymphatic pathway in neurological disorders. Lancet Neurol 2018; 17: 1016–1024. - PMC - PubMed
    1. Mestre H, Mori Y, Nedergaard M. The brain's glymphatic system: current controversies. Trends Neurosci 2020; 43: 458–466. - PMC - PubMed
    1. Iliff JJ, Lee H, Yu M, et al.. Brain-wide pathway for waste clearance captured by contrast-enhanced MRI. J Clin Invest 2013; 123: 1299–1309. - PMC - PubMed

Publication types

LinkOut - more resources