

Sepsis subphenotyping based on organ dysfunction trajectory
- PMID: 35786445
- PMCID: PMC9250715
- DOI: 10.1186/s13054-022-04071-4
Sepsis subphenotyping based on organ dysfunction trajectory
Abstract
Background: Sepsis is a heterogeneous syndrome, and the identification of clinical subphenotypes is essential. Although organ dysfunction is a defining element of sepsis, subphenotypes of differential trajectory are not well studied. We sought to identify distinct Sequential Organ Failure Assessment (SOFA) score trajectory-based subphenotypes in sepsis.
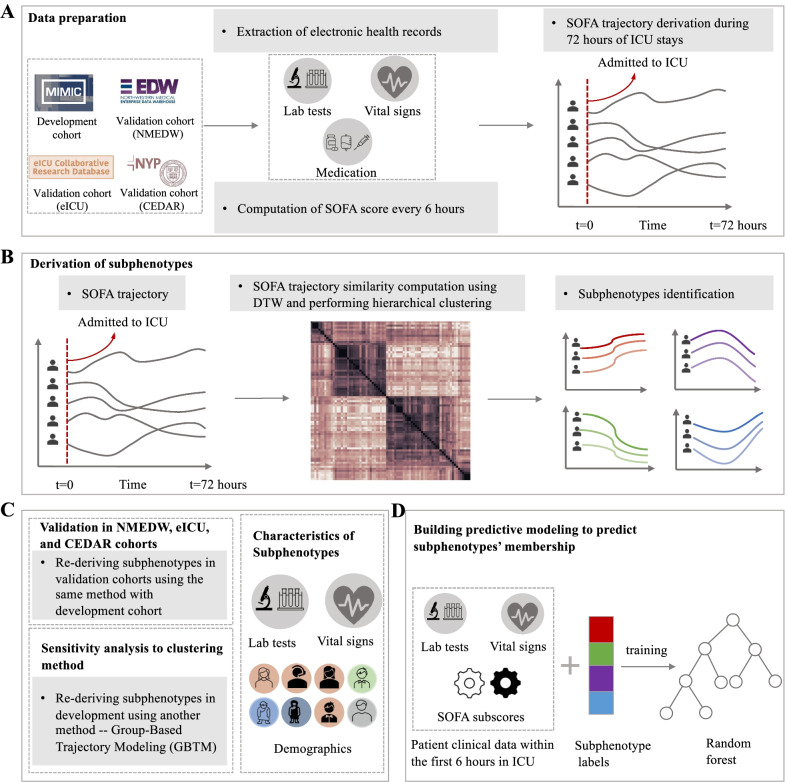
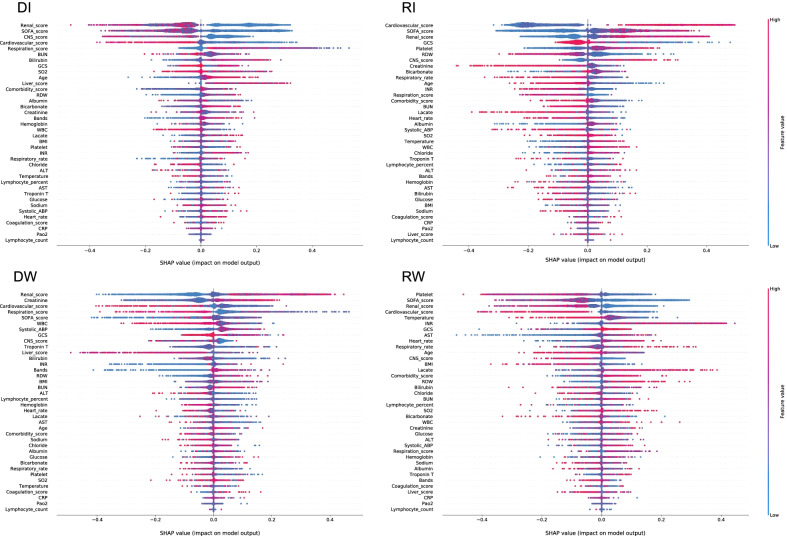
Methods: We created 72-h SOFA score trajectories in patients with sepsis from four diverse intensive care unit (ICU) cohorts. We then used dynamic time warping (DTW) to compute heterogeneous SOFA trajectory similarities and hierarchical agglomerative clustering (HAC) to identify trajectory-based subphenotypes. Patient characteristics were compared between subphenotypes and a random forest model was developed to predict subphenotype membership at 6 and 24 h after being admitted to the ICU. The model was tested on three validation cohorts. Sensitivity analyses were performed with alternative clustering methodologies.
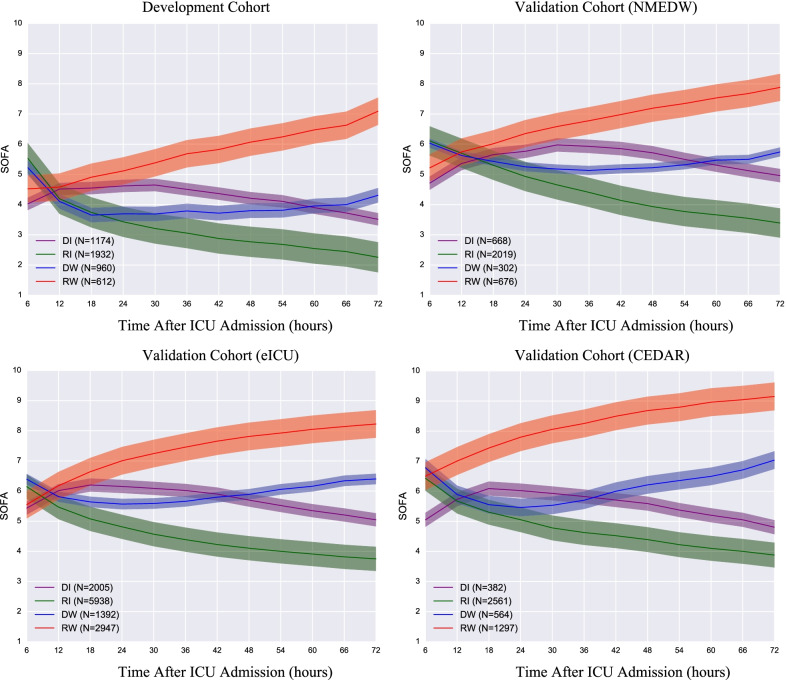
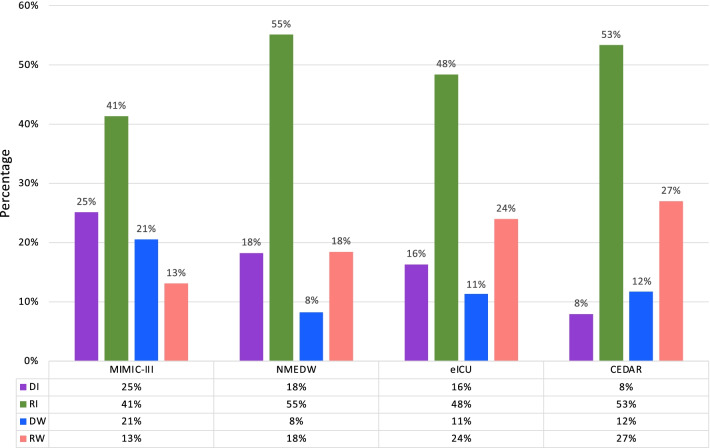
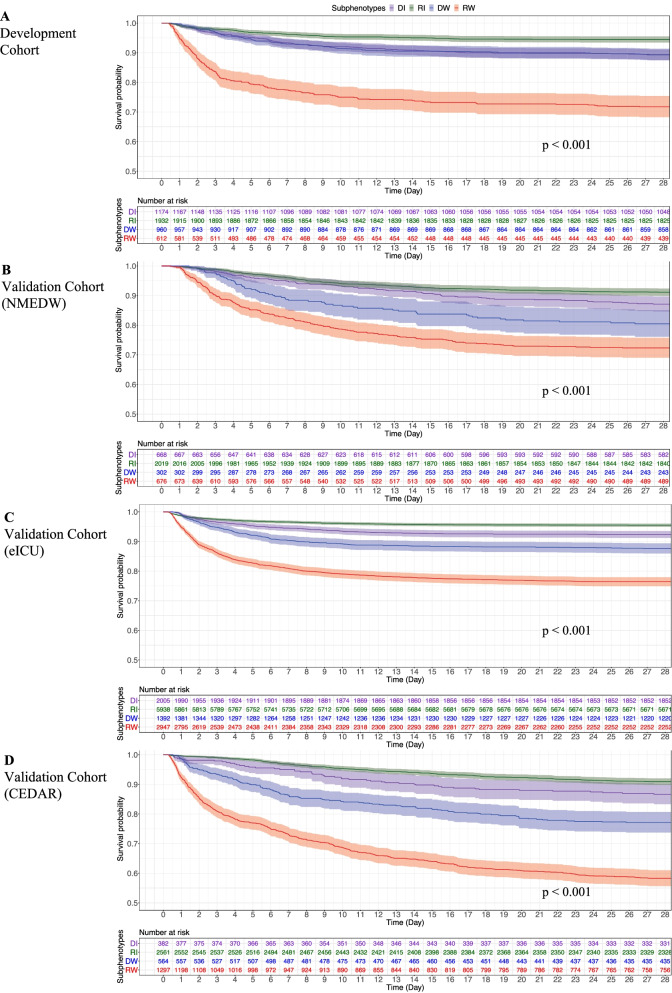
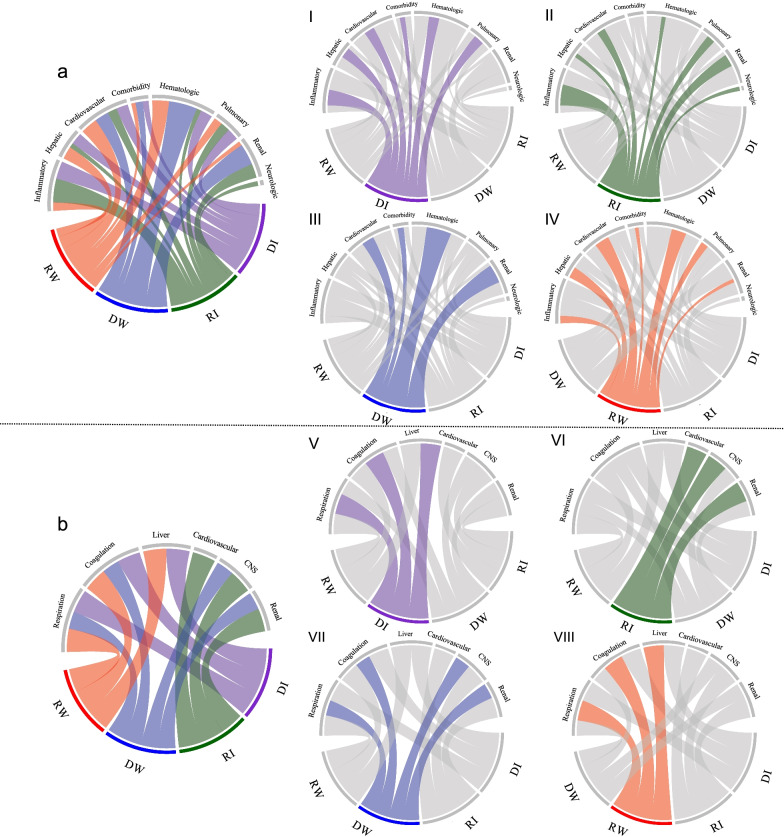
Results: A total of 4678, 3665, 12,282, and 4804 unique sepsis patients were included in development and three validation cohorts, respectively. Four subphenotypes were identified in the development cohort: Rapidly Worsening (n = 612, 13.1%), Delayed Worsening (n = 960, 20.5%), Rapidly Improving (n = 1932, 41.3%), and Delayed Improving (n = 1174, 25.1%). Baseline characteristics, including the pattern of organ dysfunction, varied between subphenotypes. Rapidly Worsening was defined by a higher comorbidity burden, acidosis, and visceral organ dysfunction. Rapidly Improving was defined by vasopressor use without acidosis. Outcomes differed across the subphenotypes, Rapidly Worsening had the highest in-hospital mortality (28.3%, P-value < 0.001), despite a lower SOFA (mean: 4.5) at ICU admission compared to Rapidly Improving (mortality:5.5%, mean SOFA: 5.5). An overall prediction accuracy of 0.78 (95% CI, [0.77, 0.8]) was obtained at 6 h after ICU admission, which increased to 0.87 (95% CI, [0.86, 0.88]) at 24 h. Similar subphenotypes were replicated in three validation cohorts. The majority of patients with sepsis have an improving phenotype with a lower mortality risk; however, they make up over 20% of all deaths due to their larger numbers.
Conclusions: Four novel, clinically-defined, trajectory-based sepsis subphenotypes were identified and validated. Identifying trajectory-based subphenotypes has immediate implications for the powering and predictive enrichment of clinical trials. Understanding the pathophysiology of these differential trajectories may reveal unanticipated therapeutic targets and identify more precise populations and endpoints for clinical trials.
Keywords: Dynamic time warping; Precision medicine; Sepsis; Sequential Organ Failure Assessment (SOFA) score; Subphenotype.
© 2022. The Author(s).
Conflict of interest statement
ES received the consulting fees in terms of Axle Informatics (NIAID COVID19 Vaccine Subject Matter Expert Program) and payment in terms of Department of Defense (Peer Reviewed Medical Research Program). All other authors declare no competing interests.
Figures
Similar articles
-
Identifying organ dysfunction trajectory-based subphenotypes in critically ill patients with COVID-19.Sci Rep. 2021 Aug 5;11(1):15872. doi: 10.1038/s41598-021-95431-7. Sci Rep. 2021. PMID: 34354174 Free PMC article.
-
Inflammatory subphenotypes previously identified in ARDS are associated with mortality at intensive care unit discharge: a secondary analysis of a prospective observational study.Crit Care. 2024 May 7;28(1):151. doi: 10.1186/s13054-024-04929-9. Crit Care. 2024. PMID: 38715131 Free PMC article.
-
Comparison of time series clustering methods for identifying novel subphenotypes of patients with infection.J Am Med Inform Assoc. 2023 May 19;30(6):1158-1166. doi: 10.1093/jamia/ocad063. J Am Med Inform Assoc. 2023. PMID: 37043759 Free PMC article.
-
Using Predictive Models to Improve Care for Patients Hospitalized with COVID-19 [Internet].Washington (DC): Patient-Centered Outcomes Research Institute (PCORI); 2023 Jan. Washington (DC): Patient-Centered Outcomes Research Institute (PCORI); 2023 Jan. PMID: 38976624 Free Books & Documents. Review.
-
Sepsis subphenotypes, theragnostics and personalized sepsis care.Intensive Care Med. 2025 Apr;51(4):756-768. doi: 10.1007/s00134-025-07873-6. Epub 2025 Mar 31. Intensive Care Med. 2025. PMID: 40163135 Free PMC article. Review.
Cited by
-
Interpreting biologically informed neural networks for enhanced proteomic biomarker discovery and pathway analysis.Nat Commun. 2023 Sep 2;14(1):5359. doi: 10.1038/s41467-023-41146-4. Nat Commun. 2023. PMID: 37660105 Free PMC article.
-
Identification and validation of sepsis subphenotypes using time-series data.Heliyon. 2024 Mar 25;10(7):e28520. doi: 10.1016/j.heliyon.2024.e28520. eCollection 2024 Apr 15. Heliyon. 2024. PMID: 38689952 Free PMC article.
-
Monotherapy or Combination Therapy for Septic Shock? A Debate on Steroids.Am J Respir Crit Care Med. 2024 May 15;209(10):1179-1180. doi: 10.1164/rccm.202401-0175ED. Am J Respir Crit Care Med. 2024. PMID: 38354067 Free PMC article. No abstract available.
-
Sepsis subphenotypes: bridging the gaps in sepsis treatment strategies.Front Immunol. 2025 Feb 6;16:1546474. doi: 10.3389/fimmu.2025.1546474. eCollection 2025. Front Immunol. 2025. PMID: 40013154 Free PMC article. Review.
-
Identification of two robust subclasses of sepsis with both prognostic and therapeutic values based on machine learning analysis.Front Immunol. 2022 Nov 25;13:1040286. doi: 10.3389/fimmu.2022.1040286. eCollection 2022. Front Immunol. 2022. PMID: 36505503 Free PMC article.
References
MeSH terms
Grants and funding
LinkOut - more resources
Full Text Sources
Medical
