. 2022 Sep 1;163(9):bqac098.
doi: 10.1210/endocr/bqac098.

Regulatory T Cell Proportion and Phenotype Are Altered in Women Using Oral Contraception

Affiliations

Regulatory T Cell Proportion and Phenotype Are Altered in Women Using Oral Contraception

Lachlan M Moldenhauer et al. Endocrinology. .

Abstract

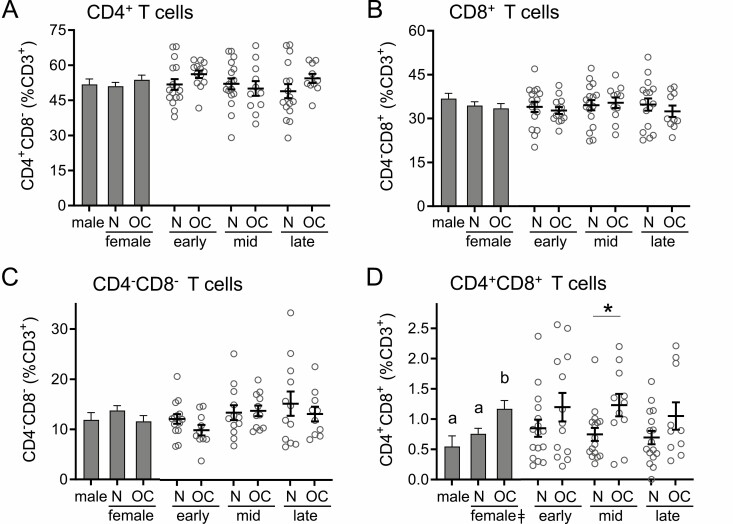
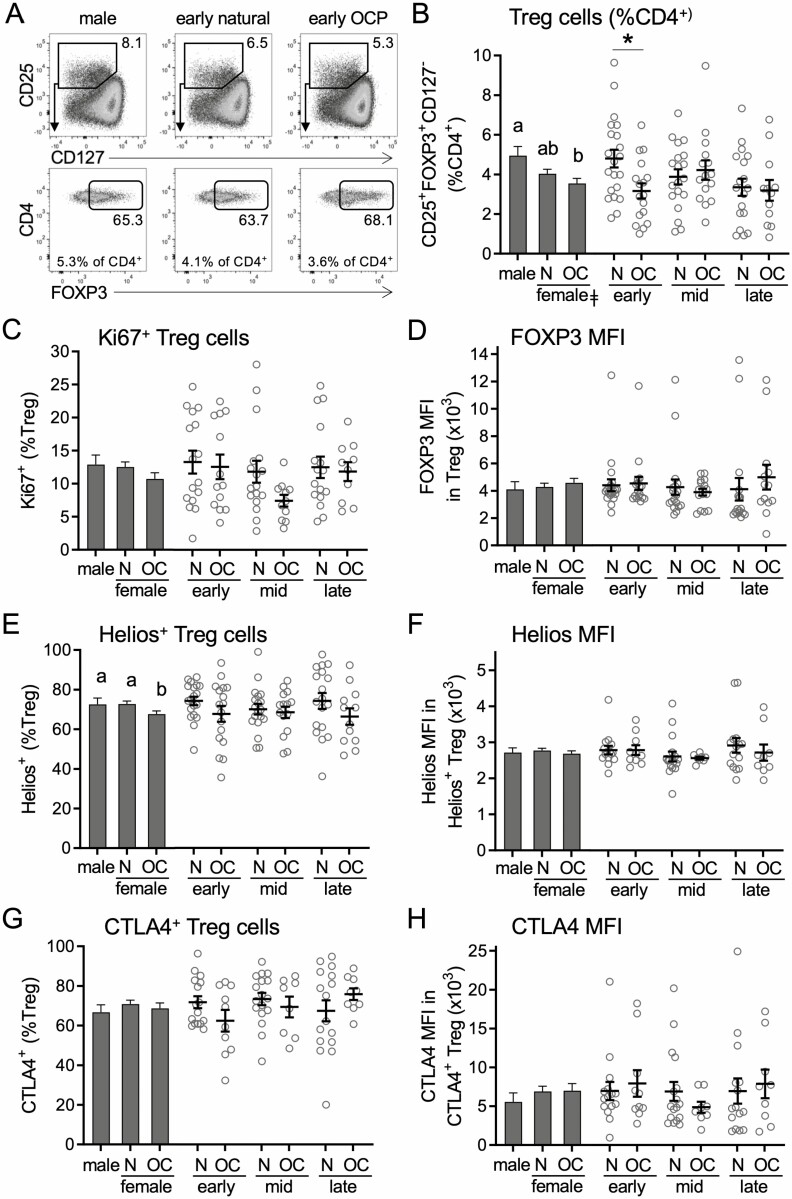
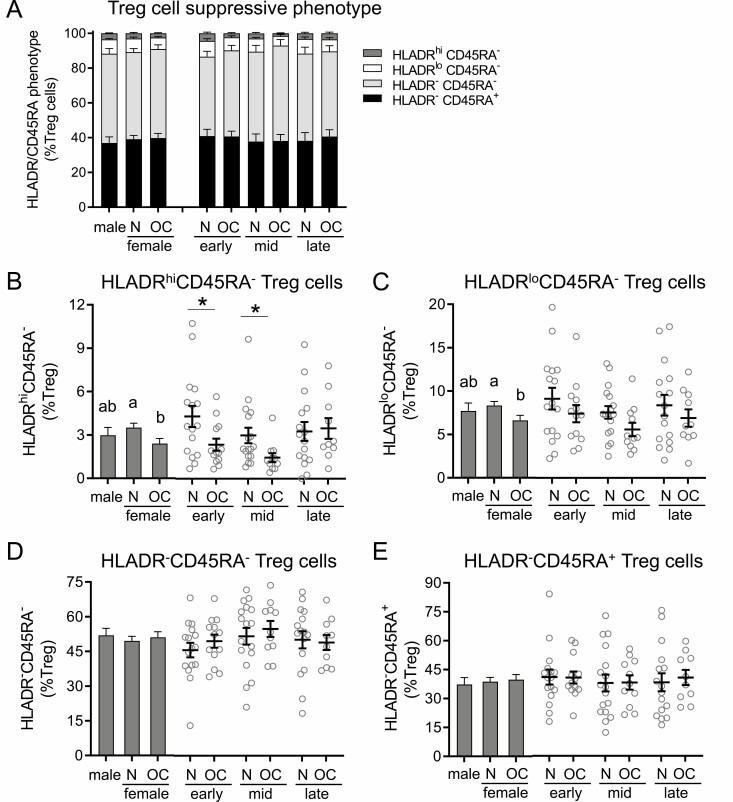
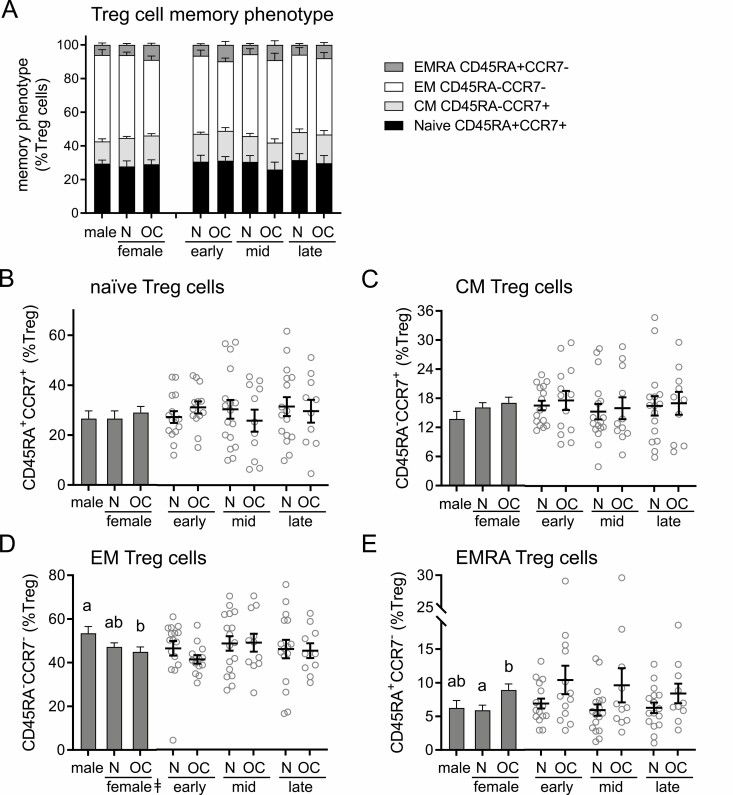
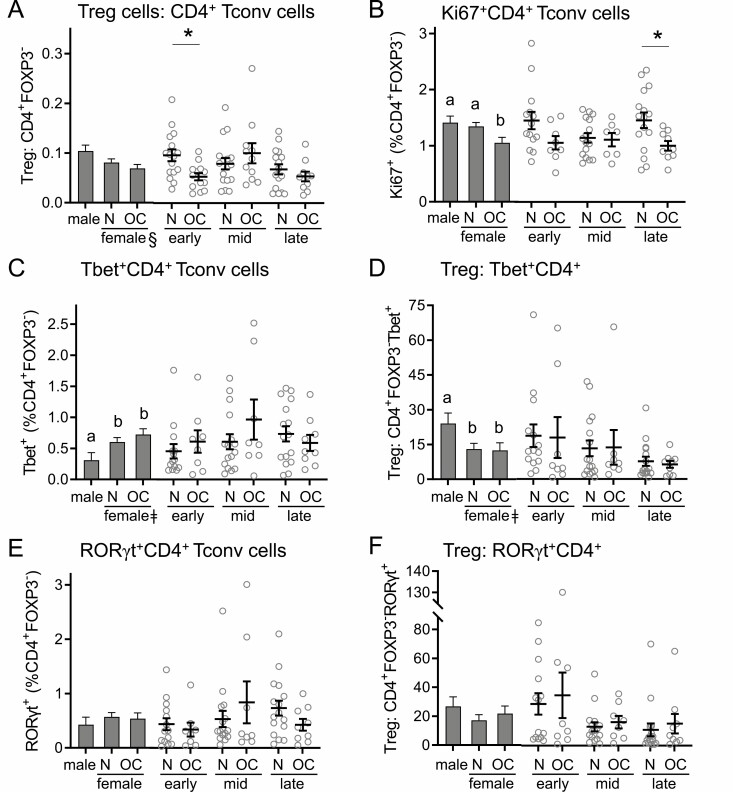
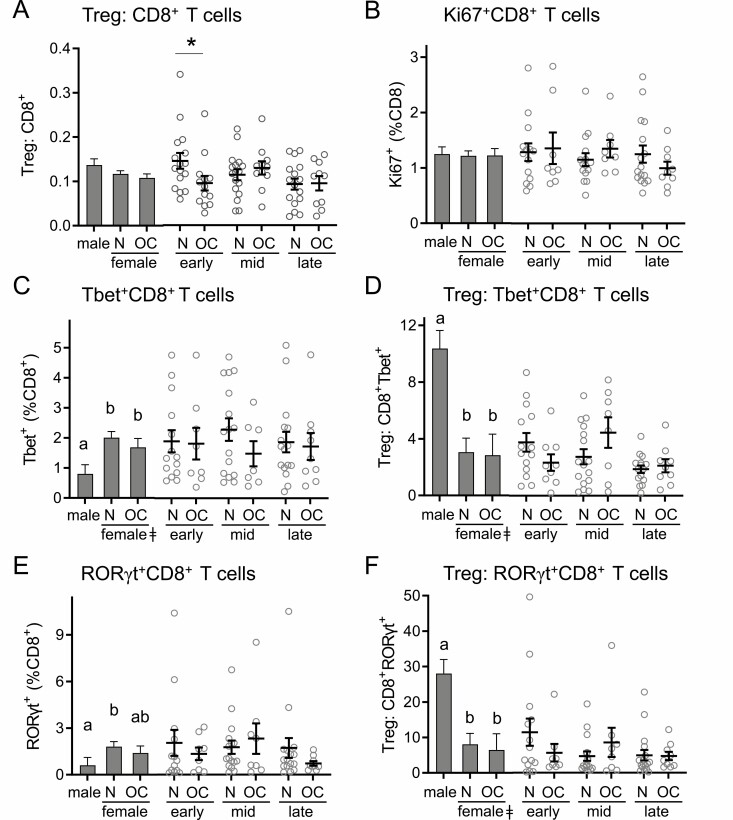
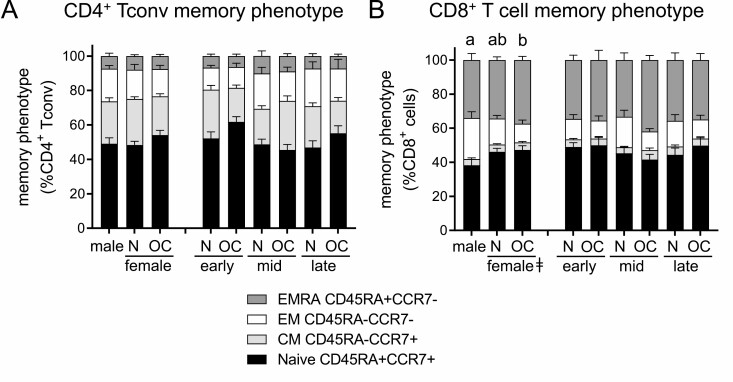
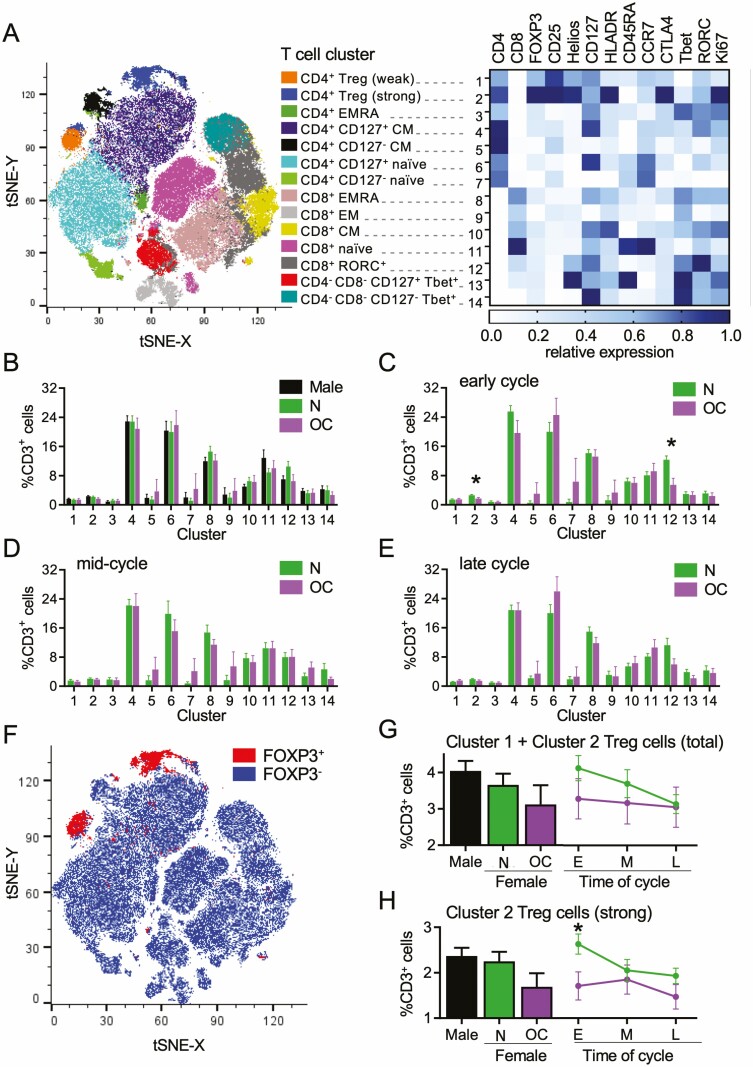
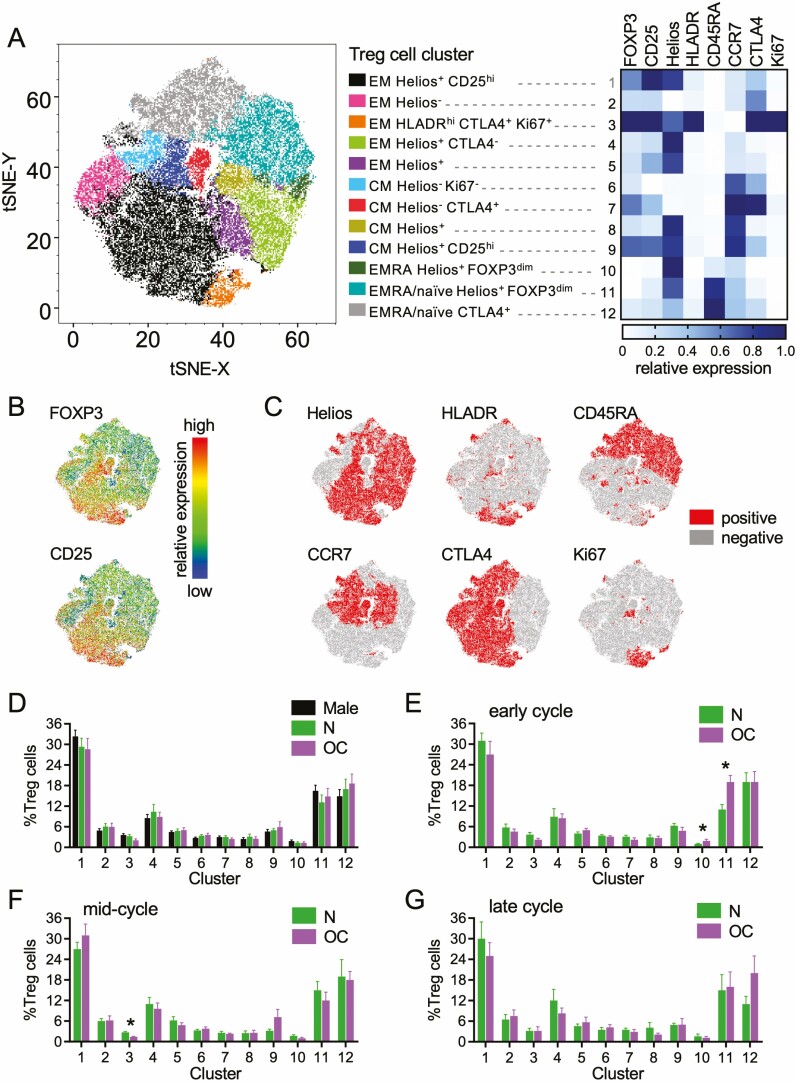
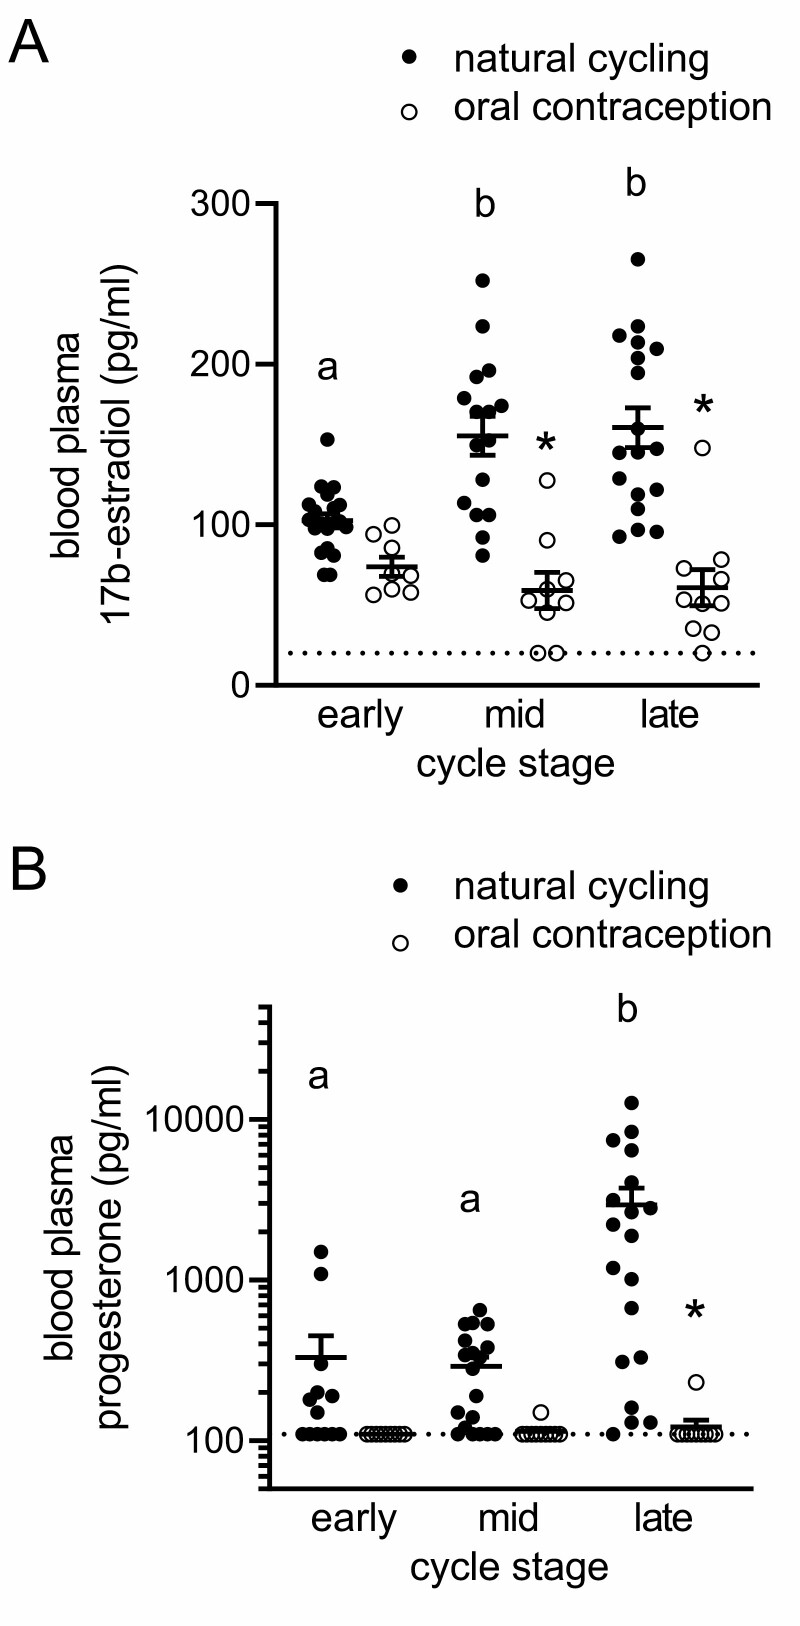
Regulatory T (Treg) cells are a specialized CD4+ T cell subpopulation that are essential for immune homeostasis, immune tolerance, and protection against autoimmunity. There is evidence that sex-steroid hormones estrogen and progesterone modulate Treg cell abundance and phenotype in women. Since natural oscillations in these hormones are modified by hormonal contraceptives, we examined whether oral contraception (OC) use impacts Treg cells and related T cell populations. T cells were analyzed by multiparameter flow cytometry in peripheral blood collected across the menstrual cycle from healthy women either using OC or without hormonal contraception and from age-matched men. Compared to naturally cycling women, women using OC had fewer Treg cells and an altered Treg cell phenotype. Notably, Treg cells exhibiting a strongly suppressive phenotype, defined by high FOXP3, CD25, Helios, HLADR, CTLA4, and Ki67, comprised a lower proportion of total Treg cells, particularly in the early- and mid-cycle phases. The changes were moderate compared to more substantial differences in Treg cells between women and men, wherein women had fewer Treg cells-especially of the effector memory Treg cell subset-associated with more T helper type 1 (Th1) cells and CD8+ T cells and lower Treg:Th1 cell and Treg:CD8+ T cell ratios than men. These findings imply that OC can modulate the number and phenotype of peripheral blood Treg cells and raise the possibility that Treg cells contribute to the physiological changes and altered disease susceptibility linked with OC use.

Keywords: T cells; autoimmunity; regulatory T cells; sex hormones; tolerance.


Figures

Figure 1.
Figure 1.
Oral contraception increases CD4+CD8+ T cells but does not alter CD4+, CD8+, or CD4CD8 T cells in peripheral blood. The proportions of CD3+ T cells classified as CD4+CD8 (A), CD8+CD4 (B), CD4CD8 (C), and CD4+CD8+ (D) were assessed by flow cytometry in peripheral blood drawn at early-, mid-, and late-cycle phases from naturally cycling women (N), women using oral contraception (OC), and men. Data are shown as estimated marginal means (left side, bar graphs) calculated by linear mixed model analysis (Model 1, all participants) with cycle phase as a covariate for women. Individual data points are also shown for each woman at each cycle phase in the N and OC groups (right side), with mean ± SE of the mean indicated. The effects of participant group, female sex, OC use, and cycle phase were assessed by linear mixed model analysis and pairwise comparisons (n = 10-17 participants/group). a,b,cDifferent superscripts indicate differences between participant group (Model 1). ǂSignificant effect of sex (Model 1). *Significant effect of OC at specific cycle phases (Model 2). All Ps < 0.05.
Figure 2.
Figure 2.
Oral contraception alters the number of and Helios expression in CD4+ Treg cells in peripheral blood. Peripheral blood drawn at early-, mid-, and late-cycle phases from naturally cycling women (N), women using oral contraception (OC), and men was analyzed by flow cytometry to analyze CD3+CD4+CD25+FOXP3+CD127−/lo Treg cells (A). Panels show the number of Treg cells (B), the number of Ki67+ Treg cells (C), the mean fluorescence intensity of FOXP3 in Treg cells (D), the number of Helios+ Treg cells (E), the mean fluorescence intensity of Helios in Helios+ Treg cells (F), the number of CTLA4+ Treg cells (G), and the mean fluorescence intensity of CTLA4 in CTLA4+ Treg cells (H). Data are shown by group as estimated marginal means (left side, bar graphs) calculated by linear mixed model analysis (Model 1, all participants). Individual data points are also shown for each woman at each cycle phase in the N and OC groups (right side), with mean ± SE of the mean indicated. The effects of participant group, female sex, OC use, and cycle phase were assessed by linear mixed model analysis and pairwise comparison (n = 10-17 participants/group). a,b,cDifferent superscripts indicate differences between participant group (Model 1). ǂSignificant effect of sex (Model 1). ϕSignificant effect of cycle phase (Model 2). *Significant effect of OC at specific cycle phases (Model 2). All Ps < 0.05.
Figure 3.
Figure 3.
Oral contraception alters HLADR/CD45RA suppressive marker expression in CD4+ Treg cells in peripheral blood. Peripheral blood drawn at early-, mid-, and late-cycle phases from naturally cycling women (N), women using oral contraception (OC), and men was analyzed by flow cytometry to assess HLADR and CD45RA expression in CD3+CD4+CD25+FOXP3+CD127−/lo Treg cells. Panels show the relative proportion of HLADRhiCD45RA, HLADRloCD45RA, HLADRCD45RA, and HLADRCD45RA+ cells among Treg cells (A), the number of HLADRhiCD45RA cells (B), the number of HLADRloCD45RA Treg cells (C), the number of HLADRCD45RA Treg cells (D), and the number of HLADRCD45RA+ Treg cells (E). Data are shown by group as estimated marginal means (A and left side, bar graphs B-D) calculated by linear mixed model analysis (Model 1, all participants). Individual data points are also shown for each woman at each cycle phase in the N and OC groups (right side, bar graphs B-D), with mean ± SE of the mean indicated. In (A), the effects of group were analyzed by Chi-square analysis. In (B) to (D), the effects of participant group, female sex, OC use, and cycle phase were assessed by linear mixed model analysis and pairwise comparisons (n = 10-17 participants/group). a,b,cDifferent superscripts indicate differences between participant group (Model 1). ǂSignificant effect of sex (Model 1). ϕSignificant effect of cycle phase (Model 2). *Significant effect of OC at specific cycle phases (Model 2). All Ps < 0.05.
Figure 4.
Figure 4.
Oral contraception alters CD45RA/CCR7 memory phenotype marker expression in CD4+ Treg cells. Peripheral blood drawn at early-, mid-, and late-cycle stages from naturally cycling women (N), women using oral contraception (OC), and men was analyzed by flow cytometry to assess CD45RA and CCR7 expression in CD3+CD4+CD25+FOXP3+CD127−/lo Treg cells, allowing classification of cells into naïve (CD45RA+CCR7+), central memory (CM; CD45RACCR7+), effector memory (EM; CD45RA-CCR7), or terminally differentiated effector memory (EMRA; CD45RA+CCR7) subsets. Panels show the relative proportion of naïve, CM, EM, and EMRA cells among Treg cells (A), the number of naïve cells (B), the number of CM Treg cells (C), the number of EM Treg cells (D), and the number of EMRA Treg cells (E). Data are shown by group as estimated marginal means (A, and left side, bar graphs B-D) calculated by linear mixed model analysis (Model 1, all participants). Individual data points are also shown for each woman at each cycle phase in the N and OC groups (right side, bar graphs B-D), with mean ± SE of the mean indicated. In (A), the effects of participant group were analyzed by Chi-square analysis. In (B) to (D), the effects of participant group, female sex, OC use, and time of cycle were assessed by linear mixed model analysis and pairwise comparisons (n = 10-17 participants/group). a,b,cDifferent superscripts indicate differences between participant group (Model 1). ǂSignificant effect of sex (Model 1). ϕSignificant effect of cycle stage (Model 2). *Significant effect of OC at specific cycle stages (Model 2). All Ps < 0.05.
Figure 5.
Figure 5.
Oral contraception alters Ki67 expression but not other activation phenotype markers in CD4+ Tconv cells. Peripheral blood drawn at early-, mid-, and late-cycle phases from naturally cycling women (N), women using oral contraception (OC), and men was analyzed by flow cytometry to analyze CD3+CD4+FOXP3 Tconv cells. Panels show the number of Tconv cells (A), the number of Ki67+Tconv cells (B), the number of Tbet+ Tconv cells (C), the ratio of Treg cells to Tbet+ Tconv cells (D), the number of RORγt+ Tconv cells (E), and the ratio of Treg cells to RORγt+ Tconv cells (F). Data are shown by group as estimated marginal means (left side, bar graphs) calculated by linear mixed model analysis (Model 1, all participants). Individual data points are also shown for each woman at each cycle phase in the N and OC groups (right side), with mean ± SE of the mean indicated. The effects of participant group, female sex, OC use, and cycle phase were assessed by linear mixed model analysis and pairwise comparisons (n = 10-17 participants/group). a,b,cDifferent superscripts indicate differences between participant group (Model 1). ǂSignificant effect of sex (Model 1). ϕSignificant effect of cycle phase (Model 2). *Significant effect of OC at specific cycle phases (Model 2). All Ps < 0.05.
Figure 6.
Figure 6.
Oral contraception does not alter CD8+ T cell number or phenotype markers. Peripheral blood drawn at early-, mid-, and late-cycle phases from naturally cycling women (N), women using oral contraception (OC), and men was analyzed by flow cytometry to analyze CD3+CD8+ T cells. Panels show the number of CD8+ T cells (A), the number of Ki67+CD8+ T cells (B), the number of Tbet+CD8+ T cells (C), the ratio of Treg cells to Tbet+CD8+ T cells (D), the number of RORγt+CD8+ T cells (E), and the ratio of Treg cells to RORγt+CD8+ T cells (F). Data are shown by group as estimated marginal means (left side, bar graphs) calculated by linear mixed model analysis (Model 1, all participants). Individual data points are also shown for each woman at each cycle phase in the N and OC groups (right side), with mean ± SE of the mean indicated. The effects of participant group, female sex, OC use, and cycle phase were assessed by linear mixed model analysis and pairwise comparisons (n = 10-17 participants/group). a,b,cDifferent superscripts indicate differences between participant group (Model 1). ǂSignificant effect of sex (Model 1). ϕSignificant effect of cycle phase (Model 2). `Significant effect of OC × cycle interaction (Model 2). *Significant effect of OC at specific cycle phases (Model 2). All Ps < 0.05.
Figure 7.
Figure 7.
Oral contraception has minor effects on CD45RA/CCR7 memory phenotype marker expression in CD4+ Tconv cells and CD8+ T cells. Peripheral blood drawn at early-, mid-, and late-cycle stages from naturally cycling women (N), women using oral contraception (OC), and men was analyzed by flow cytometry to assess CD45RA and CCR7 expression in CD4+FOXP3 Tconv cells and CD8+ T cells, allowing classification of cells into naïve (CD45RA+CCR7+), central memory (CM, CD45RACCR7+), effector memory (EM; CD45RA-CCR7), or terminally differentiated effector memory (EMRA; CD45RA+CCR7) subsets. Panels show the relative proportion of naïve, CM, EM, and EMRA cells among Tconv cells (A) and CD8+ T cells (B). Data are shown by group as estimated marginal means calculated by linear mixed model analysis (Model 1, all participants). The effects of participant group were analyzed by Chi-square analysis. Additional data showing individual subsets are provided in Supplemental Figures 2 and 3 (44). a,b,cDifferent superscripts indicate differences between participant group (Model 1; P < 0.05).
Figure 8.
Figure 8.
Dimensionality-reducing t-distributed stochastic neighbor embedding (tSNE)algorithm shows effects of oral contraception on peripheral blood CD3+ T cells. Peripheral blood drawn at early-, mid-, and late-cycle phases from naturally cycling women (N), women using oral contraception (OC), and men. Data for flow cytometry phenotyping of CD3+ T cells were concatenated into a single file and transformed by the tSNE algorithm. X-shift identified 14 unique cell clusters, and the relative expression intensity of each marker within each cluster was calculated using FlowJo software (A). The proportion that each cluster contributes to total CD3+ cells was calculated using linear mixed model analysis, and estimated marginal means were generated for men, N, and OC groups (B). The mean ± SE of the mean cluster proportions for N and OC groups are shown at the early- (C), mid- (D), and late-cycle (E) phases. FOXP3+ Treg cells within the concatenated file were manually gated to view their distribution (F). Two Treg cell populations were identified, Cluster 1 and Cluster 2, with phenotypes typical of “mild” and “strong” suppressive capability, respectively. Total Treg cells (Cluster 1 + Cluster 2) (G) and strong Treg cells (Cluster 2) (H) are shown as estimated marginal means for men and the N and OC groups (bar graphs) and line graphs of mean ± SE of the mean for N and OC groups in early- (E), mid- (M) and late-cycle (L) phases. The effects of participant group, OC use, and cycle phase on Treg cell clusters were assessed by 1-way analysis of variance and post hoc Tukey t-test (n = 8-17 participants/group; *P < 0.05).
Figure 9.
Figure 9.
Plasma 17β-estradiol (A) and progesterone (B) levels in naturally cycling women and women taking oral contraception. Peripheral blood was drawn at early-, mid-, and late-cycle stages from naturally cycling women (N), women using oral contraception (OC), and men. Data for flow cytometry phenotyping of CD3+CD4+FOXP3+CD25+CD127 Treg cells was concatenated into a single file and transformed by the t-distributed stochastic neighbor embedding (tSNE) algorithm. X-shift identified 12 unique cell clusters and the relative expression intensity of each marker within each cluster was calculated using FlowJo software and is shown on a heat map (A). Heat map tSNE plots show the relative expression of FOXP3 and CD25 within the Treg cells (B) and the Treg cells positive for Helios, HLADR, CD45RA, CCR7, CTLA4, and Ki67 within the tSNE plot are shown (C). The proportion that each cluster contributes to total Treg cells was calculated, and estimated marginal means were generated for men and the N, and OC groups (D). The mean ± SE of the mean proportion of each cluster for N and OC groups at the early- (E), mid- (F), and late-cycle (G) stages were calculated. The effects of participant group, OC use, and cycle phase on Treg cell clusters were assessed by 1-way analysis of variance (ANOVA; n = 8-15 participants/group). The effects of participant group, OC use, and cycle phase on Treg cell clusters were assessed by 1-way ANOVA and post hoc Tukey t-test (n = 8-15 participants/group; *P < 0.05).
Figure 10.
Figure 10.
Plasma 17β-estradiol (A) and progesterone (B) levels in naturally cycling women and women taking OC. Plasma from venous blood samples taken at early-, mid-, and late-cycle phases from naturally cycling women (closed circles) or women using oral contraception (open circles) was analyzed for 17β-estradiol (A) and progesterone (B) content. Data were analyzed by 1-way analysis of variance with post hoc Sidak’s multiple comparisons test. a,b,cDifferent superscripts indicate difference between cycle phases within a participant group. *Significant effect of OC at specific cycle phase.

Similar articles

Cited by

References

    1. Wira CR, Rodriguez-Garcia M, Patel MV. The role of sex hormones in immune protection of the female reproductive tract. Nat Rev Immunol. 2015;15:217-230. Doi: 10.1038/nri3819 - DOI - PMC - PubMed
    1. Klein SL, Flanagan KL. Sex differences in immune responses. Nat Rev Immunol. 2016;16:626-638. Doi: 10.1038/nri.2016.90 - DOI - PubMed
    1. Hewagama A, Patel D, Yarlagadda S, Strickland FM, Richardson BC. Stronger inflammatory/cytotoxic T-cell response in women identified by microarray analysis. Genes Immun. 2009;10:509-516. Doi: 10.1038/gene.2009.12 - DOI - PMC - PubMed
    1. Arruvito L, Sanz M, Banham AH, Fainboim L. Expansion of CD4+CD25+and FOXP3+ regulatory T cells during the follicular phase of the menstrual cycle: implications for human reproduction. J Immunol. 2007;178:2572-2578. Doi: 10.4049/jimmunol.178.4.2572 - DOI - PubMed
    1. Nowak J, Borkowska B, Pawlowski B. Leukocyte changes across menstruation, ovulation, and mid-luteal phase and association with sex hormone variation. Am J Hum Biol. 2016;28:721-728. Doi: 10.1002/ajhb.22856 - DOI - PubMed

Publication types