. 2022 Nov 28;31(23):3987-4005.
doi: 10.1093/hmg/ddac083.

Pathological characterization of a novel mouse model expressing the PD-linked CHCHD2-T61I mutation

Affiliations

Pathological characterization of a novel mouse model expressing the PD-linked CHCHD2-T61I mutation

Teresa R Kee et al. Hum Mol Genet. .

Abstract

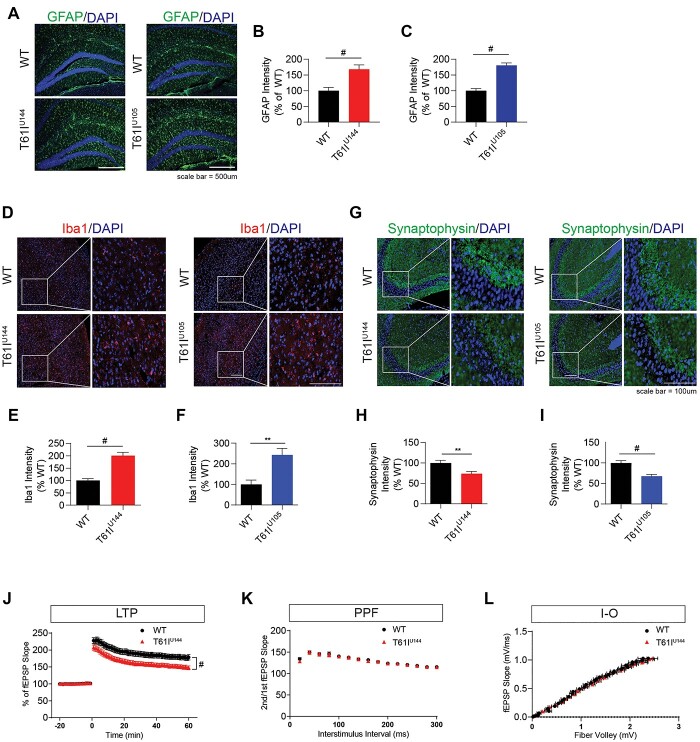
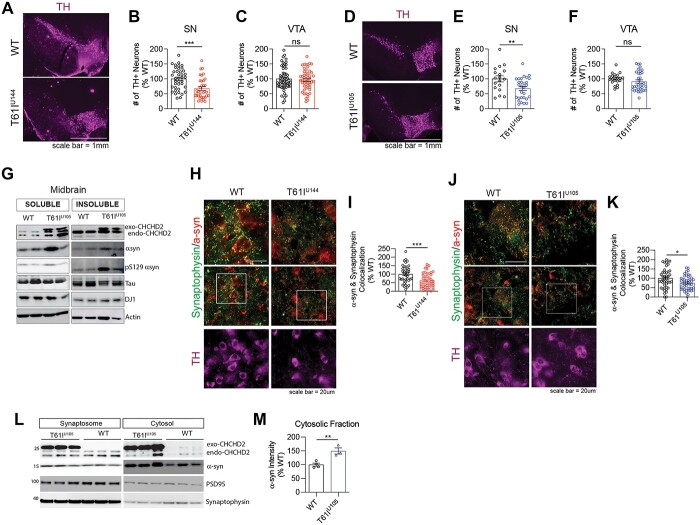
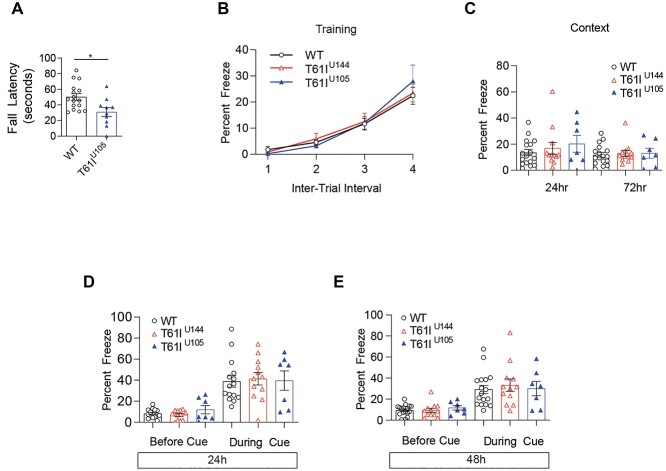
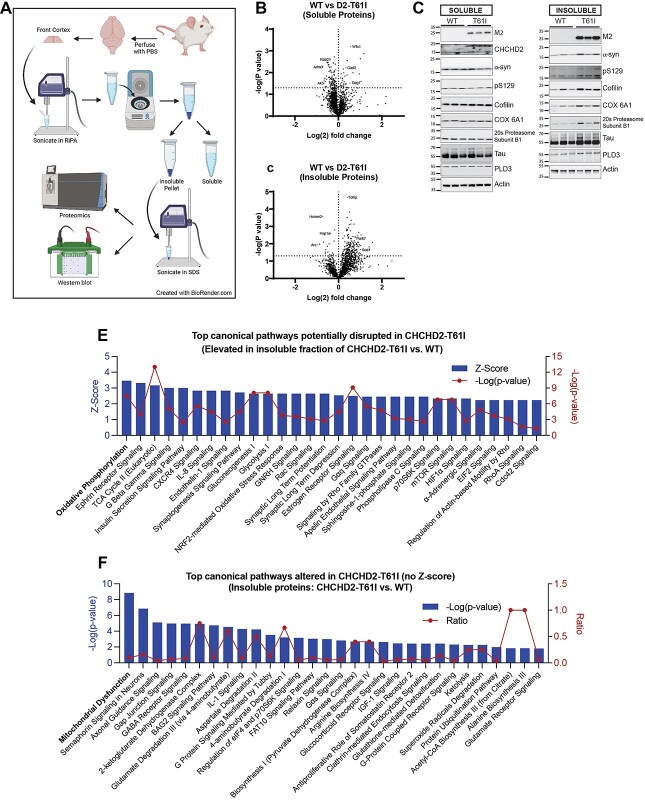
Coiled-coil-helix-coiled-coil-helix domain containing 2 (CHCHD2) is a mitochondrial protein that plays important roles in cristae structure, oxidative phosphorylation and apoptosis. Multiple mutations in CHCHD2 have been associated with Lewy body disorders (LBDs), such as Parkinson's disease (PD) and dementia with Lewy bodies, with the CHCHD2-T61I mutation being the most widely studied. However, at present, only CHCHD2 knockout or CHCHD2/CHCHD10 double knockout mouse models have been investigated. They do not recapitulate the pathology seen in patients with CHCHD2 mutations. We generated the first transgenic mouse model expressing the human PD-linked CHCHD2-T61I mutation driven by the mPrP promoter. We show that CHCHD2-T61I Tg mice exhibit perinuclear mitochondrial aggregates, neuroinflammation, and have impaired long-term synaptic plasticity associated with synaptic dysfunction. Dopaminergic neurodegeneration, a hallmark of PD, is also observed along with α-synuclein pathology. Significant motor dysfunction is seen with no changes in learning and memory at 1 year of age. A minor proportion of the CHCHD2-T61I Tg mice (~10%) show a severe motor phenotype consistent with human Pisa Syndrome, an atypical PD phenotype. Unbiased proteomics analysis reveals surprising increases in many insoluble proteins predominantly originating from mitochondria and perturbing multiple canonical biological pathways as assessed by ingenuity pathway analysis, including neurodegenerative disease-associated proteins such as tau, cofilin, SOD1 and DJ-1. Overall, CHCHD2-T61I Tg mice exhibit pathological and motor changes associated with LBDs, indicating that this model successfully captures phenotypes seen in human LBD patients with CHCHD2 mutations and demonstrates changes in neurodegenerative disease-associated proteins, which delineates relevant pathological pathways for further investigation.


Figures

Figure 1
Figure 1
Insoluble CHCHD2 is increased and correlates with insoluble α-synuclein levels in the brains of LBD patients. (A) Sarkosyl soluble and insoluble representative immunoblots for CHCHD2, α-synuclein and S129 phospho-α-synuclein from the frontal cortex of control subjects and LBD patients. (B) Quantitative analysis of sarkosyl soluble and (C) insoluble CHCHD2 levels. Error bars represent mean ± SEM; n = 6 control, n = 17 LBD patients; t-test; *P < 0.05. (D) Correlation of insoluble CHCHD2 and α-synuclein levels. n = 6 control, n = 17 LBD patients.
Figure 2
Figure 2
CHCHD2-T61I Tg mice are viable, fertile and lack gross abnormalities of the brain and spinal cord morphology. (A) Schematic representation of the human CHCHD2-T61I-Flag transgene driven by the mouse Prp promoter. (B) Representative images of postnatal (P0) CHCHD2-T61I Tg line U144 and U105 mice and WT littermates. P0 T61I Tg line U144 and U105 mice are phenotypically normal and feed well, as indicated by the presence of the milk spot (Scale bar: 1 cm). (C) Quantitative analysis of birth weights of CHCHD2-T61I Tg line U144 pups and WT littermates. Error bars represent mean ± SEM; n = 14 WT, n = 13 T61I U144; n.s., not significant. (D) Quantitative analysis of birth weights of CHCHD2-T61I Tg line U105 pups and WT littermates. Error bars represent mean ± SEM; n = 5 WT, n = 8 T61I U105; n.s., not significant. Both strains do not differ in birth weight compared with nontransgenic WT littermates. (E) Representative immunoblots for M2, CHCHD2 and loading control actin from whole brains extracted from P0 CHCHD2-T61I Tg mice. Flag-CHCHD2-T61I transgenic expression is detected by M2 and CHCHD2 antibodies. (F) Representative images of whole perfused brains from 1-year-old CHCHD2-T61I Tg line U144, line U105 and WT littermates (Scale bar: 5 mm). (G) Quantitative analysis of whole brain weights from 1-year-old CHCHD2-T61I Tg line U144 and WT mice. Error bars represent mean ± SEM; n = 7 WT, n = 4 T61I U144; n.s., not significant. (H) Quantitative analysis of whole brain weights from 1-year-old CHCHD2-T61I Tg line U105 and WT mice. Error bars represent mean ± SEM; n = 7 WT, n = 9 T61I U144; n.s., not significant. (I) Representative images of whole spinal cords from 1-year-old CHCHD2-T61I Tg line U144, line U105 and WT littermates. CHCHD2-T61I Tg mice do not show any abnormalities of spinal cord morphology compared with nontransgenic littermates (Scale bar: 1 cm).
Figure 3
Figure 3
CHCHD2-T61I is expressed in different regions of the brain and localizes to the mitochondrial IMS. (A) Representative immunoblots of RIPA-soluble lysate from the cortex (CTX), midbrain (SN), spinal cord (SC) and hippocampus (HIP) from 1-year-old CHCHD2-T61I Tg mice and nontransgenic WT littermates. Exogenous CHCHD2 expression is clearly seen in all regions, with the highest expression seen in the cortex, midbrain and hippocampus. (B) Representative images of whole brain horizontal slices of 1-year-old CHCHD2-T61I Tg line U144, line U105 and WT littermates immunostained for M2 (flag) and CHCHD2 (Scale bar: 2 mm). (C) Representative images of cortex and midbrain regions immunostained for M2 (flag) and CHCHD2 from 1-year-old CHCHD2-T61I Tg line U144, line U105 and WT littermates (Scale bar: 20 μm). (D) Representative immunoblots of mitochondrial subfractionation from whole brains of 3- to 4-month-old CHCHD2-T61I Tg line U105 mice and WT littermates (n = 4 mice/genotype). The exogenous CHCHD2-T61I and endogenous CHCHD2 target correctly to the mitochondrial IMS in vivo.
Figure 4
Figure 4
Expression of CHCHD2-T61I induces the perinuclear aggregation of mitochondria in vivo. (A) Representative images from cortical and midbrain tissues immunostained with CHCHD2 and mitofilin. CHCHD2-T61I Tg mice exhibit the perinuclear aggregation of mitochondria (Scale bar: 20 μm) in the cortex and midbrain. (B and C) Quantitative analysis of cells with aggregated mitochondria in 1-year-old CHCHD2-T61I Tg line U144, line U105 and WT littermates. CHCHD2-T61I Tg show significantly increased mitochondrial aggregation in the cortex and midbrain. Error bars represent mean ± SEM; n = 4 mice/genotype; one-way ANOVA with Tukey post hoc test; *P < 0.05, **P < 0.005, #P < 0.0001.
Figure 5
Figure 5
CHCHD2-T61I Tg mice exhibit gliosis and synaptic dysfunction in vivo. (A) Representative images of 1-year-old CHCHD2-T61I Tg line U144, line U105 and WT hippocampus immunostained for GFAP and DAPI. (Scale bar: 500 μm.) (B) Quantitative analysis of hippocampal GFAP immunofluorescence intensity. One-year-old CHCHD2-T61I Tg line U144 mice exhibit increased hippocampal GFAP compared with nontransgenic littermates. Error bars represent mean ± SEM; n = 5 WT, n = 6 U144; t-test; #P < 0.0001. (C) Quantitative analysis of hippocampal GFAP immunofluorescence intensity. One-year-old CHCHD2-T61I Tg line U105 mice exhibit increased hippocampal GFAP compared with WT littermates. Error bars represent mean ± SEM; n = 4 WT, n = 5 U105; t-test; #P < 0.0001. (D) Representative images of 1-year-old CHCHD2-T61I Tg line U144, line U105 and WT cortex immunostained for Iba1 and DAPI. (Scale bar: 100 μm.) (E) Quantitative analysis of cortical Iba1 immunofluorescence intensity. One-year-old CHCHD2-T61I Tg line U144 mice exhibit increased cortical microgliosis compared with WT littermates. Error bars represent mean ± SEM; n = 5 WT, n = 6 U144; t-test; #P < 0.0001. (F) Quantitative analysis of cortical Iba1 immunofluorescence intensity. One-year-old CHCHD2-T61I Tg line U105 mice exhibit increased cortical microgliosis compared with WT littermates. Error bars represent mean ± SEM; n = 4 WT, n = 5 U144; t-test; **P < 0.005. (G) Representative images of 1-year-old CHCHD2-T61I Tg line U144, line U105 and WT hippocampus immunostained for synaptophysin and DAPI. (Scale bar: 100 μm.) (H) Quantitative analysis of synaptophysin intensity in the hippocampal CA3 region in 1-year-old CHCHD2-T61I Tg line U144 mice compared with WT littermates. CHCHD2-T61I Tg line U144 mice exhibit decreased synaptophysin immunoreactivity. Error bars represent mean ± SEM; n = 6/genotype; t-test **P < 0.005. (I) Quantitative analysis of synaptophysin intensity in the hippocampal CA3 region in 1-year-old CHCHD2-T61I Tg line U105 mice compared with nontransgenic WT littermates. CHCHD2-T61I Tg line U105 mice exhibit decreased synaptophysin immunoreactivity. Error bars represent mean ± SEM; n = 6/genotype; t-test; #P < 0.0001. Quantification of electrophysiological recordings. Ten-month-old CHCHD2-T61I Tg line U144 mice show significantly reduced hippocampal long-term potentiation induced by theta-burst stimulation (J) with no change in PPF (K) or input–output (L). Error bars represent mean ± SEM; n = 4/genotype; WT: 30 slices, T61I-Tg line U144: 32 slices, two-way ANOVA with Dunnett’s post hoc test; #P < 0.0001.
Figure 6
Figure 6
CHCHD2-T61I Tg mice exhibit dopaminergic neuronal loss and α-synuclein mislocalization. (A) Representative images of CHCHD2-T61I Tg line U144 midbrain immunostained for tyrosine hydroxylase to visualize dopaminergic neurons (Scale bar: 1 mm). (B) Quantification of TH+ cells in the substantia nigra (SN). One-year-old CHCHD2-T61I Tg line U144 mice exhibit DA neurodegeneration in the SN. Error bars represent mean ± SEM; n = 10 WT, n = 7 U144; t-test; ***P < 0.0005. (C) Quantification of TH+ cells in the VTA. One-year-old CHCHD2-T61I Tg line U144 mice do not exhibit DA neurodegeneration in the VTA. Error bars represent mean ± SEM; n = 10 WT, n = 7 U144; t-test; n.s., not significant. (D) Representative images of CHCHD2-T61I Tg line U105 midbrain immunostained for tyrosine hydroxylase to visualize DA neurons. (E) Quantification of TH+ cells in the SN. One-year-old CHCHD2-T61I Tg line U105 mice exhibit DA neurodegeneration in the SN. Error bars represent mean ± SEM; n = 5/genotype; t-test, **P < 0.005. (F) Quantification of TH+ cells in the VTA. One-year-old CHCHD2-T61I Tg line U105 mice do not exhibit DA neurodegeneration in the VTA. Error bars represent mean ± SEM; n = 5 WT, n = 5 U105; t-test; n.s., not significant. (G) Representative immunoblots of RIPA soluble and insoluble lysates from 1-year-old CHCHD2-T61I Tg line U105 midbrain. CHCHD2-T61I Tg line U105 mice exhibit insoluble accumulation of α-synuclein and S129 phospho-α-synuclein in the midbrain. (H) Representative images of midbrain tissue from 1-year-old CHCHD2-T61I Tg line U144 mice immunostained for α-synuclein, synaptophysin and tyrosine hydroxylase (Scale bar: 20 μm). (I) Quantification of colocalization between α-synuclein and synaptophysin. Error bars represent mean ± SEM; n = 4/genotype; t-test, ***P < 0.0005. (J) Representative images of midbrain tissue from 1-year-old CHCHD2-T61I Tg line U105 mice immunostained for α-synuclein, synaptophysin and tyrosine hydroxylase (Scale bar: 20 μm). (K) Quantification of colocalization between α-synuclein and synaptophysin. Error bars represent mean ± SEM; n = 4/genotype; t-test, *P < 0.05. (L) Representative immunoblots of RIPA-soluble synaptosomal and cytosolic lysates from brains of 1-year-old CHCHD2-T61I Tg line U105 mice. (M) Quantification of cytosolic α-synuclein. Error bars represent mean ± SEM; n = 4 WT, 3 U105; t-test, **P < 0.005.
Figure 7
Figure 7
CHCHD2-T61I Tg mice exhibit motor dysfunction without cognitive impairments at 1 year of age. (A) Rotarod testing in 1-year-old CHCHD2-T61I Tg mice compared with WT littermates. CHCHD2-T61I Tg mice line U105 exhibit motor dysfunction as indicated by a significant decrease in fall latency (n = 16 WT, n = 10 U105; one-way ANOVA; *P < 0.05). (B) Fear conditioning training indicates strong association between the conditioned stimulus (tone) and unconditional stimulus (shock) due to an increase in freezing over time. CHCHD2-T61I Tg mice do not differ in learning ability at 1 year of age compared with nontransgenic WT littermates. (C) One-year-old CHCHD2-T61I Tg mice do not exhibit dysfunction in hippocampal-driven or (D and E) amygdala-driven memory at 1 year of age (n = 15 WT, n = 12 T61I U144, n = 7 T61I U105).
Figure 8
Figure 8
Accumulation of insoluble proteins in CHCHD2-T61I Tg brains. (A) Schematic diagram of tissue lysate preparation for downstream proteomic and western blotting analysis (created with BioRender.com). Volcano plots showing Log (2) fold change of LFQ intensities and corresponding −Log (P-value) of proteins in 10-month-old CHCHD2-T61I brains compared with WT littermate brains from the RIPA-soluble fraction (B) and RIPA-insoluble fraction (C). The cut-off for significance (dotted horizontal line) is obtained by Welch’s t-test. Plots indicate reduced numbers of soluble proteins and increased numbers of insoluble proteins in CHCHD2-T61I brains. (D) Representative western blots from RIPA-soluble and RIPA-insoluble fractions of 10-month-old CHCHD2-T61I and WT littermate brains for a subset of proteins detected by mass spectrometry. Blots confirm increases in specific insoluble proteins in CHCHD2-T61I brains. (E) Graph represents IPA of top canonical pathways potentially disrupted in the insoluble fraction of CHCHD2-T61I brains compared with WT littermates plotted by Z-score and corresponding −Log (P-value). (F) Graph represents IPA of top canonical pathways (without Z-scores) altered in the insoluble fraction of CHCHD2-T61I brains compared with WT littermates plotted by −Log (P-value) and ratio of proteins mapped to the corresponding canonical pathway.

References

    1. Jellinger, K.A. (2018) Dementia with Lewy bodies and Parkinson's disease-dementia: current concepts and controversies. J. Neural Transm. (Vienna), 125, 615–650. - PubMed
    1. Spillantini, M.G., Schmidt, M.L., Lee, V.M., Trojanowski, J.Q., Jakes, R. and Goedert, M. (1997) Alpha-synuclein in Lewy bodies. Nature, 388, 839–840. - PubMed
    1. Beal, M.F. (1998) Mitochondrial dysfunction in neurodegenerative diseases. Biochim. Biophys. Acta, 1366, 211–223. - PubMed
    1. Johri, A. and Beal, M.F. (2012) Mitochondrial dysfunction in neurodegenerative diseases. J. Pharmacol. Exp. Ther., 342, 619–630. - PMC - PubMed
    1. Lin, M.T. and Beal, M.F. (2006) Mitochondrial dysfunction and oxidative stress in neurodegenerative diseases. Nature, 443, 787–795. - PubMed

Publication types