

Emergent evolutionary forces in spatial models of luminal growth and their application to the human gut microbiota
- PMID: 35787046
- PMCID: PMC9282425
- DOI: 10.1073/pnas.2114931119
Emergent evolutionary forces in spatial models of luminal growth and their application to the human gut microbiota
Abstract
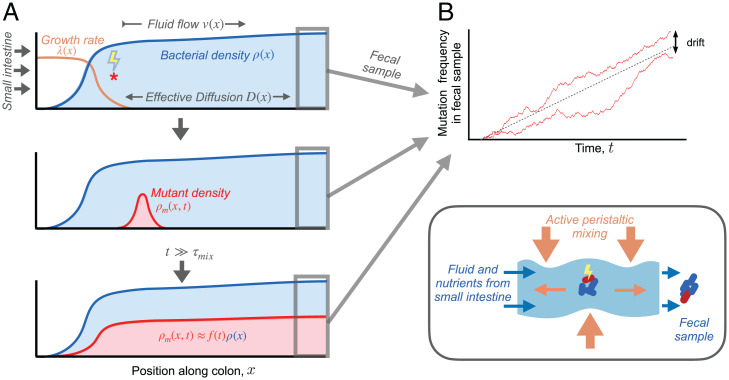
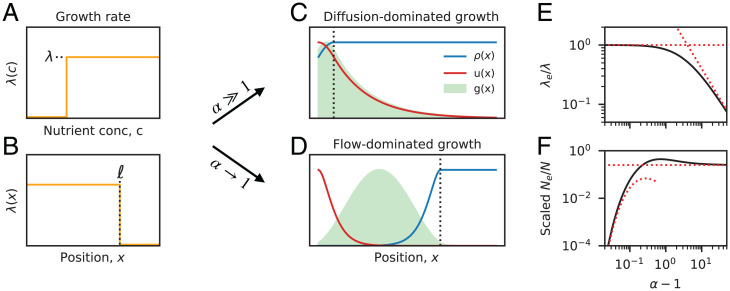
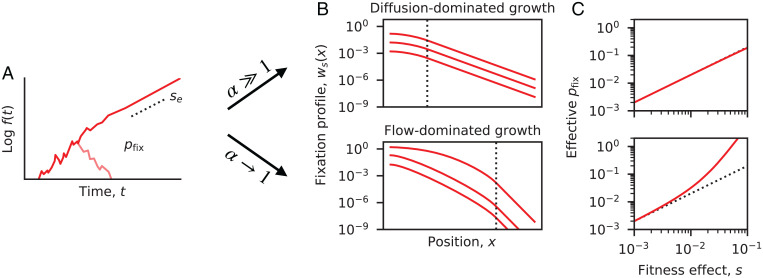
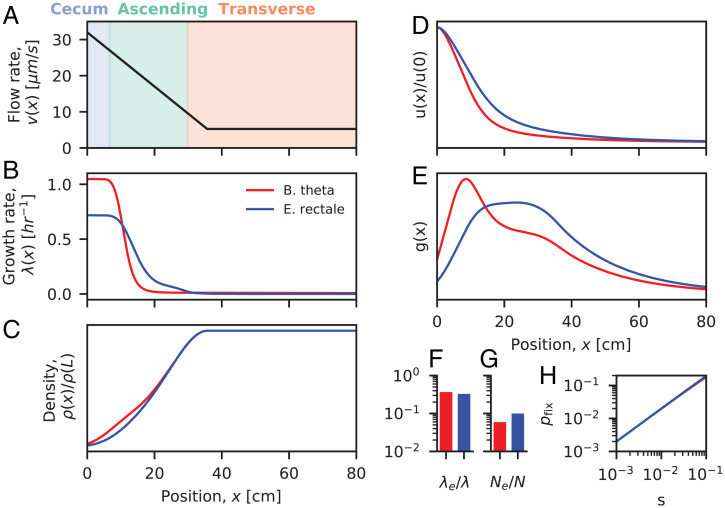
The genetic composition of the gut microbiota is constantly reshaped by ecological and evolutionary forces. These strain-level dynamics are challenging to understand because they depend on complex spatial growth processes that take place within a host. Here we introduce a population genetic framework to predict how stochastic evolutionary forces emerge from simple models of microbial growth in spatially extended environments like the intestinal lumen. Our framework shows how fluid flow and longitudinal variation in growth rate combine to shape the frequencies of genetic variants in simulated fecal samples, yielding analytical expressions for the effective generation times, selection coefficients, and rates of genetic drift. We find that over longer timescales, the emergent evolutionary dynamics can often be captured by well-mixed models that lack explicit spatial structure, even when there is substantial spatial variation in species-level composition. By applying these results to the human colon, we find that continuous fluid flow and simple forms of wall growth alone are unlikely to create sufficient bottlenecks to allow large fluctuations in mutant frequencies within a host. We also find that the effective generation times may be significantly shorter than expected from traditional average growth rate estimates. Our results provide a starting point for quantifying genetic turnover in spatially extended settings like the gut microbiota and may be relevant for other microbial ecosystems where unidirectional fluid flow plays an important role.
Keywords: genetic drift; natural selection; separation of timescales; spatial structure.
Conflict of interest statement
The authors declare no competing interest.
Figures
Similar articles
-
Evolutionary dynamics of bacteria in the gut microbiome within and across hosts.PLoS Biol. 2019 Jan 23;17(1):e3000102. doi: 10.1371/journal.pbio.3000102. eCollection 2019 Jan. PLoS Biol. 2019. PMID: 30673701 Free PMC article.
-
A mathematical model to investigate the key drivers of the biogeography of the colon microbiota.J Theor Biol. 2019 Feb 7;462:552-581. doi: 10.1016/j.jtbi.2018.12.009. Epub 2018 Dec 7. J Theor Biol. 2019. PMID: 30529486
-
CODY enables quantitatively spatiotemporal predictions on in vivo gut microbial variability induced by diet intervention.Proc Natl Acad Sci U S A. 2021 Mar 30;118(13):e2019336118. doi: 10.1073/pnas.2019336118. Proc Natl Acad Sci U S A. 2021. PMID: 33753486 Free PMC article.
-
Population and evolutionary dynamics in spatially structured seasonally varying environments.Biol Rev Camb Philos Soc. 2018 Aug;93(3):1578-1603. doi: 10.1111/brv.12409. Epub 2018 Mar 25. Biol Rev Camb Philos Soc. 2018. PMID: 29575449 Free PMC article. Review.
-
Population Genetics in the Human Microbiome.Trends Genet. 2020 Jan;36(1):53-67. doi: 10.1016/j.tig.2019.10.010. Epub 2019 Nov 25. Trends Genet. 2020. PMID: 31780057 Review.
Cited by
-
Deciphering and steering population-level response under spatial drug heterogeneity on microhabitat structures.bioRxiv [Preprint]. 2025 Jun 17:2025.02.13.638200. doi: 10.1101/2025.02.13.638200. bioRxiv. 2025. PMID: 40027692 Free PMC article. Preprint.
-
Predicting the First Steps of Evolution in Randomly Assembled Communities.bioRxiv [Preprint]. 2024 Jun 14:2023.12.15.571925. doi: 10.1101/2023.12.15.571925. bioRxiv. 2024. Update in: Nat Commun. 2024 Oct 1;15(1):8495. doi: 10.1038/s41467-024-52467-3. PMID: 38168431 Free PMC article. Updated. Preprint.
-
Quantifying the adaptive landscape of commensal gut bacteria using high-resolution lineage tracking.Nat Commun. 2024 Feb 21;15(1):1605. doi: 10.1038/s41467-024-45792-0. Nat Commun. 2024. PMID: 38383538 Free PMC article.
-
Predicting the first steps of evolution in randomly assembled communities.Nat Commun. 2024 Oct 1;15(1):8495. doi: 10.1038/s41467-024-52467-3. Nat Commun. 2024. PMID: 39353888 Free PMC article.
-
Fluid flow structures gut microbiota biofilm communities by distributing public goods.Proc Natl Acad Sci U S A. 2023 Jun 20;120(25):e2217577120. doi: 10.1073/pnas.2217577120. Epub 2023 Jun 12. Proc Natl Acad Sci U S A. 2023. PMID: 37307459 Free PMC article.
References
-
- Stephen A. M., Cummings J. H., The microbial contribution to human faecal mass. J. Med. Microbiol. 13, 45–56 (1980). - PubMed
Publication types
MeSH terms
LinkOut - more resources
Full Text Sources
