. 2022 Jul 12;119(28):e2111003119.
doi: 10.1073/pnas.2111003119. Epub 2022 Jul 5.

STING activation promotes robust immune response and NK cell-mediated tumor regression in glioblastoma models

Affiliations

STING activation promotes robust immune response and NK cell-mediated tumor regression in glioblastoma models

Gilles Berger et al. Proc Natl Acad Sci U S A. .

Abstract

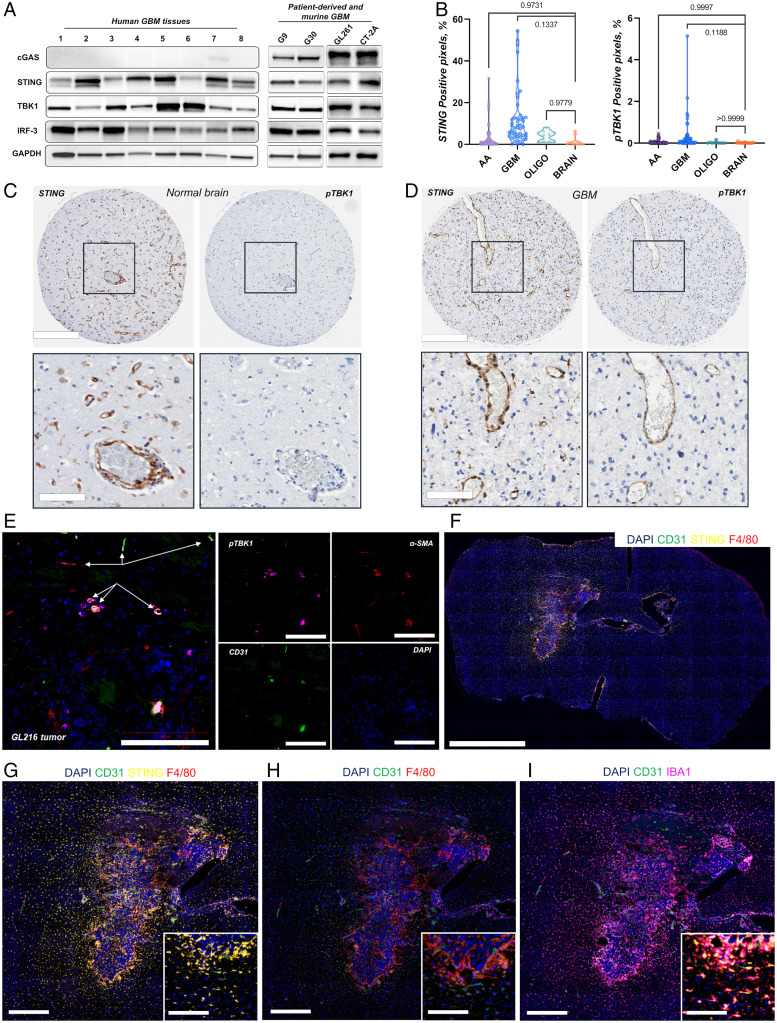
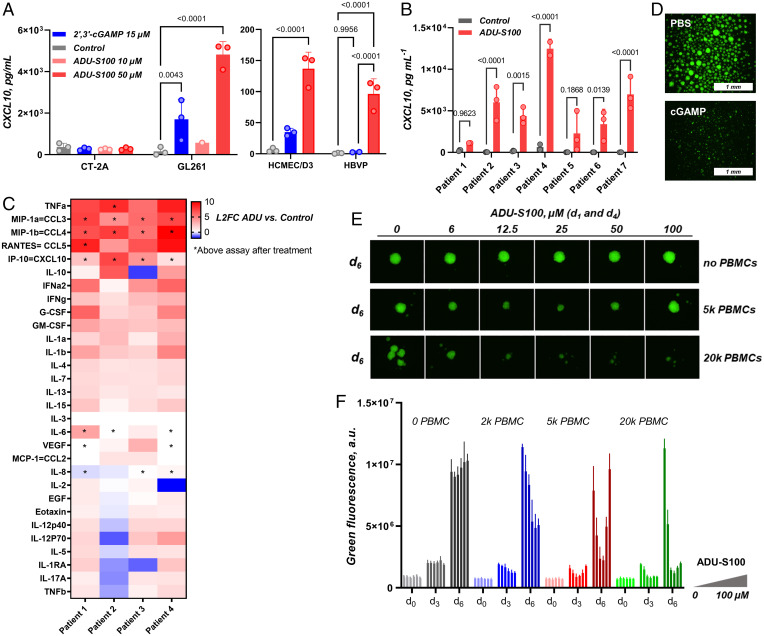
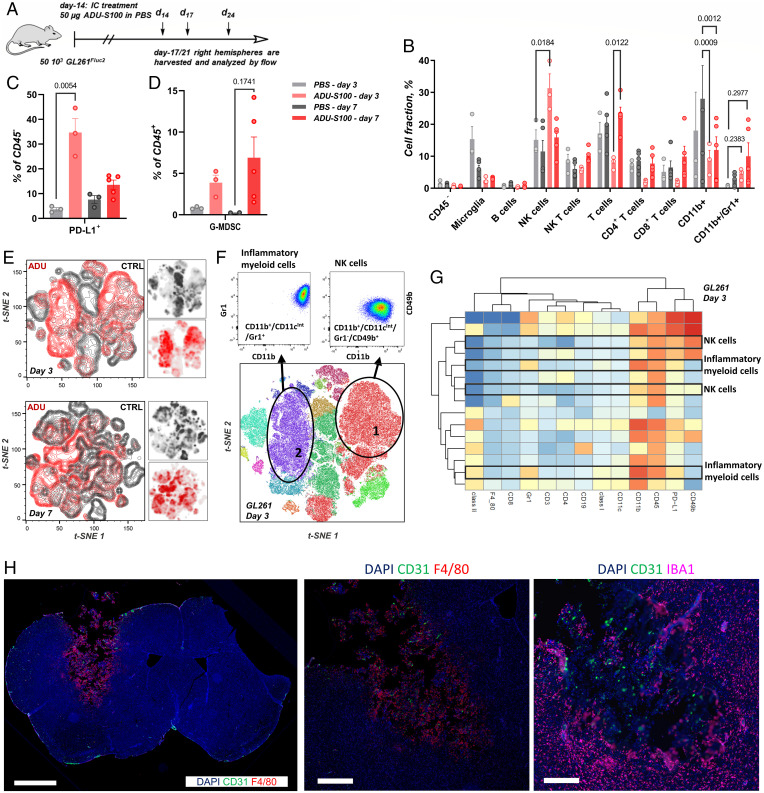
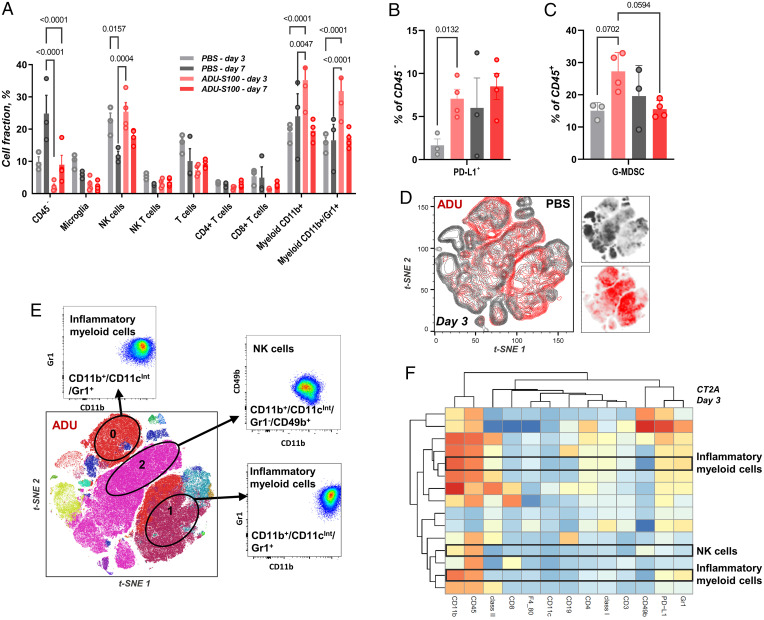
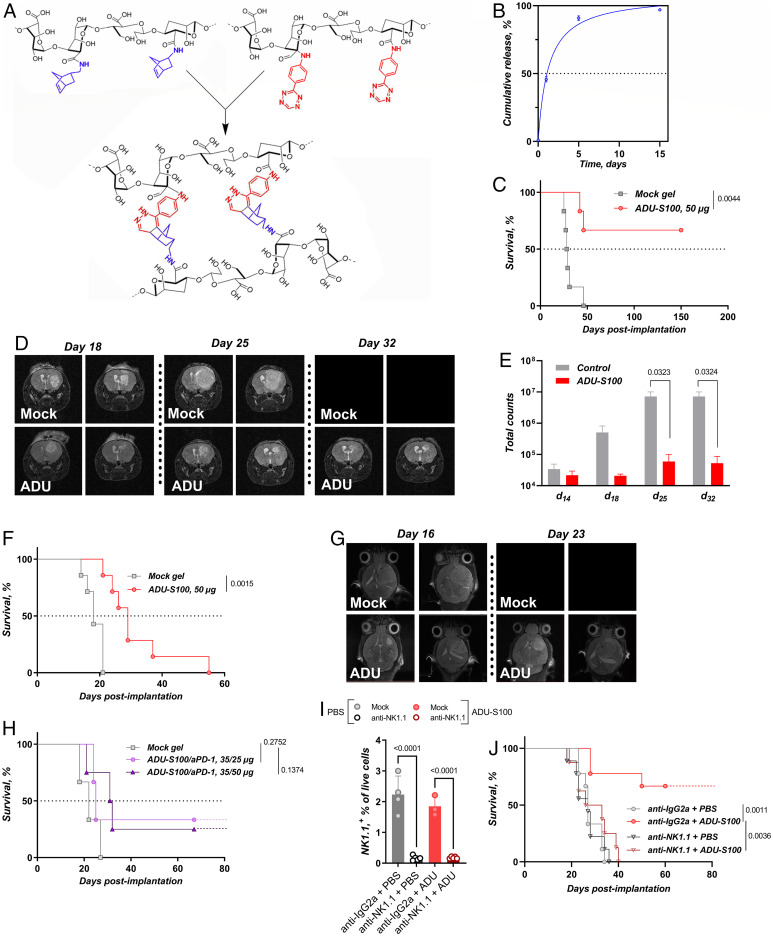
Immunotherapy has had a tremendous impact on cancer treatment in the past decade, with hitherto unseen responses at advanced and metastatic stages of the disease. However, the aggressive brain tumor glioblastoma (GBM) is highly immunosuppressive and remains largely refractory to current immunotherapeutic approaches. The stimulator of interferon genes (STING) DNA sensing pathway has emerged as a next-generation immunotherapy target with potent local immune stimulatory properties. Here, we investigated the status of the STING pathway in GBM and the modulation of the brain tumor microenvironment (TME) with the STING agonist ADU-S100. Our data reveal the presence of STING in human GBM specimens, where it stains strongly in the tumor vasculature. We show that human GBM explants can respond to STING agonist treatment by secretion of inflammatory cytokines. In murine GBM models, we show a profound shift in the tumor immune landscape after STING agonist treatment, with massive infiltration of the tumor-bearing hemisphere with innate immune cells including inflammatory macrophages, neutrophils, and natural killer (NK) populations. Treatment of established murine intracranial GL261 and CT-2A tumors by biodegradable ADU-S100-loaded intracranial implants demonstrated a significant increase in survival in both models and long-term survival with immune memory in GL261. Responses to treatment were abolished by NK cell depletion. This study reveals therapeutic potential and deep remodeling of the TME by STING activation in GBM and warrants further examination of STING agonists alone or in combination with other immunotherapies such as cancer vaccines, chimeric antigen receptor T cells, NK therapies, and immune checkpoint blockade.

Keywords: NK cells; STING; glioblastoma; immunotherapy.


Conflict of interest statement

The authors declare no competing interest.

Figures

Fig. 1.
Fig. 1.
Assessment of STING pathway expression in glioblastoma. (A) Immunoblot of cGAS, STING, TBK1, IRF-3, and glyceraldehyde 3-phosphate dehydrogenase (GAPDH) levels in patient GBM tissue, patient-derived GBM cells, murine GL261, and CT-2A glioma cells. (B) Quantification of TMA sections for STING and pTBK1, as percentage of positive pixels. AA, n = 77; GBM, n = 49; oligo, n = 10; brain, n = 16. P values calculated by one-way ANOVA. (C) Representative TMA sections immunostained for STING and pTBK1 in normal brain and (D) GBM. Scale bars, 400 and 100 µm. (E) Immunofluorescence staining showing partial activation of the STING cascade in GL261 tumors and the colocalization of pTBK1 within the vasculature (CD31 and α-SMA). Left panel: White arrows point to blood vessels. Right panel: Split channels show colocalization of pTBK1 with the vascular markers CD31 and α-SMA. Scale bar, 100 µm. (F) Multiplex immunofluorescence staining on a whole brain section from a GL261 tumor bearing mouse showing DAPI (blue), CD31 (green), STING (yellow), and F4/80 (red). Scale bar, 1 mm. (G–I) Immunofluorescence staining of the tumor zone showing selected markers as indicated (same as above plus IBA1 in magenta). Scale bars, 400 and 100 µm.
Fig. 2.
Fig. 2.
Effects of STING activation on GBM cells. (A) Levels of CXCL10 as measured by ELISA 24 h after STING agonist treatment of the indicated cell lines. P values calculated by two-way ANOVA. (B) CXCL10 ELISA levels from freshly resected patient GBM specimens cultured for 2–5 d after surgery (patient 1, 2 d; patients 2, 3, 5, 6, and 7, 3 d; patient 4, 5 d). Control vs. ADU-S100 (50 µM). P values calculated by two-way ANOVA. (C) Log2 fold-change cytokine/chemokine differences in conditioned media ADU-S100 (50 µM) vs. controls, from freshly resected patient GBM specimens cultured as above. (D) PBMC/G9pCDH coculture, ± cGAMP treatment at 100 µM, formulated with lipofectamine. (E) Immuno-GILA assay by coculture of fluorescent neurospheres (G9pCDH) and fresh PBMCs, treated with ADU-S100 (0–100 µM). (F) Fluorescence plots from the immuno-GILA assay with the various GSC:PBMC ratios at the indicated cell numbers over a period of days as shown in the bar chart over a range of drug concentrations.
Fig. 3.
Fig. 3.
Assessment of GL261 tumor immune infiltrates after STING agonist treatment. (A) Timeline of the GL261 in vivo experiments for BILs. Biologically independent animals per group (ADU-S100/PBS day 3, n = 3; PBS day 7, n = 3; ADU-S100 d 7, n = 5). P values calculated by two-way ANOVA. (B) BIL profile of GL261 tumors at days 3 and 7 using a typical gating procedure. (C) Percentage of PD-L1+ CD45 cells. P value calculated by unpaired t test. (D) G-MDSC populations within the BILs. P value calculated by unpaired t test. (E) 2D t-SNE plots at day 3 and 7; treated mice in red and controls in dark gray. (F) t-SNE map for treated mice at day 3 colored by the FlowSOM populations. (G) Heatmap and hierarchical clustering of the FlowSOM populations at day 3. (H) Immunofluorescence staining on a whole brain section and the necrotic tumor zone 72 h after ADU-S100 treatment (50 µg, bolus in PBS).
Fig. 4.
Fig. 4.
Assessment of CT-2A tumor immune infiltrates after STING agonist treatment. (A) BILs profile of CT-2A tumors at days 3 and 7 using a typical gating procedure. Biologically independent animals per group (PBS, n = 3; ADU-S100, n = 4). P values calculated by two-way ANOVA. (B) PD-L1+ percentage of CD45 cells. P value calculated by unpaired t test. (C) MDSC populations within the BILs. P values calculated by one-way ANOVA. (D) 2D t-SNE plots at day 3; treated mice in red and controls in dark gray. (E) t-SNE map for treated mice at day 3 colored by the FlowSOM populations; main up-regulated FlowSOM populations are highlighted. (F) Heatmap and hierarchical clustering of the FlowSOM populations at day 3.
Fig. 5.
Fig. 5.
STING agonist treatment of murine GBM in vivo. (A) Biodegradable cross-linked hydrogels used as intracranial implants. (B) In vitro gel release profile for cGAMP. (C) Kaplan–Meier plot for the GL261 ADU-S100 monotherapy study. P value calculated by the Gehan–Breslow–Wilcoxon test. 5 × 10⁴ GL261Fluc cells were implanted at day 0, and intracranial gels were implanted at day 14. Biologically independent animals per group (mock gel, n = 6; ADU-S100 50 µg, n = 6). (D) GL261 in vivo efficacy study showing MRI starting posttreatment day 18. Blank images represent euthanized animals. (E) Bioluminescence IVIS signal from treatment day to end point, GL261FLuc. P values calculated by multiple unpaired t tests. (F) Kaplan–Meier plot for the CT-2A ADU-S100 monotherapy study. P value calculated by the Gehan–Breslow–-Wilcoxon test. 5 × 10⁴ CT-2A cells were implanted at day 0, and intracranial gels were implanted at day 7. Biologically independent animals per group (mock gel, n = 6; ADU-S100 50 µg, n = 7). (G) CT-2A in vivo efficacy study showing representative MRI pictures at days 18 and 23. Blank images represent euthanized animals. (H) Kaplan–Meier plot for the CT-2A ADU-S100/aPD-1 combination study. P value calculated by the Gehan–Breslow–Wilcoxon test. 5 × 10⁴ CT-2A cells were implanted at day 0, and intracranial gels were implanted at day 7. Biologically independent animals per group (mock gel, n = 3; ADU-S100/aPD-1 35/25 µg, n = 3; ADU-S100/aPD-1 35/50 µg, n = 4). (I) Percentage of NK cells as measured in the whole blood of mice 32 h after intraperitoneal administration of the anti-NK1.1 depleting antibody, leading to >98% removal of the targeted immune cells (n = 3–5 mice per group). P values calculated by one-way ANOVA. (J) Kaplan–Meier plot for the GL261 ADU-S100 monotherapy study with and without NK depletion. 5 × 10⁴ GL261Fluc cells were implanted at day 0, and mice were treated intracranially at day 14. The depleting antibody was injected 36 h before STING agonist treatment and biweekly after that. P value calculated by the Gehan–Breslow–Wilcoxon test. Biologically independent animals per group (mock + PBS, n = 8; anti-NK1.1 + PBS, n = 8; mock + ADU-S100 50 µg, n = 9; anti-NK1.1 + ADU-S100 50 µg, n = 8).

References

    1. Sharma P., Allison J. P., The future of immune checkpoint therapy. Science 348, 56–61 (2015). - PubMed
    1. Ribas A., Wolchok J. D., Cancer immunotherapy using checkpoint blockade. Science 359, 1350–1355 (2018). - PMC - PubMed
    1. Schumacher T. N., Schreiber R. D., Neoantigens in cancer immunotherapy. Science 348, 69–74 (2015). - PubMed
    1. Ott P. A., Hodi F. S., Kaufman H. L., Wigginton J. M., Wolchok J. D., Combination immunotherapy: A road map. J. Immunother. Cancer 5, 16 (2017). - PMC - PubMed
    1. Stupp R., et al. ; European Organisation for Research and Treatment of Cancer Brain Tumor and Radiotherapy Groups; National Cancer Institute of Canada Clinical Trials Group, Radiotherapy plus concomitant and adjuvant temozolomide for glioblastoma. N. Engl. J. Med. 352, 987–996 (2005). - PubMed

Publication types