. 2022 Jul 1;78(Pt 7):281-288.
doi: 10.1107/S2053230X22006422. Epub 2022 Jul 4.

Serial crystallography with multi-stage merging of thousands of images

Affiliations

Serial crystallography with multi-stage merging of thousands of images

Alexei S Soares et al. Acta Crystallogr F Struct Biol Commun. .

Abstract

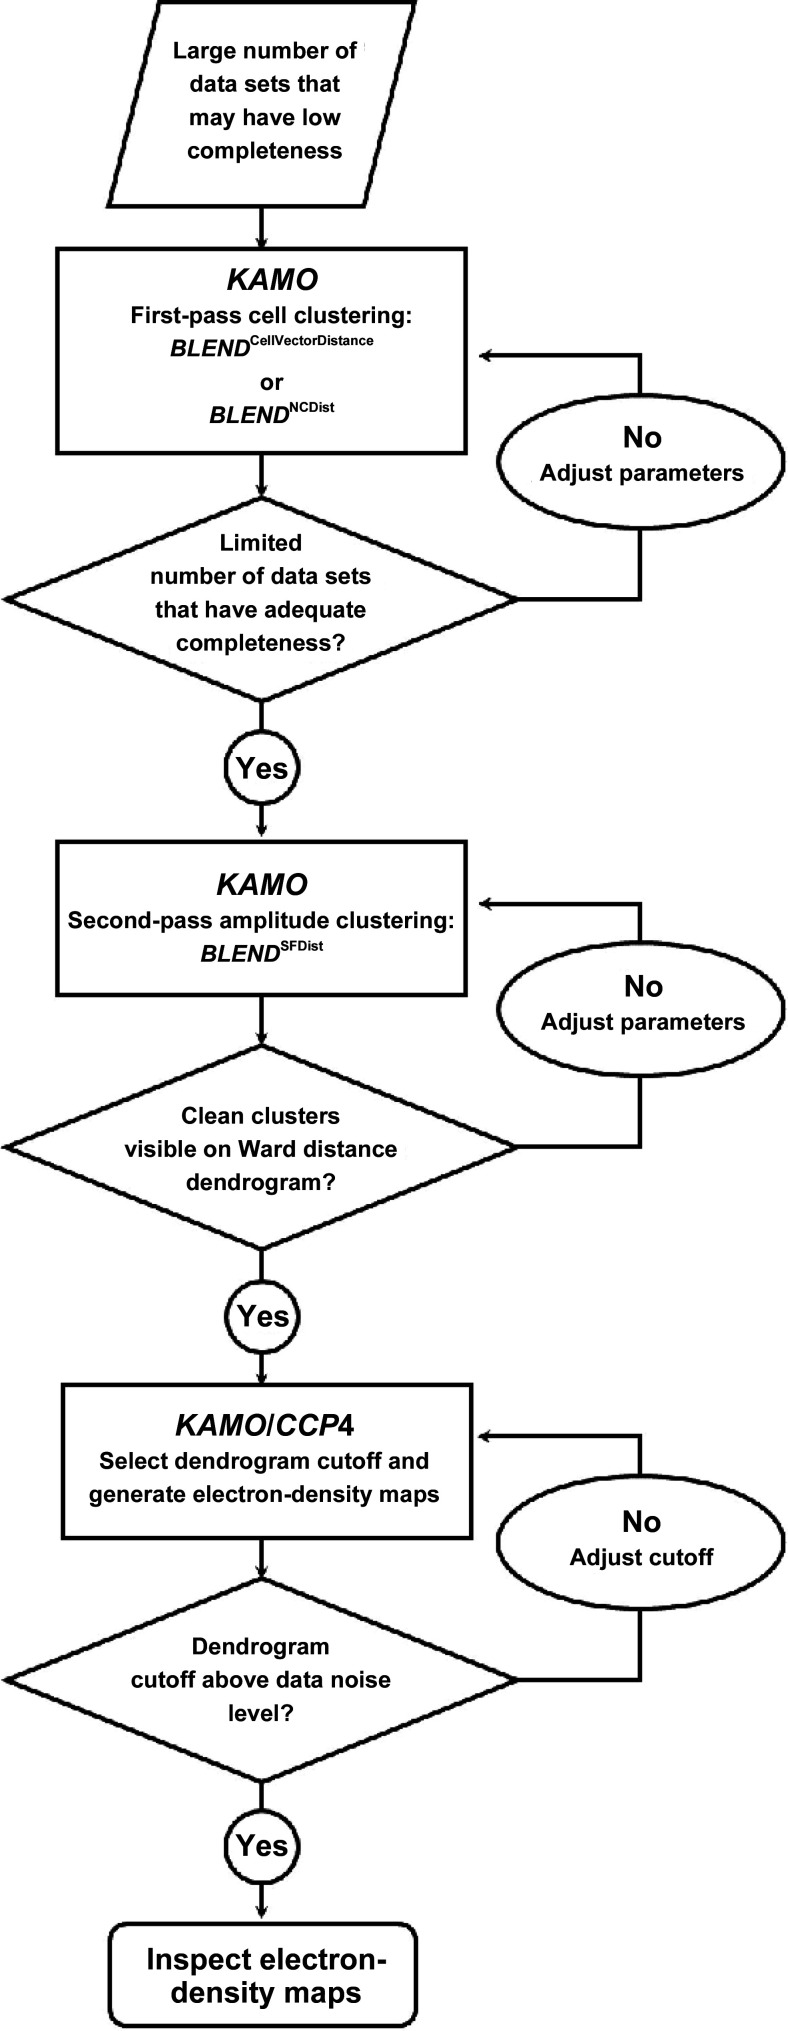
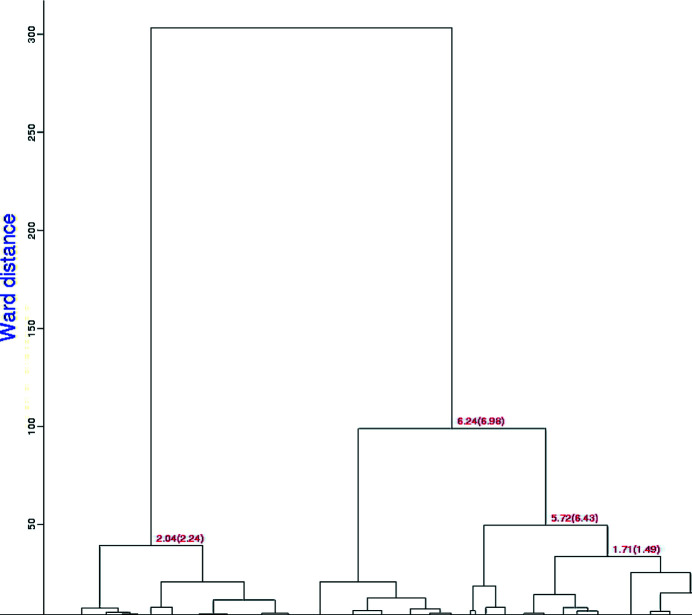
KAMO and BLEND provide particularly effective tools to automatically manage the merging of large numbers of data sets from serial crystallography. The requirement for manual intervention in the process can be reduced by extending BLEND to support additional clustering options such as the use of more accurate cell distance metrics and the use of reflection-intensity correlation coefficients to infer `distances' among sets of reflections. This increases the sensitivity to differences in unit-cell parameters and allows clustering to assemble nearly complete data sets on the basis of intensity or amplitude differences. If the data sets are already sufficiently complete to permit it, one applies KAMO once and clusters the data using intensities only. When starting from incomplete data sets, one applies KAMO twice, first using unit-cell parameters. In this step, either the simple cell vector distance of the original BLEND or the more sensitive NCDist is used. This step tends to find clusters of sufficient size such that, when merged, each cluster is sufficiently complete to allow reflection intensities or amplitudes to be compared. One then uses KAMO again using the correlation between reflections with a common hkl to merge clusters in a way that is sensitive to structural differences that may not have perturbed the unit-cell parameters sufficiently to make meaningful clusters. Many groups have developed effective clustering algorithms that use a measurable physical parameter from each diffraction still or wedge to cluster the data into categories which then can be merged, one hopes, to yield the electron density from a single protein form. Since these physical parameters are often largely independent of one another, it should be possible to greatly improve the efficacy of data-clustering software by using a multi-stage partitioning strategy. Here, one possible approach to multi-stage data clustering is demonstrated. The strategy is to use unit-cell clustering until the merged data are sufficiently complete and then to use intensity-based clustering. Using this strategy, it is demonstrated that it is possible to accurately cluster data sets from crystals that have subtle differences.

Keywords: BLEND; KAMO; clustering; serial crystallography.


Figures

Figure 1
Figure 1
Process flow in the use of KAMO and BLEND. In the case of the four-way clustering discussed in Sections 3 and 4, a total of 896 data sets were input to the first-stage NCDist clustering engine and a total of 107 data sets were input to the second-stage SFDist clustering engine (first and second rectangles).
Figure 2
Figure 2
Electron-density maps calculated after two-way clustering of diffraction data obtained from micro-meshes that contained a mixture of doubly bound crystals (benzamidine plus NAG) (a) and native crystals (no ligands) (b). The omit difference maps are contoured at 1.5σ in the region expected to contain benzamidine (top) and NAG (bottom). The histogram cluster in (c) represents the unit-cell dimensions of the cluster of crystal data sets that yielded the omit difference map shown in (a). Similarly, the histogram cluster on the right in (c) represents the unit-cell dimensions of the cluster of crystal data shown in (b). Clearly the clustering algorithm was able to accurately partition the data for this simple two-way split. See Section S1.
Figure 3
Figure 3
This dendrogram presents the top levels of BLEND clustering using the original less-sensitive BLEND unit-cell parameter distance function. The numbers are the LCV and the aLCV, with the aLCV in parentheses.
Figure 4
Figure 4
This dendrogram presents the top levels of BLEND clustering using the more sensitive Andrews–Bernstein Niggli-cone distance (NCDist) algorithm. The numbers are the LCV and the aLCV, with the aLCV in parentheses. Clustering is guided by the progressive merging of separate clusters into larger clusters using a measure of cluster proximity known as the Ward distance. This is equal to the increase of the distance variance (between each element of a cluster and its centroid) resulting from the merging of two separate clusters (Ward, 1963 ▸). Note that the Ward distances are smaller than those for the equivalent clusters in Fig. 3 ▸.
Figure 5
Figure 5
Omit difference map of the NAG site in cluster 28 of a two-stage clustering with KAMO using unit-cell parameters and NCDist to reach 10% completeness and then CC clustering with SFDist.
Figure 6
Figure 6
Omit difference map of the NAG site in cluster 43 of a two-stage clustering with KAMO using unit-cell parameters and NCDist to reach 10% completeness and then CC clustering with SFDist.
Figure 7
Figure 7
Omit difference map of the NAG site in cluster 62 of a two-stage clustering with KAMO using unit-cell parameters and NCDist to reach 10% completeness and then CC clustering with SFDist.
Figure 8
Figure 8
Omit difference map of the benzamidine site in cluster 28 of a two-stage clustering with KAMO using unit-cell parameters and NCDist to reach 10% completeness and then CC clustering with SFDist.
Figure 9
Figure 9
Omit difference map of the benzamidine site in cluster 43 of a two-stage clustering with KAMO using unit-cell parameters and NCDist to reach 10% completeness and then CC clustering with SFDist.
Figure 10
Figure 10
Omit difference map of the benzamidine site in cluster 62 of a two-stage clustering with KAMO using unit-cell parameters and NCDist to reach 10% completeness and then CC clustering with SFDist.
Figure 11
Figure 11
Color charts of the 35 largest data-set clusters for the NCDist clustering. From top to bottom the color blocks are the native soak, the benzamidine plus NAG soak, the benzamidine soak and the NAG soak. If one color reaches nearly from the bottom to the top at a given position then that cluster is a nearly pure species.
Figure 12
Figure 12
Color charts of the 35 largest data-set clusters for the SFDist clustering. From top to bottom the color blocks are the native soak, the benzamidine plus NAG soak, the benzamidine soak and the NAG soak. If one color reaches nearly from the bottom to the top at a given position then that cluster is a nearly pure species. This is the case for each soak at the left end of this SFDist chart.

References

    1. Andrews, L. C. & Bernstein, H. J. (2014). J. Appl. Cryst. 47, 346–359. - PMC - PubMed
    1. Assmann, G., Brehm, W. & Diederichs, K. (2016). J. Appl. Cryst. 49, 1021–1028. - PMC - PubMed
    1. Bellman, R. (1956). Dynamic Programming. Santa Monica: The Rand Corporation.
    1. Berman, H. M., Westbrook, J., Feng, Z., Gilliland, G., Bhat, T. N., Weissig, H., Shindyalov, I. N. & Bourne, P. E. (2000). Nucleic Acids Res. 28, 235–242. - PMC - PubMed
    1. Bernstein, F. C., Koetzle, T. F., Williams, G. J. B., Meyer, E. F. Jr, Brice, M. D., Rodgers, J. R., Kennard, O., Shimanouchi, T. & Tasumi, M. (1977). J. Mol. Biol. 112, 535–542. - PubMed