. 2022 Jul;24(7):1141-1153.
doi: 10.1038/s41556-022-00941-9. Epub 2022 Jul 4.

Z-DNA is remodelled by ZBTB43 in prospermatogonia to safeguard the germline genome and epigenome

Affiliations

Z-DNA is remodelled by ZBTB43 in prospermatogonia to safeguard the germline genome and epigenome

Yingying Meng et al. Nat Cell Biol. 2022 Jul.

Abstract

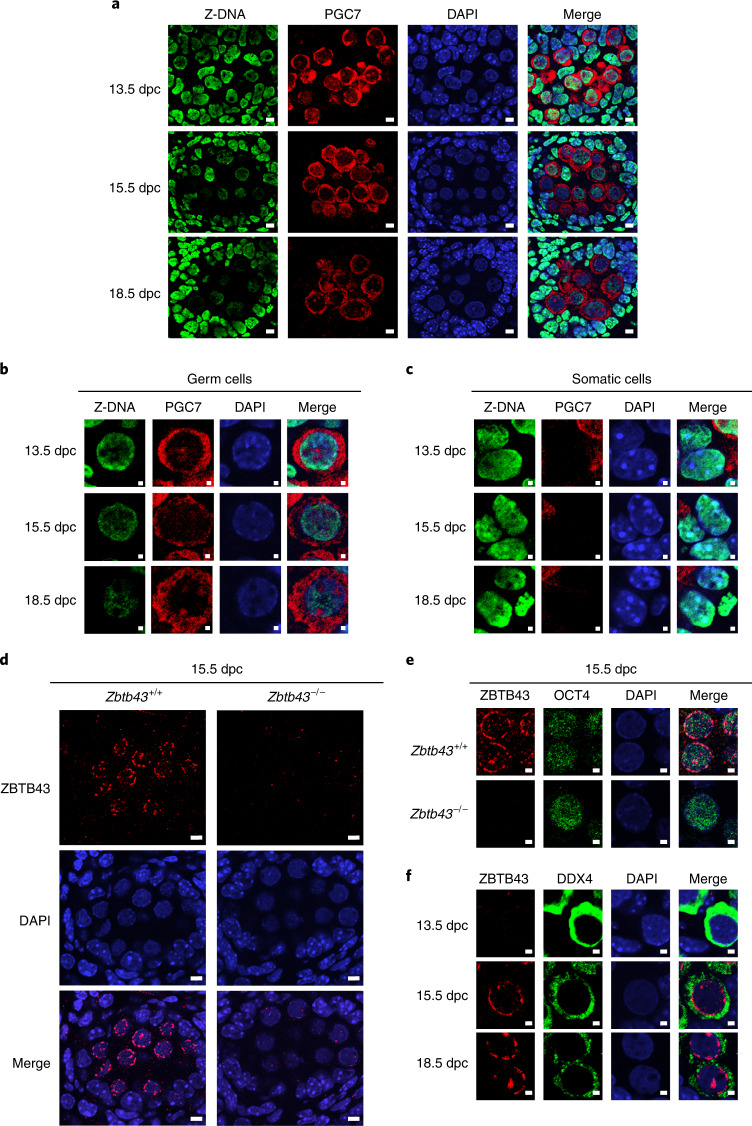
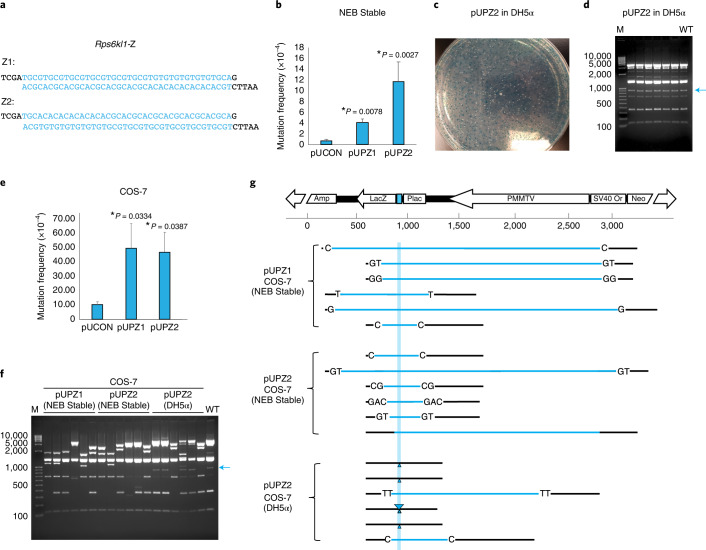
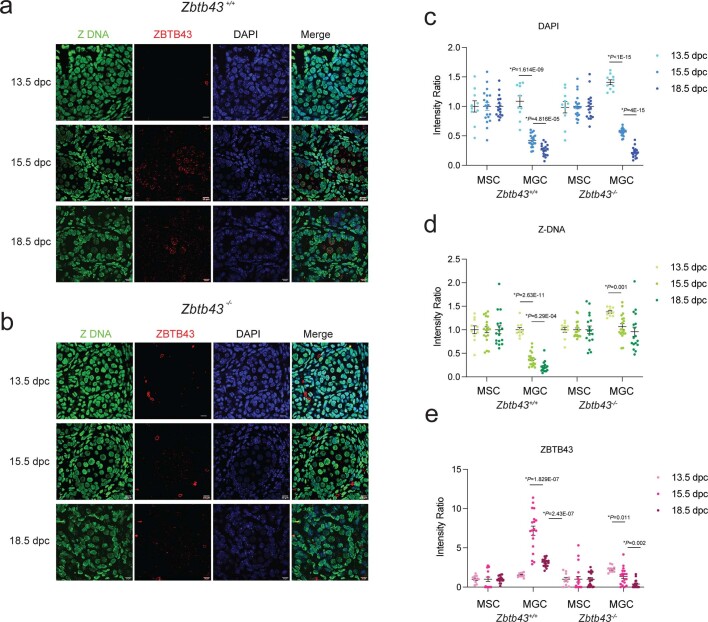
Mutagenic purine-pyrimidine repeats can adopt the left-handed Z-DNA conformation. DNA breaks at potential Z-DNA sites can lead to somatic mutations in cancer or to germline mutations that are transmitted to the next generation. It is not known whether any mechanism exists in the germ line to control Z-DNA structure and DNA breaks at purine-pyrimidine repeats. Here we provide genetic, epigenomic and biochemical evidence for the existence of a biological process that erases Z-DNA specifically in germ cells of the mouse male foetus. We show that a previously uncharacterized zinc finger protein, ZBTB43, binds to and removes Z-DNA, preventing the formation of DNA double-strand breaks. By removing Z-DNA, ZBTB43 also promotes de novo DNA methylation at CG-containing purine-pyrimidine repeats in prospermatogonia. Therefore, the genomic and epigenomic integrity of the species is safeguarded by remodelling DNA structure in the mammalian germ line during a critical window of germline epigenome reprogramming.


Conflict of interest statement

The authors declare no competing interests.

Figures

Fig. 1
Fig. 1. Natural removal of Z-DNA in germ cells of the mouse foetus.
Immunohistochemistry images of testis samples are shown from male mouse foetuses. a, Z-DNA antibody staining (green) is diminishing in germ cells, as identified by PGC7 staining (red) at 13.5, 15.5 and 18.5 dpc. Scale bars, 5 µm. b,c, Loss of Z-DNA is specific to the germ cells in the foetal testis. Immunohistochemistry is shown for foetal testis sections at 13.5, 15.5 and 18.5 dpc timepoints, using Z-DNA antibody (green), germ cell marker (PGC7) and DAPI counterstain. Merged images are displayed on the right. Prospermatogonia (b) exhibit loss of Z-DNA. Somatic cells (c) maintain Z-DNA. Scale bars, 1 µm. d, ZBTB43 protein is detected in germ cells inside the testicular cords of the wild-type but not in the Zbtb43−/− mutant testis at 15.5 dpc. Note the typical weak and diffuse DAPI staining of germ cell nuclei. The surrounding Sertoli cells, which exhibit stronger DAPI staining, are negative for ZBTB43 staining. Scale bars, 5 µm. e, Double staining of 15.5 dpc germ cells with ZBTB43 and germ cell marker OCT4 antibodies is shown in testis samples at 15.5 dpc. Scale bars, 2 µm. f, Double staining of testis samples using the ZBTB43 and germ cell marker DDX4 antibodies is shown at the foetal days as marked. Scale bars, 2 µm. The results shown represent three independent immunostaining experiments using four biologically independent testis samples per experiment (ac), five independent experiments using three biologically independent testis samples per experiment (d), one immunostaining experiment using two biologically independent testis samples (e) and two independent immunostaining experiments using two biologically independent testis samples per experiment (f).
Fig. 2
Fig. 2. ZBTB43 is a DNA binding protein with affinity to PPRs.
a, Structure of the ZBTB43 protein. Location of the BTB domain and the three ZF domains are indicated. The full-length protein (ZBTB43-FL), its ZF domain (ZBTB43-ZF) and its BTB domain (ZBTB43-BTB) were purified, as shown in the protein gels to the right. Protein purification and protein gel testing was done twice for ZBTB-FL and ZBTB-ZF and once for ZBTB43-BTB. b, Outline of the affinity sequencing experiment. MBP tag was used for the capture. c, ZBTB43 protein has affinity to methylated and unmethylated genomic DNA. Heatmap analysis of MBP-ZBTB43-FL binding is shown to genomic DNA, either DNMT-TKO ES cell DNA or DNA fully methylated by SssI bacterial CpG methyltransferase centred at the TKO DNA peaks. Background level binding by MBP is shown on the right. d, Consensus binding sequences of the affinity peaks in TKO determined by RSAT (top), significance 4.5e−13, BaMM (middle), dataset performance 0.096, motif performance 0.84, and MEME (bottom), significance 4.7e−2775. e, Heatmap shows the match between ZBTB43 affinity binding and predicted Z-DNA sites. f, IGV browser images of selected specific MBP-ZBTB43 peaks are shown in TKO DNA samples at four genomic regions. Control samples show the background of MBP capture. The tracks for transcripts and predicted Z-DNA are displayed at the bottom. The affinity-sequencing results shown represent two independent biological replicates in c, e and f. g, EMSA confirm the binding of ZBTB43-FL or ZBTB43-ZF to the regions detected by affinity sequencing. The FAM-labelled probes (CACG)8, Rps6kl1, and Ago2, marked as a, b, and c, respectively, were competed out of the complexes by 100-fold excess of specific (Self) but not by the mutant (Mut) cold competitor. (h) EMSA confirms the binding of ZBTB43-ZF to the consensus PPR sequences. The FAM-labelled probes (CA)16 and (CACG)8, marked as d and a, respectively, resulted in specific shift; they were competed out of the complexes by 100-fold excess of specific (Self) but not by the mutant (Mut) cold competitor. The BTB domain of ZBTB43 (ZBTB43-BTB) lacked binding activity. Data shown represent three independent experiments in panels g and h. Source data
Fig. 3
Fig. 3. ZBTB43 binding sequences are mutagenic in mammalian cells.
a, ZBTB43 binding sequence at Rps6kl1, in forward and reverse orientation (Z1 and Z2), was inserted into the vector pUCON, and the resulting plasmids pUPZ1 and pUPZ2 were tested in LacZ mutation assays. b, Mutation frequencies in bacterial NEB Stable cells. Average values of three replicate samples are shown with standard deviation. Statistically significant differences (P < 0.05) resulting from n = 3 independent experiments are marked. These were obtained using two-tailed Student’s t-tests (unequal variance). c, The LacZ gene is frequently mutated at the Z-DNA insert, as depicted by an agarose plate with DH5α bacteria that contain the parent plasmid (blue colonies) or its mutants (white colonies). d, Restriction digestion is shown from randomly picked clones recovered from DH5α bacteria. DNA sequencing revealed small mutations that did not change the size of the 910-bp-long PPR-containing DNA fragment (blue arrow). Molecular size marker is shown in the left lane. Wild-type plasmid (WT) is depicted in the right lane. e, Mutation frequencies in mammalian COS-7 cells. Average values of three replicate samples are shown with standard deviation. Statistically significant differences (P < 0.05) resulting from n = 3 independent experiments are marked. These were obtained using two-tailed Student’s t-tests (unequal variance). f, Restriction digestion is shown from randomly picked biologically independent clones recovered from COS-7 cells and grown in NEB Stable or DH5α bacteria. The loss of the 910-bp-long PPR-containing fragment (blue arrow) reveals large deletions. Molecular size marker is shown in the left lane. Wild-type plasmid (WT) is depicted in the right lane. Restriction digestion results in d and f are shown from one of three independent mutagenesis experiments. g, Mutation detection in the pUPZ1 and pUPZ2 plasmids mutagenized in COS-7 cells. Structural elements of the vector plasmid are depicted at the top. Position of the inserted Z1 and reciprocal, Z2 sequences is shown in turquoise. Sequencing results are shown from biologically independent clones recovered in NEB Stable or DH5α bacteria, as indicated. Deletions are marked by blue horizontal bars. Micro-homologies that flank these deletions are shown by the DNA sequence. Sequencing results are shown from one of three independent mutagenesis experiments. Source data
Fig. 4
Fig. 4. ZBTB43 binding sequences can form the Z-DNA structure in vitro.
a, EMSA. Hexamine CoCl3 was added to the DNA probes at increasing concentrations. The induced Z-DNA was detected as a gel shift using the anti-Z-DNA antibody Z22. b, Z-DNA formation (blue lines) is detected by CD spectroscopy at the (CACG)8 consensus sequence in response to different concentrations of CoCl3. The B-DNA specific spectrum is displayed in red. c, 2D gel electrophoresis detects a kink (blue arrow) at certain plasmid topoisomers, a sign of Z-DNA formation. d, Generation of circular Z-DNA probe. When two single-stranded circles (CC) are annealed, part of the circle, which contains PPRs is forced into left-handed DNA. Circular B-DNA is prepared by annealing a circular and a linear strand followed by ligating the nick (CL). Linear B-DNA is prepared by annealing two strands of linear DNA (LL). e,f, Z-DNA structure is confirmed in the CC probe by its insensitivity to restriction enzymes. The CC, CL and LL probes of PPR sequences, as marked above, were subjected to restriction digestion. The CC form (turquoise asterisk), was refractory. The CL form (black asterisk) is linearized, and the LL form is restricted to two fragments (red asterisks). Experiments where the (CACG)6 sequence (e), and the Rps6kl1-Y peak sequence (f) are digested using HhaI and BsiwI are displayed. g, Z-DNA is formed in the CC probe at the ZBTB43 consensus sequence. Increasing amount of the Z-DNA antibody Z22 quantitatively shifts the CC probe of (CACG)6 and Rps6kl1-Z sequences. h, ZBTB43 binds Z-DNA. EMSA results show that ZBTB43-FL shifts the CC probe containing the (CACG)6 and Rps6kl1-Z sequences. Data shown represent three independent experiments in ac and eh. i, ZBTB43 binds both Z-DNA and B-DNA but prefers Z-DNA. Competition binding experiment is shown where the CC and CL probes were mixed at equal molar ratios and the aliquots were allowed to interact with increasing amounts of ZBTB43-FL before separating the free probes and complexes in EMSA gels. The remaining free CC and CL probes in each reaction were quantified in the gel images. Data are presented as mean ± standard error of the mean (s.e.m.) from n = 3 independent experiments. Source data Source data
Fig. 5
Fig. 5. ZBTB43 removes Z-DNA in vitro.
ac show that ZBTB43 has the capacity to remove Z-DNA in vitro. a, Restriction digestion using TaiI of the Rps6kl1-Z affinity peak in the CC probe (blue asterisk) and the LL probe confirms Z-DNA and B-DNA, respectively. b, ZBTB43 renders CC sensitive to digestion. The CC probe was reacted with TOPO1, or ZBTB43, or both, followed by phenol extraction and precipitation. The resulting DNA was run on a gel before or after TaiI digestion. TOPO1 and/or ZBTB43 resulted in a band that migrated slower than the CC form (black asterisk). TaiI produced a linear 121 bp fragment (red asterisk). c, ZBTB43 has no effect on B-DNA. The LL probe (121 bp) was reacted with TOPO1, and/or ZBTB43, and the recovered LL DNA was still sensitive to TaiI digestion into two fragments of 37 and 84 bp. d, ZBTB43 enhances the effect of TOPO1 in reducing supercoiling-induced tension. TOPO1 was reacted with plasmid DNA containing the Rps6kl1 affinity peak sequence in the presence or absence of ethidium bromide (EB6 or EB0, respectively) and increasing amounts of ZBTB43-FL. Control reactions were run without TOPO1. Supercoiled plasmid (PL) purified from bacteria and a molecular weight marker (M) are included. eh show that ZBTB43 reverses the action of ADAR1 Z-α domain on DNA topology in vitro. e, To induce Z-DNA, the Z-α domain was added to the (CA)16 linear DNA probe in increasing molar excess. B-DNA specific spectrum, peaking at 280 nm (orange dot) is eliminated by 20× excess of Z-α. New Z-DNA peaks (turquoise and blue dots) at 260 nm are visible at 40× and 80× excess of Z-α. f, ZBTB43 has no effect on B-DNA topology. g, Forty-fold molar excess of ZBTB43 reverses the Z-to-B shift caused by 20-fold molar excess of Z-α (280 nm peak regained, green dot). h, Forty-fold molar excess of ZBTB43 reverses the Z-to-B shift caused by 40-fold molar excess of Z-α (ZBTB43 reverts the peak from 260 nm). Data shown represent two (ac) or three (d) independent experiments. Experiments in eh have been performed once, and each CD spectrum is presented as an average of three scans. Source data
Fig. 6
Fig. 6. ZBTB43 removes Z-DNA in prospermatogonia and protects from DSBs.
a, Global Z-DNA is eliminated by ZBTB43 in Zbtb43+/+, but not in Zbtb43−/− foetal testis sections at 15.5 dpc. Images of testicular cords were obtained by immunohistochemistry and confocal microscopy using the ZBTB43 (red), and Z-DNA (green) antibodies, counterstained with DAPI. Scale bars, 10 µm. b, Images of testicular cords as above are shown using higher magnification and background reduction. Scale bar, 5 µm. c, Images of germ cells as above are shown using higher magnification. Scale bars, 2 µm. d, Quantification of the fluorescence intensities of DAPI, Z-DNA and ZBTB43 immunostaining are depicted in 15.5 dpc Zbtb43+/+ and Zbtb43−/− prospermatogonia. Spermatogonia (n = 10 + 9) were quantified from two independent foetuses for each genotype. The intensity was measured by Fiji, and the quantification was done by Prism. Data are presented as mean ± s.e.m. The differences between genotypes were statistically significant for the Z-DNA and ZBTB43 intensities by multiple unpaired two-tailed t-tests. e, ZBTB43 protects from DSBs. Immunohistochemistry of the 15.5 dpc Zbtb43+/+ and Zbtb43−/− foetal testis sections is shown using the γH2AX (red) and DDX4 (green) antibodies, counterstained with DAPI. Scale bars, 5 µm. f, Enlarged details of the testicular cords are displayed. Scale bars, 2 µm. The results shown represent three (ac) or two (e,f) independent experiments done using four biologically independent testis samples per experiment. Source data
Fig. 7
Fig. 7. ZBTB43 binds at PPRs in prospermatogonia in vivo.
a, Genome browser images of ZBTB43 ChIP–seq peaks (light green) obtained in purified 15.5 dpc prospermatogonia are displayed at 12 genomic locations. IgG lanes are shown as controls. The ChIP peaks align with the in vitro affinity sequencing peaks found in fully methylated genomic DNA (SssI) and in fully unmethylated genomic DNA (TKO) (dark green). MBP affinity-seq lanes are shown as controls. The scale of reads was normalized between experimental samples and their respective background control samples using the ‘group-autoscale’ function of IGV as marked on the right. b,c, Heatmap showing the ZBTB43 ChIP–seq peaks detected against IgG background in 100,000 (b) or 500,000 (c) purified prospermatogonia. The read intensities in three libraries, ZBTB43 antibody, IgG antibody and input DNA (as marked above), are plotted centred at the peak and using +1 kb and −1 kb flanking regions. d,e, Venn diagrams depicting the location of ZBTB43 ChIP–seq peaks mapped in 15.5 dpc prospermatogonia relative to the location of transcripts in the genome. In d, all genomic locations are plotted. In e, distal intergenic regions are excluded. f, The ZBTB43 ChIP–seq peaks detected in vivo are recognized by purified ZBTB43 protein in vitro. Heatmaps display the read intensities of ZBTB43-FL and the control MBP in affinity binding with unmethylated DNA (TKO) or methylated DNA (SssI). The plotted regions were centred at ChIP peaks called in 500,000 or 100,000 prospermatogonia against IgG, as indicated at the bottom. g, The ZBTB43 ChIP–seq peaks detected in prospermatogonia align with affinity-seq peaks and with predicted Z-DNA. Heat maps display the ChIP–seq log2 IP/IgG read intensities detected in 500 K or 100 K prospermatogonia (as marked at the top) along subset of genomic regions centred at ZBTB43-FL affinity-seq peaks in methylated DNA (SssI), unmethylated DNA (TKO) and at the subset of predicted Z-DNA sites (marked at the bottom) where overlap is found with ChIP–seq peaks. The ChIP–seq and affinity-sequencing results shown represent two independent biological replicates in a, f and g.
Fig. 8
Fig. 8. ZBTB43 is required for de novo methylation of PPRs in prospermatogonia.
a, Z-DNA structure inhibits DNMT3A catalytic activity in vitro. The CC, CL and LL substrates were prepared from the Rps6kl1 affinity binding sequence and were subjected to methylation by DNMT3A at 30× or 60× molar excess. The level of DNA methylation at each CpG is plotted after multiplexed bisulfite sequencing in two biologically independent replicates. b, DNA methylation is aberrant in sperm of Zbtb43−/− mice at the sites of ZBTB43 binding. IGV browser images display selected in vivo hypomethylated regions detected using MIRA–seq assays in Zbtb43−/− versus wild-type spermatozoa (navy). The ZBTB43 affinity binding peaks (green), and ChIP–seq peaks mapped in 15.5 dpc prospermatogonia (light green) are also shown together with the MBP and IgG backgrounds. Independent replicate samples are displayed. c, DMRs originate at the time of de novo methylation in prospermatogonia. Bisulfite sequencing results show methylated and unmethylated CpGs (black and white circle, respectively) along individual chromosomes at specific DMR sequences and at one control region in adult spermatozoa (top) and 18.5 dpc prospermatogonia (bottom). The genotypes are marked on the left. d, Heatmap displaying the MIRA–seq intensities in navy at the hypomethylated and hypermethylated DMRs identified between Zbtb43−/− and Zbtb43+/+ spermatozoa. Heatmaps to the right in green show the affinity binding of MBP-ZBTB43-FL in unmethylated and methylated genomic DNA (TKO and SssI) centred at the sites of sperm DMRs. The sequencing results shown represent two independent biological replicates in b and d. e, ZBTB43 ChIP–seq peaks in 15.5 dpc prospermatogonia overlap with hypo-DMRs detected in Zbtb43−/− sperm DNA. Venn diagrams. f, Model. Top: ZBTB43 binds Z-DNA in normal prospermatogonia. By removing Z-DNA, ZBTB43 creates an accessible substrate for DNMT3A and facilitates DNA methylation establishment at PPR-rich DNA regions. Bottom: Z-DNA is not removed in the Zbtb43−/− prospermatogonia in the absence of ZBTB43, DNA methylation is not established at PPRs, and hypomethylated DMRs are found in mutant sperm. One prominent ZBTB43 region can induce large re-arrangements in mammalian mutation assays, and ZBTB43 protects from DSBs by directly binding to PPRs and removing mutagenic Z-DNA structures in the foetal germ cells.
Extended Data Fig. 1
Extended Data Fig. 1. Zbtb43 is specific to fetal male germ cells that remodel Z-DNA.
(a) The fetal testis and mesonephros are shown in transmitted light to the left. Testicular cords are visualized by transgenic EGFP expression to the right. EGFP expression in the TgOG2 mouse line allows germ cell isolation by FACS. MGC: male germ cell (EGFP positive); MSC: male somatic cell (EGFP negative). FACS gating strategy is shown. R6: EGFP+, R5: EGFP-. (b) RNA-seq results are displayed in purified male germ cells (MGC), female germ cells (FGC) and somatic cells of male and female gonads (MSC and FSC) at 15.5 dpc (GSE46953). Transcript levels of Zbtb43 are plotted among other Zbtb family members. (c) Zbtb43 expression is depicted among some of the most highly expressed transcripts (apart from ribosomal proteins, elongation complex members or chaperons) in purified MGC, FGC, MSC, and FSC at 15.5 dpc. (d) Zbtb43 expression is shown for mouse organs outside of the gonads. GEO Profiles: GDS661/116970_at from #BioProject PRJNA66167.
Extended Data Fig. 2
Extended Data Fig. 2. Validation of Zbtb43-/- knockout mice.
(a) Knockout strategy. Mice carrying the Zbtb43tm1b(KOMP)Mbp allele. A LacZ cassette replaced exon 4 of the Zbtb43 gene. (b) PCR genotyping from tail DNA to distinguish Zbtb43+/+, Zbtb43+/- and Zbtb43-/- pups at weaning. Data shown represent three independent experiments. (c) Western blot in adult kidney samples using the anti-ZBTB43 antibody and GAPDH loading control. (d) Western blot in adult kidney and brain samples using the anti-LacZ antibody. Data shown represent two independent experiments in c and d. Source data
Extended Data Fig. 3
Extended Data Fig. 3. ZBTB43 protein has affinity to methylated and unmethylated genomic DNA and to predicted Z-DNA-forming sequences.
(a-b) Heatmap analysis is shown of MBP-ZBTB43 (FL) binding intensities to genomic DNA, either Dnmt1/Dnmt3a/Dnmt3b triple knockout (TKO) ES cell DNA or DNA fully methylated by SssI bacterial CpG methyltransferase (SssI) centered at the TKO DNA peaks (a) and at the SssI peaks (b). Background level binding by MBP is included to the right. (c) Venn diagram shows the relationship between ZBTB43 affinity peaks mapped in SssI and TKO DNA. (d) Venn diagram shows the relationship between ZBTB43 affinity peaks mapped in SssI DNA, TKO DNA, and predicted Z-DNA sites or enriched Z-DNA sites in activated B-cells. (e-f) Heatmaps show the match between ZBTB43 affinity binding peaks and Z-DNA sites. The affinity intensities are centered at predicted Z-DNA sites (e) and enriched Z-DNA sites mapped in activated B-cells (f). (g-h) Venn diagrams displays the relationship between predicted Z-DNA locations and ZBTB43 affinity binding sites in SssI (g) or TKO DNA (h). (i-j) Venn diagrams displays the relationship between in vivo mapped Z-DNA sites in activated B-cells and ZBTB43 affinity binding sites in SssI DNA (i) or TKO DNA (j). Affinity-sequencing results shown represent two biologically independent samples.
Extended Data Fig. 4
Extended Data Fig. 4. Examples of ZBTB43 affinity binding peaks.
IGV browser images of selected specific MBP-ZBTB43 peaks are shown in unmethylated genomic DNA (TKO) at four genomic regions. Control samples show the background of MBP capture. Independent biological replicate samples are displayed. The tracks for transcripts and predicted Z-DNA are displayed at the bottom. The predicted Z-DNA sequence is enlarged to illustrate the underlying PPR sequences. The ZBTB43 peaks are often found in an intron of very long transcripts. (a) Rps6kl1 (b) Ago2 (c) Arid2 (d) Eml1.
Extended Data Fig. 5
Extended Data Fig. 5. The distribution of ZBTB43 affinity binding peaks closely matches predicted Z-DNA sites.
Venn diagrams depict the location of ZBTB43 affinity peaks mapped in fully methylated genomic DNA (SssI) and unmethylated genomic DNA (TKO) relative to the location of transcripts in the genome. In comparison, the distribution of predicted Z-DNA and enriched Z-DNA mapped in vivo in activated B-cells are also depicted to the right. (a) All genomic locations are plotted. (b) Distal intergenic regions are excluded. Affinity-sequencing results represent two independent biological replicates.
Extended Data Fig. 6
Extended Data Fig. 6. Z-DNA is removed in prospermatogonia between 13.5 and 15.5 dpc.
(a-b) Immunohistochemistry is shown of the Zbtb43+/+ wild-type (a), and Zbtb43-/- mutant (b) fetal testis sections at 13.5, 15.5 and 18.5 dpc using the ZBTB43 (red), and Z-DNA (green) antibodies, counterstained with DAPI. Scale bar: 10 µm. The ZBTB43-Z-DNA double staining was done three times at all stages. (c-e) Quantification of signal intensities of DAPI, Z-DNA and ZBTB43 in Zbtb43+/+ wild-type, and Zbtb43-/- mutant fetal male germ cells shown relative to the corresponding somatic cells at 13.5 dpc (n=10 cells from one out of two independent experiments) and at 15.5 and 18.5 dpc (n=19 cells from one out of two independent experiments). Data are presented as mean values +/- SEM. Statistically significant changes as calculated by multiple 2-sided T-tests are marked with P-value. Source data
Extended Data Fig. 7
Extended Data Fig. 7. ZBTB43 has affinity to hypomethylated DMRs found in Zbtb43-/- sperm, which are rich in Z-DNA sites.
(a) Venn diagram displays the relationship between ZBTB43 affinity peaks in fully methylated (SssI) genomic DNA and DMRs detected in Zbtb43-/- sperm. (b) Venn diagram displays the relationship between ZBTB43 affinity peaks in fully unmethylated (TKO) genomic DNA and DMRs detected in Zbtb43-/- sperm. (c) Venn diagram shows the relationship between predicted Z-DNA sites in the genome and DMRs detected in Zbtb43-/- sperm. (d) Venn diagram shows the relationship between enriched Z-DNA sites in activated B-cells in the genome and DMRs detected in Zbtb43-/- sperm.
Extended Data Fig. 8
Extended Data Fig. 8. Growth and lethality phenotypes associated with the Zbtb43 mutation in the soma and germ line.
(a) Zbtb43-/- pups out of the test cross are underrepresented at weaning. Venn diagram shows the distribution of genotypes at weaning from 55 pups out of 6 breeding pairs and 13 litters of the original Zbtb43+/- heterozygous stock (HET x HET). The genotype distribution of live weanlings is also plotted from a test cross where the parents had been back-crossed 8-times in the JF1/Ms mouse strain (HET.JF1.N8 x HET.JF1.N8). These results were obtained from four breeding pairs, 19 litters and 70 pups. (b) Zbtb43-/- pups are overrepresented among dead pups out of the HET x HET cross. Venn diagram shows the distribution of dead pups by genotype. We identified 6 Zbtb43-/- dead pups out of 11 total dead pups from 2 litters of 1 breeding pair of the HET x HET initial cross by PCR genotyping. After backcrossing to C57BL/6N once, we identified 10 Zbtb43-/- dead pups out 23 dead pups from 20 litters of 4 pairs of HET.B6 X Het B6. (c) Zbtb43-/- dead pups (n=16) are overrepresented among all dead pups out of the HOMO x HET cross. Venn diagram shows the distribution of dead pups by genotype. (d) Partially penetrant lethality in the Zbtb43 mutant mouse line depends on parental genotype. The portion of newborn pups that died is depicted by bar graphs. The lethality phenotype is shown according to different parental crosses as indicated below each bar. The postnatal day of death (P0, P1, P2 and after P2) is shown by colored columns as coded to the right. Zbtb43-/- (HOMO), and Zbtb43+/- (HET) mice were obtained from the original JAX stock. Another set of mice were obtained after crossing to C57Bl/6N (B6) one time (HOMO B6, and HET B6). The mother is written first in each cross. The number of breeding pairs, litters, and pups born are provided under the chart. (e) The partial perinatal lethality phenotype of Zbtb43-/- pups persists through generations (N1, N2, N3 and N4) in the HOMO x HOMO crosses. Total number of animals and litters in each generation are marked under the plot. (f-g) Zbtb43-/- pups from Zbtb43-/- parents exhibit reduced growth compared to Zbtb43+/+ pups out of Zbtb43+/+ parents. Weight of male (f) and female (g) pups is plotted at weeks 2, 3, 4, 5, 5, 6, and 8 after birth, and numbers of pups included in the measurements are given under the dot plots. Data are presented as mean values +/- SEM. Statistical analysis between genotypes at each age was done using multiple two-sided T-Tests. (h-i) Zbtb43-/- pups exhibit reduced growth after weaning compared to their littermates. Growth of male (h) and female (i) pups out of HET x HET cross is depicted. Weight of WT, HET and HOMO pups is shown as coded by colors to the right and numbers of pups are given under the dot plots. Data are presented as mean values +/- SEM. Statistically significant difference is marked with P-value as determined using multiple two-sided T-Tests between pairs of genotypes at each age. (j) Parental genotype of Zbtb43+/+ pups does not affect their growth. Growth curve of male and female WT pups is shown from 3 weeks to 8 weeks. Solid lines indicate the average weight of WT pups out of WT parents. Dashed lines indicate the average weight of WT pups out of the HET x HET cross. Data are presented as mean values +/- SEM. No statistically significant difference was found between crosses using multiple 2-sided T-Tests. (k) Parental genotype of male and female Zbtb43-/- pups affects their growth after weaning. Growth curve of male and female HOMO pups is shown from 3 weeks to 8 weeks. Solid lines indicate the average weight of HOMO pups out of HOMO x HOMO cross. Dashed lines indicate the average weight of HOMO pups out of the HET x HET cross. Data are presented as mean values +/- SEM. Statistically significant differences between crosses at each age as obtained from multiple two-sided T-Tests are marked. Source data

References

    1. Drew H, Takano T, Tanaka S, Itakura K, Dickerson RE. High-salt d(CpGpCpG), a left-handed Z′ DNA double helix. Nature. 1980;286:567–573. - PubMed
    1. Crawford JL, et al. The tetramer d(CpGpCpG) crystallizes as a left-handed double helix. Proc. Natl Acad. Sci. USA. 1980;77:4016–4020. - PMC - PubMed
    1. Rich A, Zhang S. Timeline: Z-DNA: the long road to biological function. Nat. Rev. Genet. 2003;4:566–572. - PubMed
    1. Zhao J, Bacolla A, Wang G, Vasquez KM. Non-B DNA structure-induced genetic instability and evolution. Cell. Mol. Life Sci. 2010;67:43–62. - PMC - PubMed
    1. Boehm T, et al. Alternating purine–pyrimidine tracts may promote chromosomal translocations seen in a variety of human lymphoid tumours. EMBO J. 1989;8:2621–2631. - PMC - PubMed

Publication types