. 2022 Jul;24(7):1064-1076.
doi: 10.1038/s41556-022-00946-4. Epub 2022 Jul 4.

CRISPR screening uncovers a central requirement for HHEX in pancreatic lineage commitment and plasticity restriction

Affiliations

CRISPR screening uncovers a central requirement for HHEX in pancreatic lineage commitment and plasticity restriction

Dapeng Yang et al. Nat Cell Biol. 2022 Jul.

Abstract

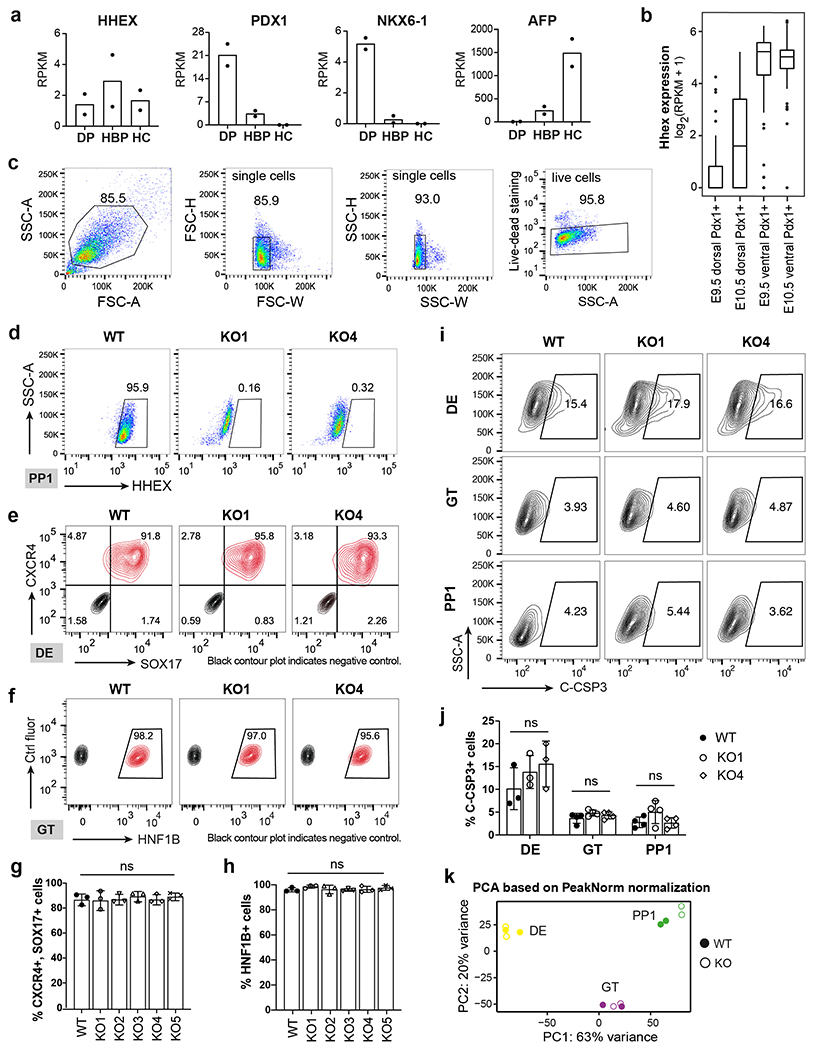
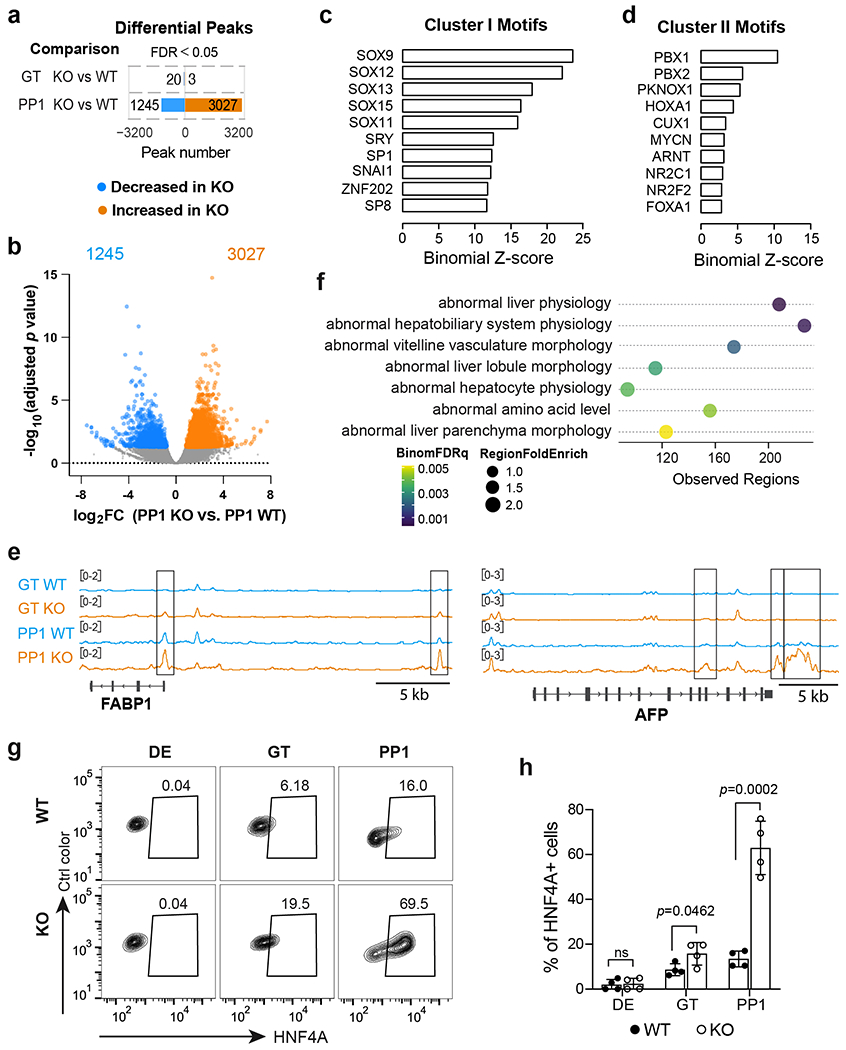
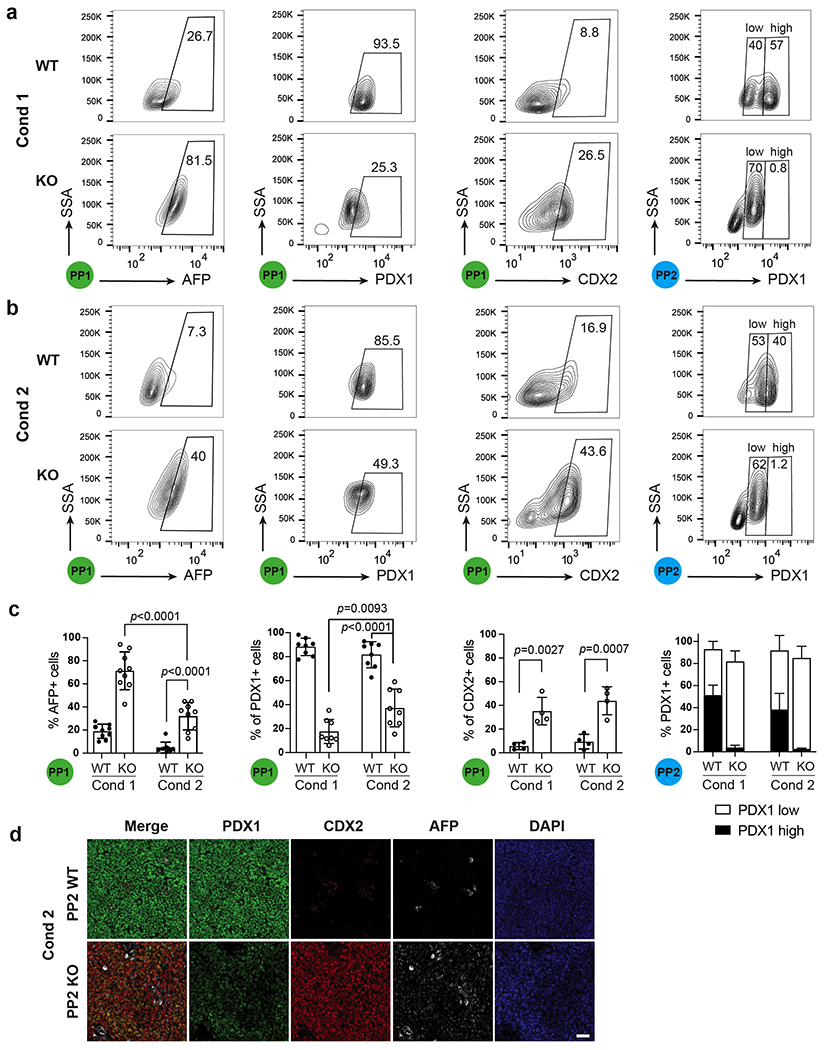
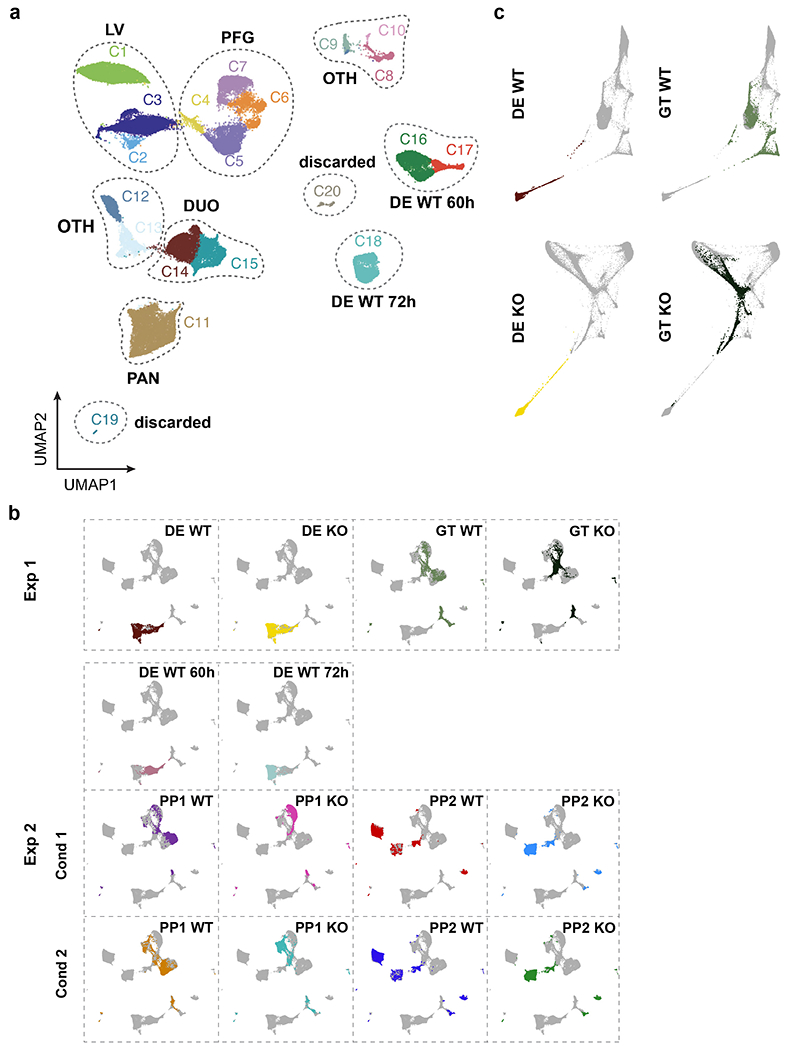
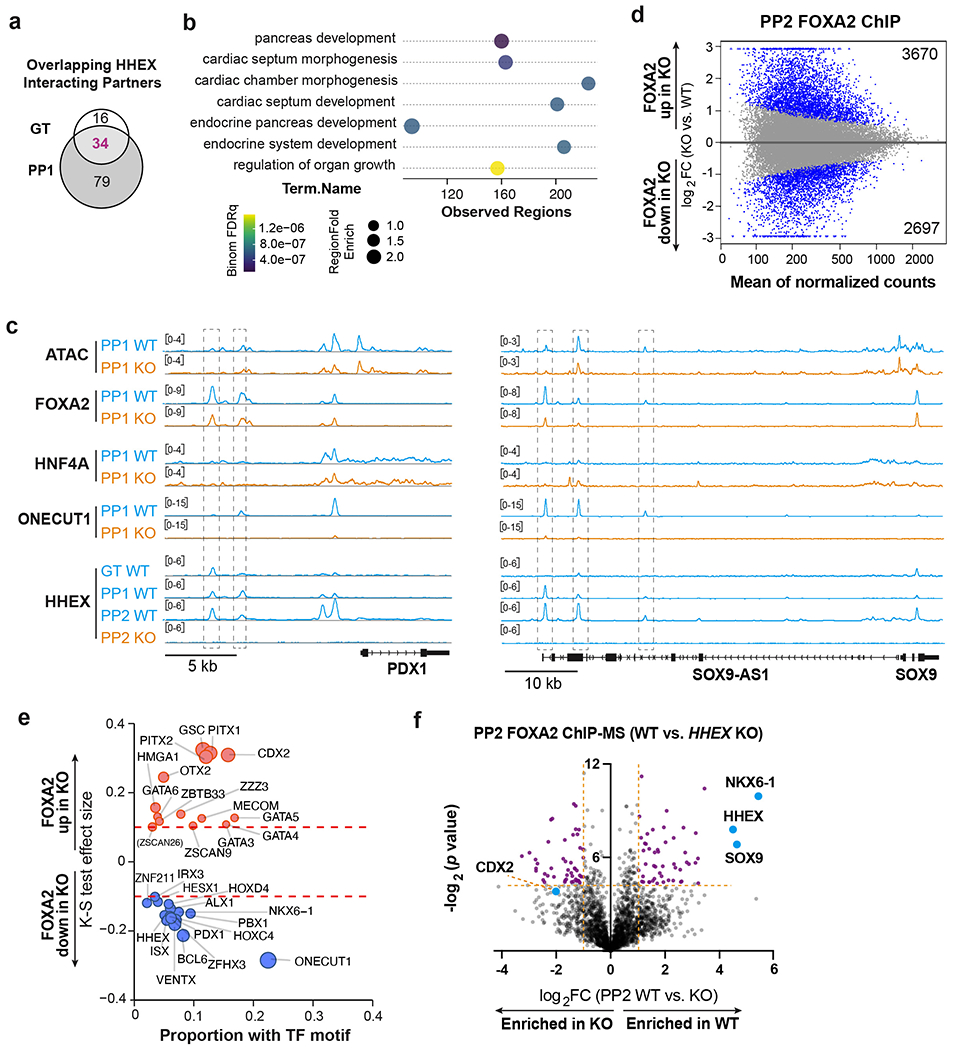
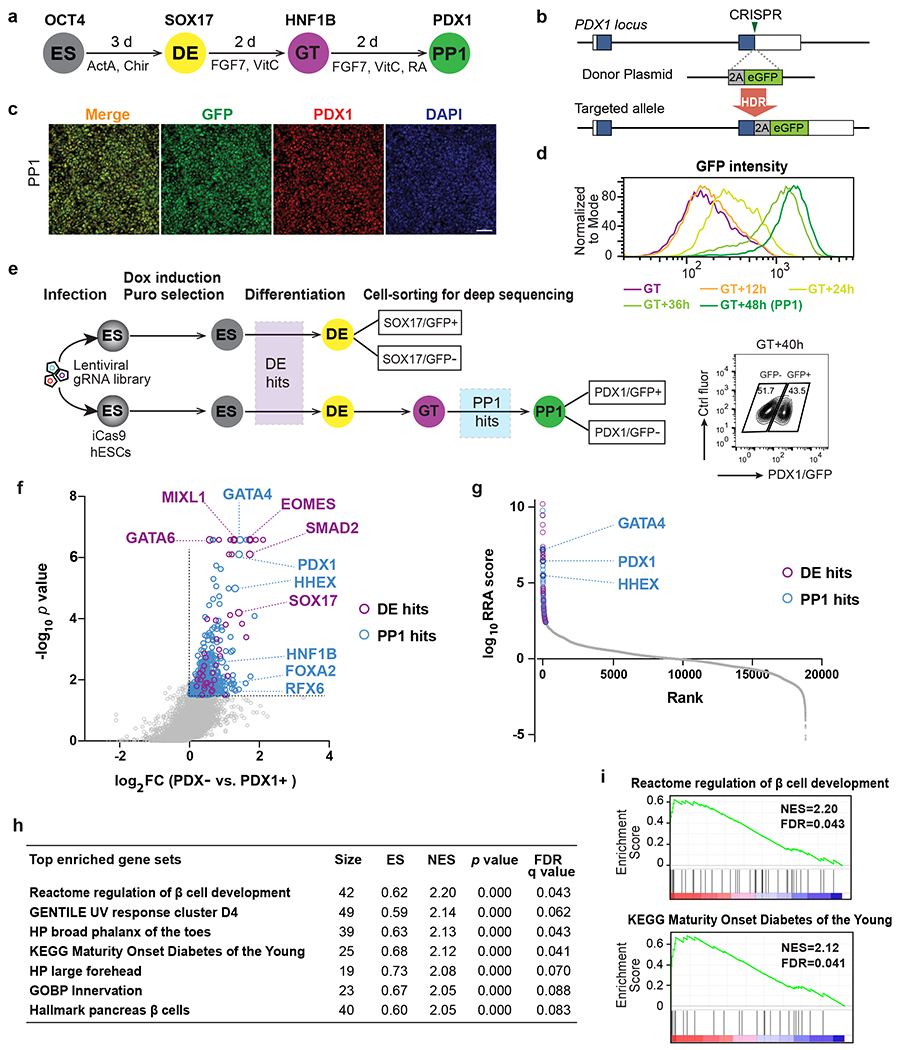
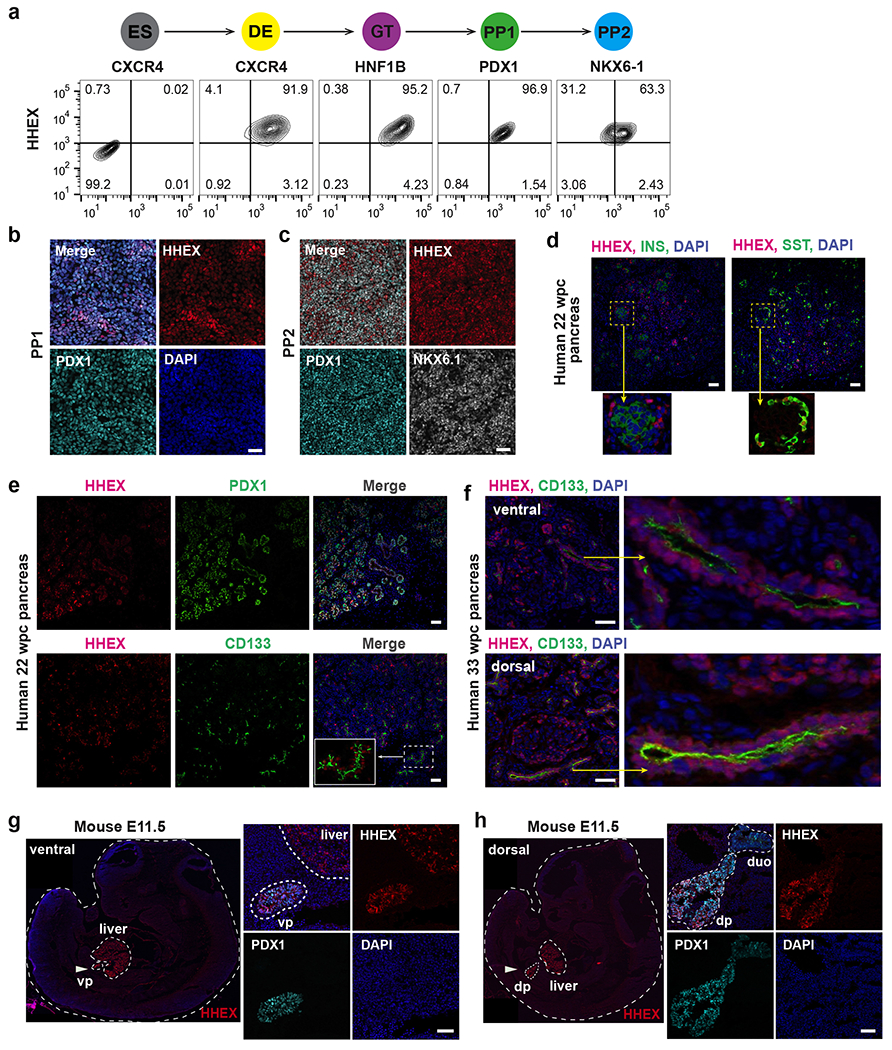
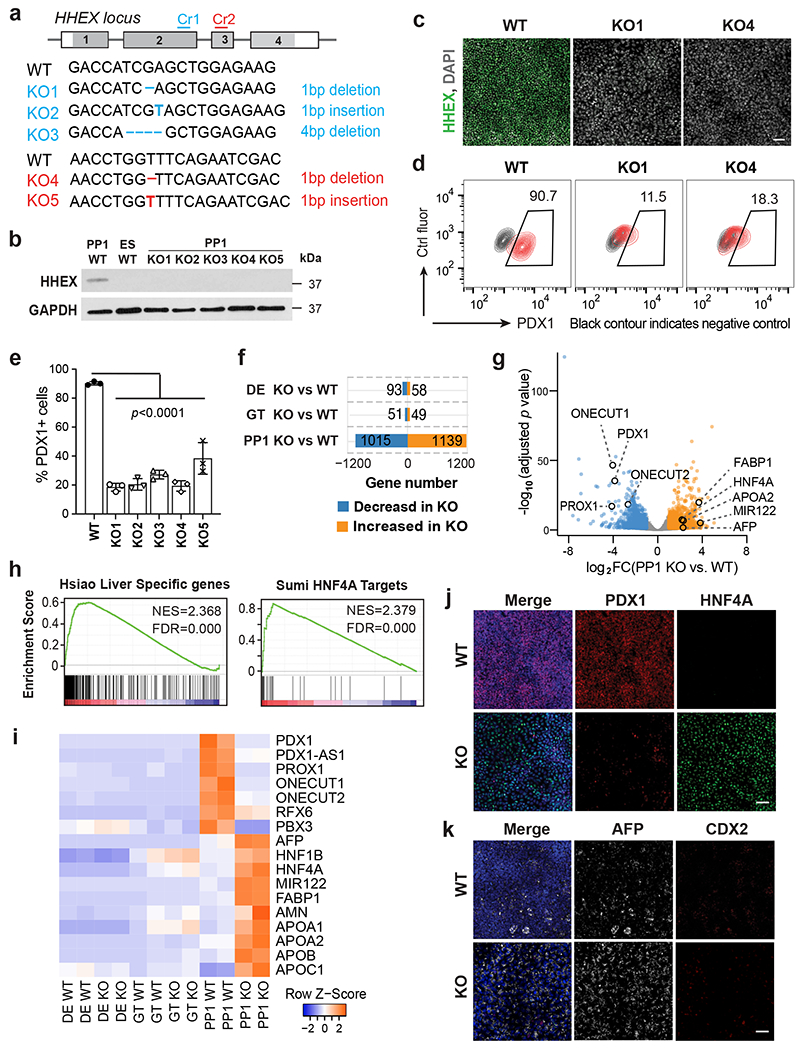
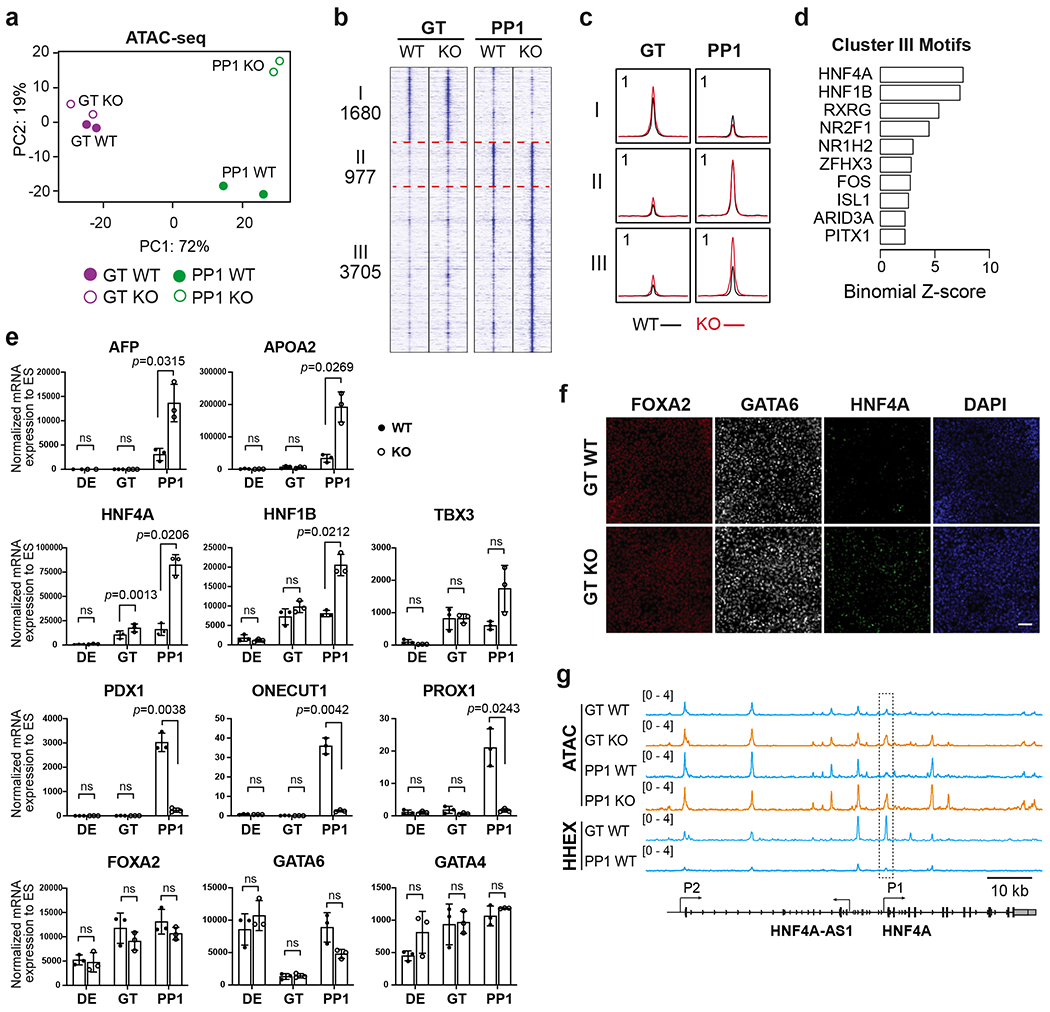
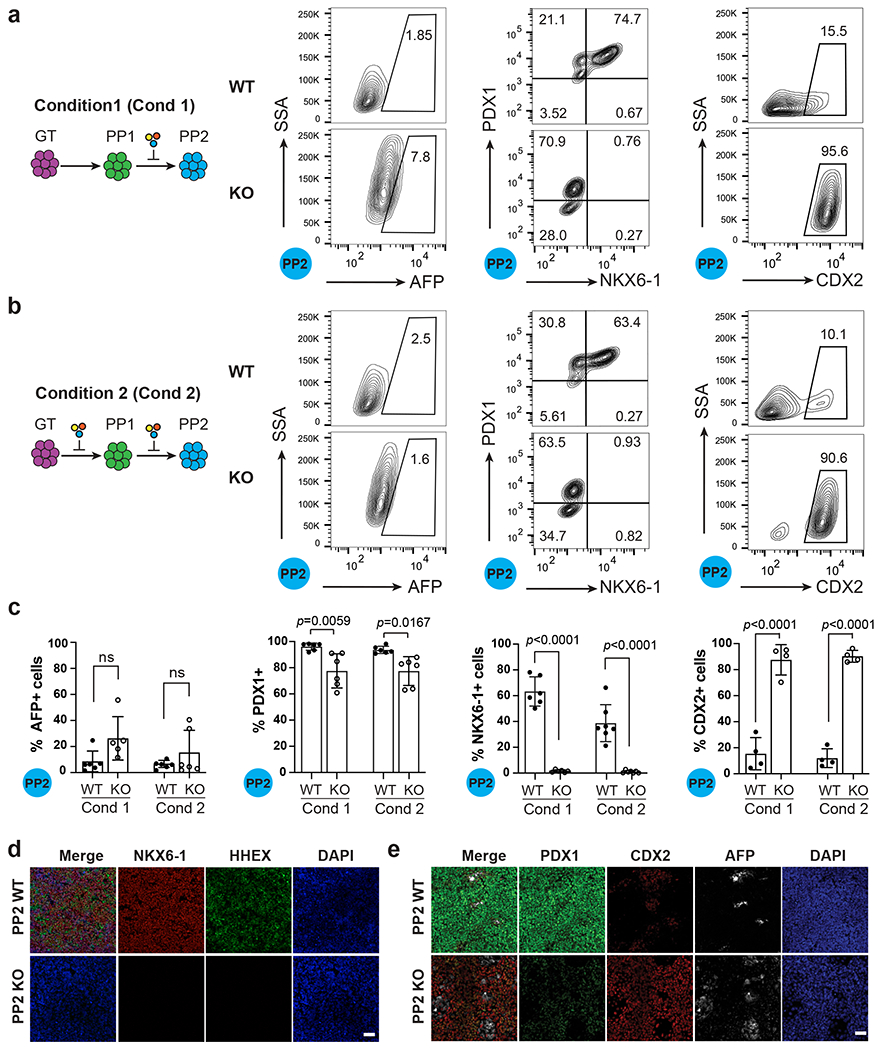
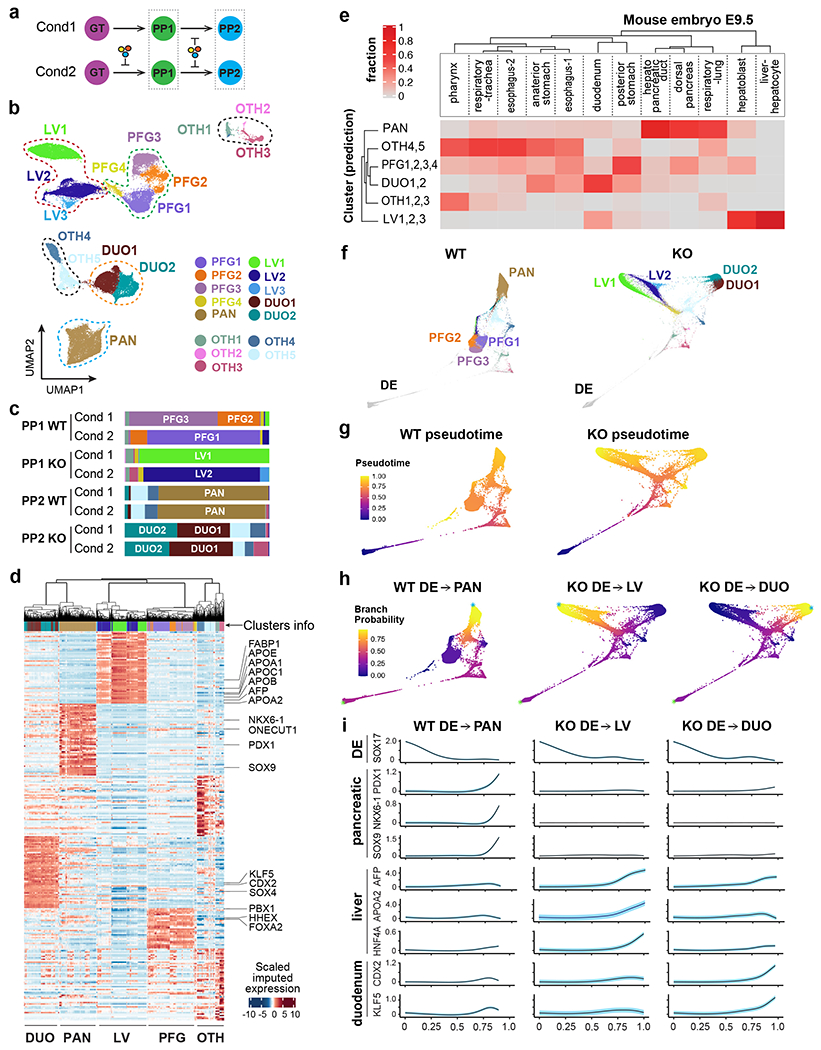
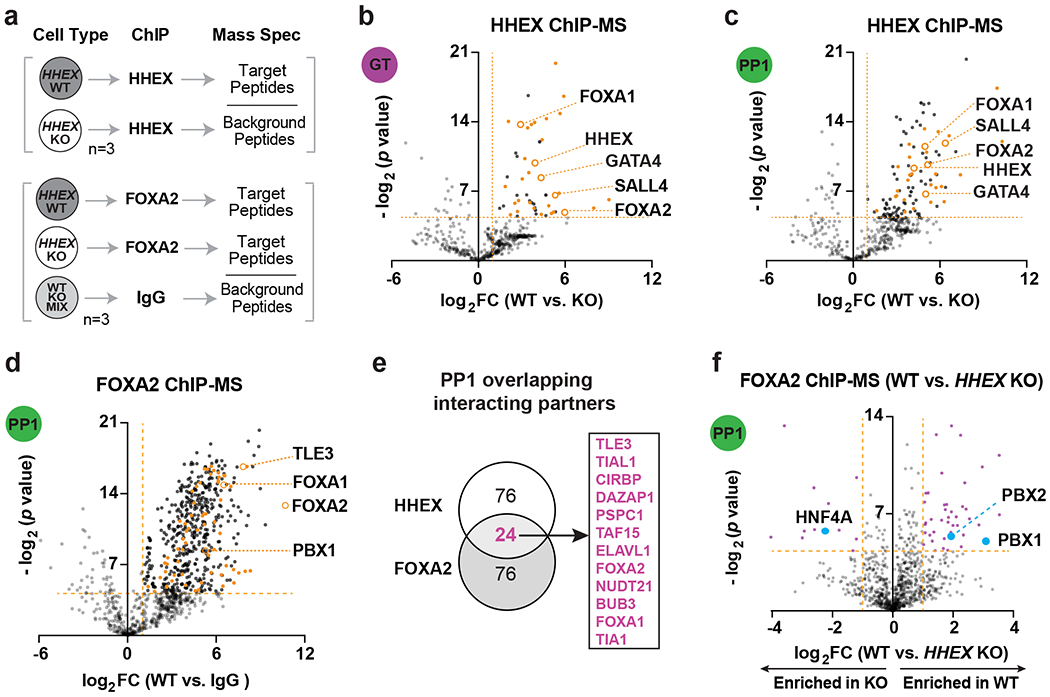
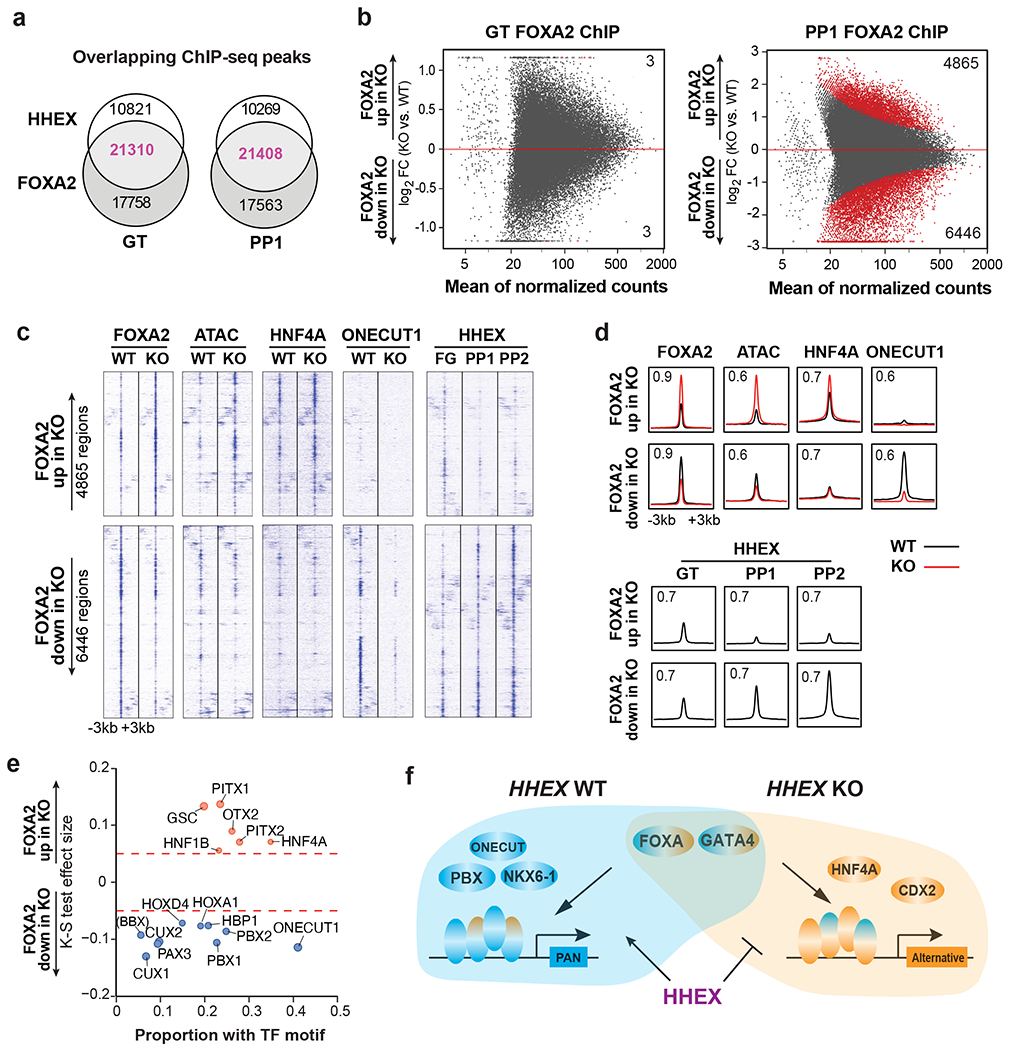
The pancreas and liver arise from a common pool of progenitors. However, the underlying mechanisms that drive their lineage diversification from the foregut endoderm are not fully understood. To tackle this question, we undertook a multifactorial approach that integrated human pluripotent-stem-cell-guided differentiation, genome-scale CRISPR-Cas9 screening, single-cell analysis, genomics and proteomics. We discovered that HHEX, a transcription factor (TF) widely recognized as a key regulator of liver development, acts as a gatekeeper of pancreatic lineage specification. HHEX deletion impaired pancreatic commitment and unleashed an unexpected degree of cellular plasticity towards the liver and duodenum fates. Mechanistically, HHEX cooperates with the pioneer TFs FOXA1, FOXA2 and GATA4, shared by both pancreas and liver differentiation programmes, to promote pancreas commitment, and this cooperation restrains the shared TFs from activating alternative lineages. These findings provide a generalizable model for how gatekeeper TFs like HHEX orchestrate lineage commitment and plasticity restriction in broad developmental contexts.


Conflict of interest statement

Competing interests

The authors declare no competing interests.

Figures

Extended Data Fig. 1
Extended Data Fig. 1. Analysis of HHEX expression and examination of HHEX KO cells through flow cytometry and RNA-seq.
a, Bar plots for HHEX, PDX1, NKX6-1, and AFP expression in human CS12-14 stages dorsal pancreatic bud (DP), hepatobiliary primordium (HBP), and hepatic cords (HC) based on a published study. n = 2 independent experiments. The y-axes represent the expression levels RPKM. b, Box plots for Hhex expression in Pdx1 cells sorted from ventral and dorsal pancreatic buds in E9.5 and E10.5 Pdx1-GFP mouse embryos based on a published study. The y-axe of the box plots represent the expression levels (log2(RPKM+1)). In each boxplot, the rectangle shows the inter-quartile range (IQR), with the bottom and top hinges representing the 25 and 75 percentiles, respectively. The middle line represents the median. The whiskers extend to the most extreme value within 1.5*IQR above or below the hinges. E9.5 dorsal Pdx1+ cells, n=31; E10.5 dorsal Pdx1+ cells, n=27; E9.5 ventral Pdx1+ cells, n=44; E10.5 ventral Pdx1+ cells, n=59. E9.5 and E10.5 data are generated from two and three independent mice, respectively. c,d, Flow cytometry gating strategy for HHEX expression. The SSC-A/FSC-A gate identifies cells based on the size and granularity. The FSC-H/FSC-W and SSC-H/SSC-W gates identify single cells. Live-dead staining distinguishes live cells from dead cells (c). HHEX KO cells were used as negative control for WT HHEX expression at the PP1 stage (d). e,f, Flow cytometry analysis of SOX17 and CXCR4 expression at the DE stage (e) and HNF1B expression at the GT stage (f). g,h, Quantification of flow cytometry analysis for SOX17, CXCR4 expression at the DE stage (g) and HNF1B expression at the GT stage (h). n = 3 independent experiments and data are presented as mean ± SD. i,j, Flow cytometry analysis (i) and quantification (j) of cleaved caspase-3 (C-CSP3) expression at the DE, GT and PP1 stage. n = 3 independent experiments and data are presented as mean ± SD. k, PCA based on PeakNorm normalization for all WT and KO samples during pancreatic differentiation. Two independent experiments were performed at each stage. Statistical analysis of g, h and j was performed using one-way ANOVA followed by Dunnett multiple comparisons test vs. the WT control.
Extended Data Fig. 2
Extended Data Fig. 2. Chromatin accessibility and transcriptional changes upon HHEX deletion.
a,b, Bar graph and volcano plot showing the number (a) and adjusted p value distribution (b) of differential peaks in KO cells compared to WT. Differential ATAC peaks were identified by DESeq2 using default parameters. FDR<0.05 are counted as one significant peak. Less accessible peaks in KO are marked in blue and more accessible peaks in KO in orange. The number of differential peaks is indicated. c,d, TF motif enrichment in cluster I (c) and II (d) regions. One-sided hypergeometric test was used to compare the enrichment of proportions of TF motifs for each cluster (foreground ratio) versus those for total atlas (background ratio). The horizontal axis shows the binomial Z-score, representing the number of standard deviations between the observed count of each cluster peaks containing a TF motif and the expected count based on the background ratio. The p values are provided in the Supplementary Table 3. e, IGV tracks (average of two independent experiments) show chromatin accessibility at representative liver genes loci identified in cluster III. Scale bar, 5 kb. f, Top 7 mouse phenotypes associated with the regulatory regions identified in cluster III. The term of mouse phenotypes was selected based on the binom rank and cutoffs of region fold enrich >1.4 and observed regions >80. g,h, Flow cytometry analysis (g) and quantification (h) of HNF4A+ cells at DE, GT, and PP1 stage. Each symbol represents one independent experiment (n = 4 independent experiments) and data are presented as mean ± SD. Statistical analysis was performed using unpaired two-tailed Student’s t-test. Data shown in a-f are from two independent experiments.
Extended Data Fig. 3
Extended Data Fig. 3. The effects of inhibiting liver differentiation on WT and HHEX KO cells.
a,b, Flow cytometry analysis of AFP, PDX1 and CDX2 expression at the PP1 and PP2 stage WT/KO cells using differentiation Condition 1 (a) and Condition 2 (b). c, Quantification of flow cytometry analysis of AFP+, PDX1+ and CDX2+ cells at the PP1 and PP2 stages in both conditions. Each symbol represents one independent experiment (n = 8 independent experiments, except for CDX2 staining, where n = 4 independent experiments) and data are presented as mean ± SD. Statistical analysis was performed using two-way ANOVA followed by multiple comparisons with Tukey correction. d, Immunostaining images for PDX1, AFP and CDX2 expression at the PP2 stage WT/KO cells using differentiation Condition 2. Images shown represent three independent experiments. Scale bar, 50 μm.
Extended Data Fig. 4
Extended Data Fig. 4. Investigation of differentiation trajectories in WT and HHEX KO cells through scRNA-seq analysis.
a, UMAP visualization of all Seurat clusters from experiment 2, shown with distinct colors. Clusters 1–15 were annotated as in Fig. 6b. b, UMAP visualization of the integrated data from all samples of both experiments at the DE, GT, PP1, and PP2 stages. The overlapping embedding of DE cells shows that the batch effect was removed. c, WT and KO lineages visualized by forced-directed layouts of the integrated data from the DE, GT, PP1, and PP2 stages. Cells at DE and GT stages are shown here. Data shown in a-c represent one independent experiments.
Extended Data Fig. 5:
Extended Data Fig. 5:. HHEX and FOXA2 ChIP-MS and ChIP-seq analysis.
a, Venn diagram of significantly enriched proteins at the GT and PP1 stages for HHEX ChIP-MS. b, GREAT Gene Ontology showing the top 7 biological process associated with the FOXA2-down regions. The term of mouse phenotypes was selected based on the binom rank and cutoffs of region fold enrich >1.5 and observed regions>80. c, IGV tracks (average of two independent experiments) to show chromatin accessibility and TFs binding activities at the PDX1 (left panel) and SOX9 (right panel) loci in WT and KO cells. Tracks are generated from two independent experiments. Scale bars was indicated. The regions showed significant decreasing of FOXA2 binding upon HHEX deletion were indicated. d, MA plot of significantly increased and decreased FOXA2 binding sites (blue color) at the PP2 stage upon HHEX deletion. The number of significantly increased and decreased FOXA2 binding sites is indicated. e, TF motifs enriched in the differential FOXA2 binding regions upon HHEX deletion. Significantly increased/decreased FOXA2 binding peaks were compared with the total atlas to examine the TF motif enrichments using the one-sided KS test. The KS test effect size is shown on the y axis, and the proportion of peaks associated with the TF motif is plotted on the x axis. The size of each circle represents the odds ratio, which was defined as the frequency of the TF in an opened or closed group divided by its frequency in the entire atlas. TF motifs with a KS test effect size ≥ 0.1 (indicated by the dashed lines) and odds ratio ≥ 1.2 are shown. f, Volcano plots of significantly enriched proteins (purple labeled) for FOXA2 ChIP-MS at the PP2 stage WT or KO cells. Dotted lines indicate the fold change and significance cutoffs. CDX2 (log2 FC = −2.01, p = 0.067) is also indicated. Data shown in a-e are from two independent experiments, and data shown in f represent three independent experiments.
Fig. 1:
Fig. 1:. CRISPR-Cas9 screens identify regulators of pancreatic differentiation.
a, Schematic of stepwise pancreatic differentiation protocol from hESCs. ES, embryonic stem cells; DE, definitive endoderm; GT, gut tube; PP1, early pancreatic progenitors. ActA (Actvin A); VitC (vitamin C); RA (retinoic acid). Lineage-specific markers were indicated. b, Strategy for generating the PDX1GFP/+ reporter cell line. In the presence of the donor plasmid, HDR results in the replacement of the PDX1 stop codon with 2A-eGFP. Boxes indicate PDX1 exons, and filled blue boxes indicate the coding sequence of PDX1. c, Immunofluorescence staining shows the co-expression of PDX1 and GFP at PP1 stage. Images shown represent three independent experiments. Scale bar, 50 μm. d, Histogram plots for live GFP expression from GT to PP1 stage. e, Schematic of sequential screening approach for regulators in pancreatic differentiation. Upper panel, screen schematic for DE formation using SOX17 GFP/+ reporter iCas9hESCs; Lower panel, screen schematic for pancreas induction using PDX1GFP/+ reporter iCas9hESCs. FACS plot shows the sorted information for PDX1/GFP+ and PDX1/GFP sub-populations. DOX, doxycycline; puro, puromycin. Ctrl fluor, control fluorescence. Each screen was conducted once with two technical repeats. f, Scatter plot of −log10 p value versus log2 fold change (FC) for all gRNA targeted genes in the PP1 screen. Each circle represents an individual gene. −log10 p >1.5 and log2 FC > 0 were used to identify PP1 hits (in blue), except that the purple circles indicate genes also identified as DE hits (p < 0.01 and log2 FC > 0 based on DE screening results). Selected DE and PP1 positive regulator hits are indicated. g, Each gene target in the screen ranked based on the MAGeCK robust ranking aggregation (RRA) score at the PP1 stage. Y axis represents log10 (PP1 positive score) – log10 (PP1 negative score). The top 200 genes are labeled with blue (PP1 specific) and purple circles (also identified as DE hits), respectively. Selected top PP1 hits are indicated. h, GSEA analysis showing the top gene sets that are associated with PP1 screening results. ES, enrichment score; NES, normalized enrichment score. i, GSEA enrichment plots of selected gene sets.
Fig. 2:
Fig. 2:. HHEX expression in early pancreas development.
a, Schematic of stepwise pancreatic differentiation from hESCs and flow cytometry analysis of HHEX and lineage-specific markers CXCR4 (DE), HNF1B (GT), PDX1 (PP1), and NKX6-1 (PP2) expression during WT hESCs pancreatic differentiation. ES cells are used as the negative control for HHEX expression. b,c, Immunofluorescence staining of HHEX, PDX1 (b,c), and NKX6-1 (c) at the PP1 and PP2 stage. Scale bar, 50 μm. d, Immunofluorescence staining of HHEX, INSULIN (INS), and SOMATOSTAIN (SST) in human pancreas at 22 wpc. Staining was performed in adjacent tissue sections. Inset represents a close-up view of HHEX, INS, and SST expression. Scale bar, 50 μm. e, Immunofluorescence staining of HHEX, PDX1, and CD133 in human pancreas at 22 wpc. Inset represents a close-up view showing co-expression of HHEX and CD133. Scale bar, 50 μm. Images shown in b-e represent three independent experiments. f, Immunofluorescence staining of HHEX and CD133 in ventrally derived “head” and dorsally derived “body/tail” pancreas from human pancreas at 33 wpc. Scale bar, 50 μm. g,h, Immunofluorescence staining of Hhex and Pdx1 in mice embryos at E11.5. vp, ventral pancreas; dp, dorsal pancreas, duo, duodenum; White arrow indicates the ventral pancreas (g) and dorsal pancreas (h). Scale bar, 50 μm. Images shown in f-h represent two independent experiments.
Fig. 3:
Fig. 3:. Deletion of HHEX impairs human pancreatic differentiation
a, Schematic illustrating HHEX targeting. CRISPR gRNA 1 and gRNA 2 (Cr1, Cr2) were designed and targeted at HHEX exon 2 and exon 3, respectively. The consequential homozygous mutations are summarized. Boxes indicate HHEX exons, and filled gray boxes indicate the coding sequence of HHEX. b,c, The loss of HHEX protein was verified by western blot (b) at the PP1 stage and immunofluorescence staining (c) at the DE stage. GAPDH was used as a loading control. Scale bar, 50 μm. d,e, Flow cytometry analysis (d) and quantification (e) for PDX1 expression at the PP1 stage. Each symbol represents one independent experiment (n = 3 independent experiments) and data are presented as mean ± SD. One-way ANOVA followed by Dunnett multiple comparisons test vs. WT control. f,g, Bar graph (f) and volcano plot (g) showing differentially expressed genes identified in KO cells vs. WT during pancreatic differentiation. Genes with log2 FC >1 and FDR <0 .05 are counted as one significant hit. Significantly up-regulated and down-regulated genes in the PP1 KO cells were labeled by orange and blue color, respectively. h, GSEA shows the enrichment of liver genes and HNF4A targets in PP1 KO cells vs. WT. i, Heatmap showing the expression of pancreatic and liver genes in WT and KO cells during pancreatic differentiation. j,k, Immunofluorescence staining of PDX1 and HNF4A (i), AFP and CDX2 (j) at the PP1 stage WT and KO cells. Scale bar, 50 μm. Images shown in b,c, j and k represent three independent experiments, and RNA-seq data shown in f-i are from two independent experiments.
Fig. 4:
Fig. 4:. HHEX deletion results in early induction of a liver-like transcriptional program.
a, PCA of top 3000 most variable genes in WT and HHEX KO cells at the GT and PP1 stages. b,c, Visualization of ATAC-seq profile at the GT and PP1 stages, patterned by hierarchical clustering of signal tracks (average of two independent experiments) around ATAC-seq peak summits ± 3 kb. (b), tornado plots. (c), metapeaks defined from the column average of the signal. The maximum value of each y axis is annotated in tags per million (TPM). d, Enrichment of top 10 TF motifs in the regulatory regions III. One-sided hypergeometric test was used to compare the enrichment of proportions of TF motifs for each cluster (foreground ratio) versus those for total atlas (background ratio). The horizontal axis shows the binomial Z-score, representing the number of standard deviations between the observed count of each cluster peaks containing a TF motif and the expected count based on the background ratio. The p values are provided in the Supplementary Table 3. e, The expression levels of pancreatic and liver genes in WT and KO cells were measured at the DE, GT, and PP1 stages. Each symbol represents one independent experiment (n = 3 independent experiments) and data are presented as mean ± SD. Statistical analysis was performed by paired two-tailed Student’s t-test KO vs. WT control. ns, not significant (p ≥ 0.05). f, Immunofluorescence staining of FOXA2, GATA6 and HNF4A at the GT stage WT and KO cells. Scale bar, 50 μm. Images shown represent three independent experiments. g, Integrative Genomics Viewer (IGV) tracks (average of two independent experiments) to show chromatin accessibility and HHEX binding activities at the HNF4A locus. The P1 promoter region of HNF4A showing significantly increased chromatin accessibility upon HHEX deletion was indicated. Scale bar, 10 kb. Data shown in a-d and g are from two independent experiments.
Fig. 5:
Fig. 5:. HHEX KO cells acquire duodenum-like cell state upon inhibition of liver differentiation.
a, Schematic showing the strategy of differentiation using Condition 1 (Cond 1) and flow cytometry analysis for AFP, PDX1, NKX6.1 and CDX2 expression under Condition 1 at the PP2 stage. Additional chemical cocktail was induced after the PP1 stage, a stage displaying ectopic liver genes expression in HHEX KO cells. b, Schematic showing the strategy of differentiation using Condition 2 (Cond 2) and flow cytometry analysis for AFP, PDX1, NKX6.1 and CDX2 expression under Condition 2 at the PP2 stage. Additional chemical cocktail was induced during both the PP1 and PP2 stage. c, Quantification of flow cytometry analysis of AFP+, PDX1+, NKX6-1+, and CDX2+ cells at the PP2 stage in both conditions. Each symbol represents one independent experiment (n = 6 independent experiments, except for CDX2 staining, where n = 4 independent experiments) and data are presented as mean ± SD. Statistical analysis was performed using two-way ANOVA followed by multiple comparisons with Tukey correction. d, Immunostaining images for HHEX, PDX1 and NKX6-1 expression at the PP2 stage WT/KO cells using differentiation Condition 1. Scale bar, 50 μm. e, Immunostaining images for PDX1, CDX2, AFP expression at the PP2 stage WT/KO cells using differentiation Condition 1. Images shown in d and e represent three independent experiments. Scale bar, 50 μm.
Fig. 6:
Fig. 6:. scRNA-seq reveals differentiation trajectories of WT and HHEX KO cells.
a, Schematic of single cell transcriptome profiling of WT and KO cells at PP1/PP2 stages from two differentiation conditions (one biological replicate per condition). b, UMAP visualization of the main PP1/PP2 populations. Seurat clusters 1-15, shown with distinct colors, were annotated and grouped based on known markers. c, Bar plots illustrating the composition of each sample across the clusters in (b). The stacks show fractions per sample. d, Heatmap reporting MAGIC-imputed expression values (standardized per gene) of the top 50 differentially expressed genes for each group, as annotated in (b). Significant genes (FC > 1.5 and adjusted p < 0.05) were selected by comparing each group to the rest using MAST. e, Heatmap reporting the fraction of E9.5 mouse endoderm-derived populations mapping to in vitro-derived human populations from (b). The sum of values in each column equals 1. f, WT and KO lineages visualized by forced-directed layouts of the integrated data from the DE, GT, PP1, and PP2 stages. PP1/PP2 populations were annotated as in (b). g, h, The pseudotime ordering (g) and branch probabilities (h) of selected WT or KO differentiation trajectories. A DE cell was selected as the start of each trajectory (indicated by green asterisks), and the terminal points (indicated by blue asterisks) were identified by Palantir. i, The trends of gene expression along the pseudotime of trajectories in (g,h). The highlights show ± standard error.
Fig. 7:
Fig. 7:. HHEX cooperates with FOXA2 to safeguard pancreatic differentiation.
a, Schematic of ChIP-MS experiments. b,c, Volcano plots of identified and overlapping proteins (orange labeled) for HHEX ChIP-MS at the GT(b) and PP1 (c) stages. Dotted lines indicate the cutoffs (log2 FC > 1, −log2 p > 4.32) for significantly enriched proteins. TFs that are significantly enriched at both stages are indicated with orange circles. d, Volcano plots of significantly enriched proteins for FOXA2 ChIP-MS at the PP1 WT cells. Dotted lines indicate the significance cutoffs (log2 FC > 1, −log2 p > 4.32). Overlapping proteins that are enriched in both HHEX and FOXA2 ChIP-MS are orange labeled. TFs that are enriched in both HHEX and FOXA2 ChIP-MS are indicated. e, Venn diagram of top 100 significantly enriched proteins (−log2 p > 4.32, top 100 hits were ranked based on log2 FC) at the PP1 stage in HHEX and FOXA2 ChIP-MS. Representative overlapping interacting hits were indicated in the box. f, Volcano plots of significantly enriched proteins (purple labeled) for FOXA2 ChIP-MS at the PP1 stage WT or KO cells. Dotted lines indicate the significance cutoffs (log2 FC > 1, −log2 p > 4.32) for significantly enriched proteins. ChIP-MS data shown in b-f are generated from three independent experiments.
Fig. 8:
Fig. 8:. HHEX protects FOXA2 binding to pancreatic regulatory regions.
a, Venn diagram representing the number of co-bound regions identified in HHEX and FOXA2 ChIP-seq at the GT and PP1 stage WT cells. b, MA plot of significantly increased and decreased FOXA2 binding sites (red color) at the GT and PP1 stages upon HHEX deletion. The number of significantly increased and decreased FOXA2 binding sites is indicated. c,d, Genomic visualization of loci associated with the significantly increased and decreased activity of FOXA2 binding in KO cells versus WT. ChIP-seq of FOXA2, HNF4A, and ONECUT1 at the PP1 stage were shown, and ATAC-seq was visualized at the same regions. HHEX ChIP-seq was shown for GT, PP1, and PP2 WT. (c), tornado plots. (d), metapeaks, from the column average of the signal. The maximum value of each y axis is annotated in TPM. Plots represent the average of two independent experiments. e, TF motifs enriched in the differential FOXA2 binding regions upon HHEX deletion. Significantly increased/decreased FOXA2 binding peaks were compared with the total atlas to examine the TF motif enrichments using the one-sided Kolmogorov-Smirnov (KS) test. The KS test effect size is shown on the y axis, and the proportion of peaks associated with the TF motif is plotted on the x axis. The size of each circle represents the odds ratio, which was defined as the frequency of the TF in an opened or closed group divided by its frequency in the entire atlas. TF motifs with a KS test effect size ≥ 0.05 (indicated by the dashed lines) and odds ratio ≥ 1.2 are shown. f, Schematic illustrating HHEX interaction with FOXA2 and other TFs in pancreatic differentiation conditions. Data shown in a-e are from two independent experiments.

References

    1. Zaret KS & Grompe M Generation and regeneration of cells of the liver and pancreas. Science 322, 1490–4 (2008). - PMC - PubMed
    1. Willnow D et al. Quantitative lineage analysis identifies a hepato-pancreato-biliary progenitor niche. Nature 597, 87–91 (2021). - PubMed
    1. Puri S, Folias AE & Hebrok M Plasticity and dedifferentiation within the pancreas: development, homeostasis, and disease. Cell Stem Cell 16, 18–31 (2015). - PMC - PubMed
    1. Yuan S, Norgard RJ & Stanger BZ Cellular Plasticity in Cancer. Cancer Discov 9, 837–851 (2019). - PMC - PubMed
    1. Tata PR et al. Developmental History Provides a Roadmap for the Emergence of Tumor Plasticity. Dev Cell 44, 679–693 e5 (2018). - PMC - PubMed

Publication types