. 2022 Jul 15;9(4):ENEURO.0475-21.2022.
doi: 10.1523/ENEURO.0475-21.2022. Print 2022 Jul-Aug.

Differential Effects of the G-Protein-Coupled Estrogen Receptor (GPER) on Rat Embryonic (E18) Hippocampal and Cortical Neurons

Affiliations

Differential Effects of the G-Protein-Coupled Estrogen Receptor (GPER) on Rat Embryonic (E18) Hippocampal and Cortical Neurons

Kyle Pemberton et al. eNeuro. .

Abstract

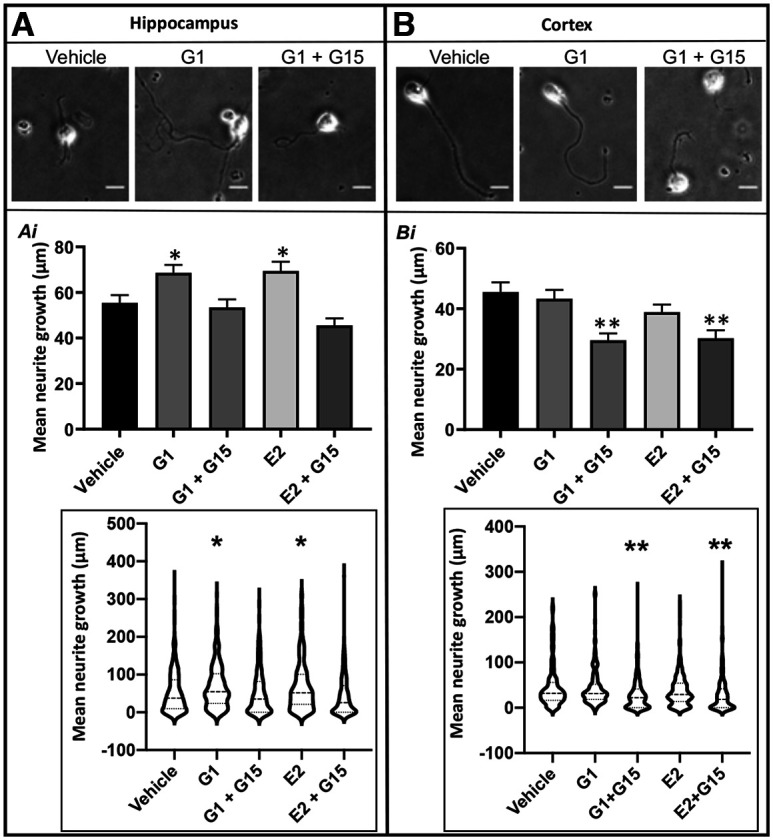
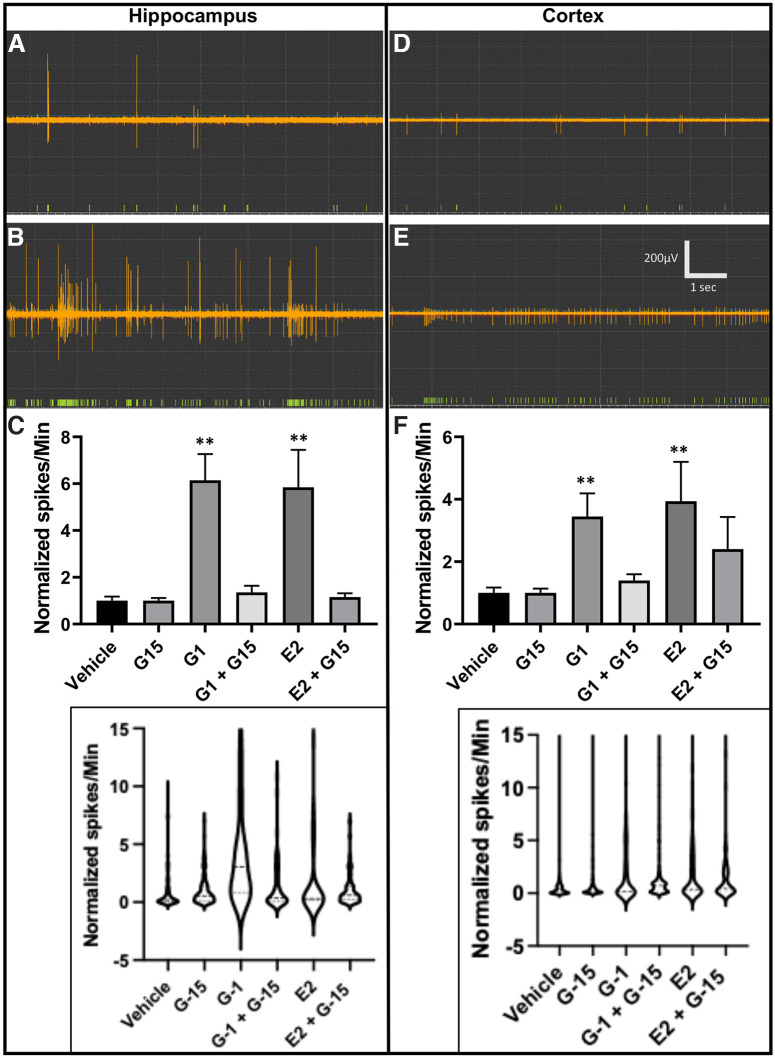
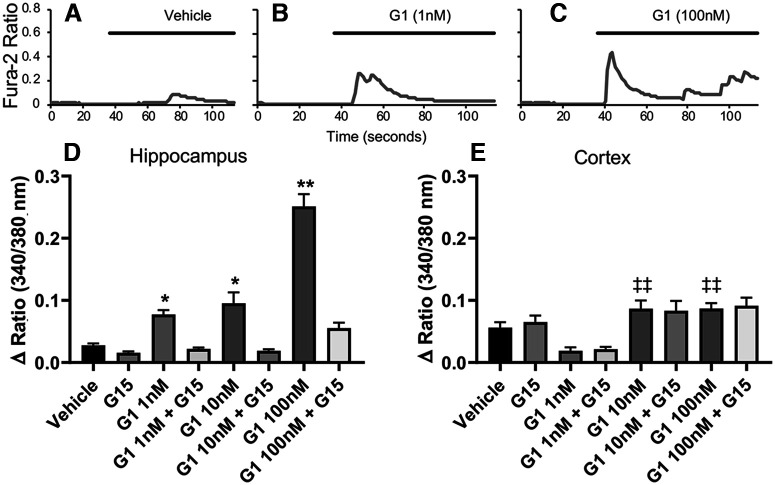
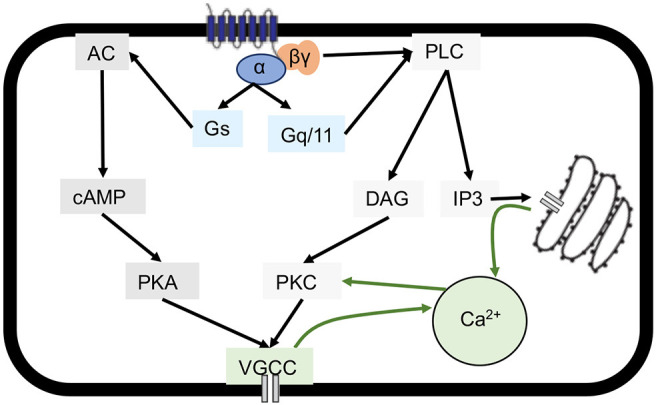
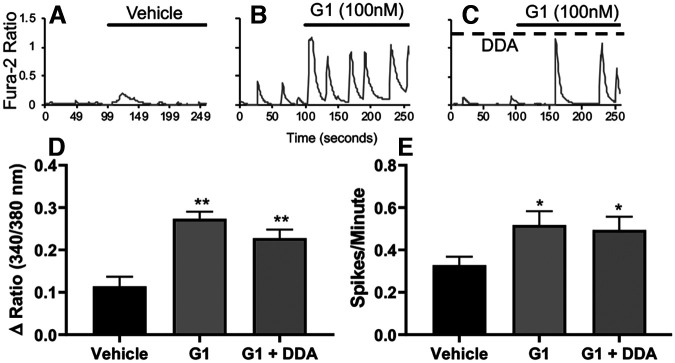
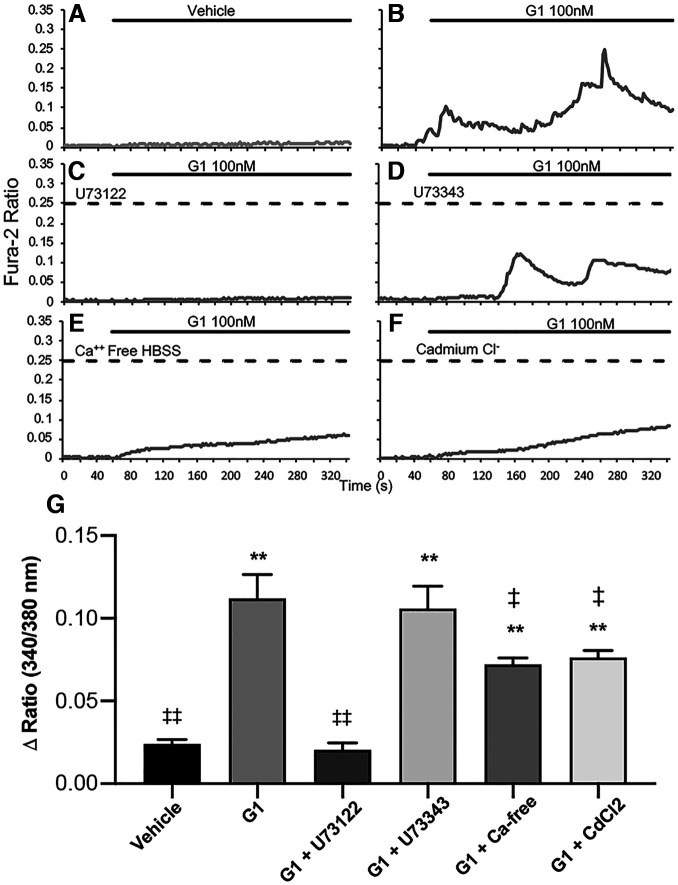
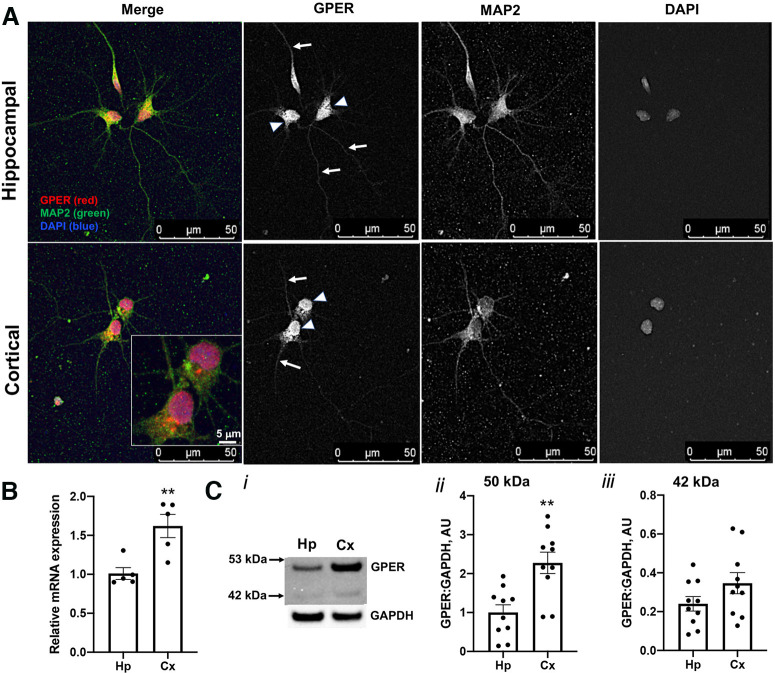
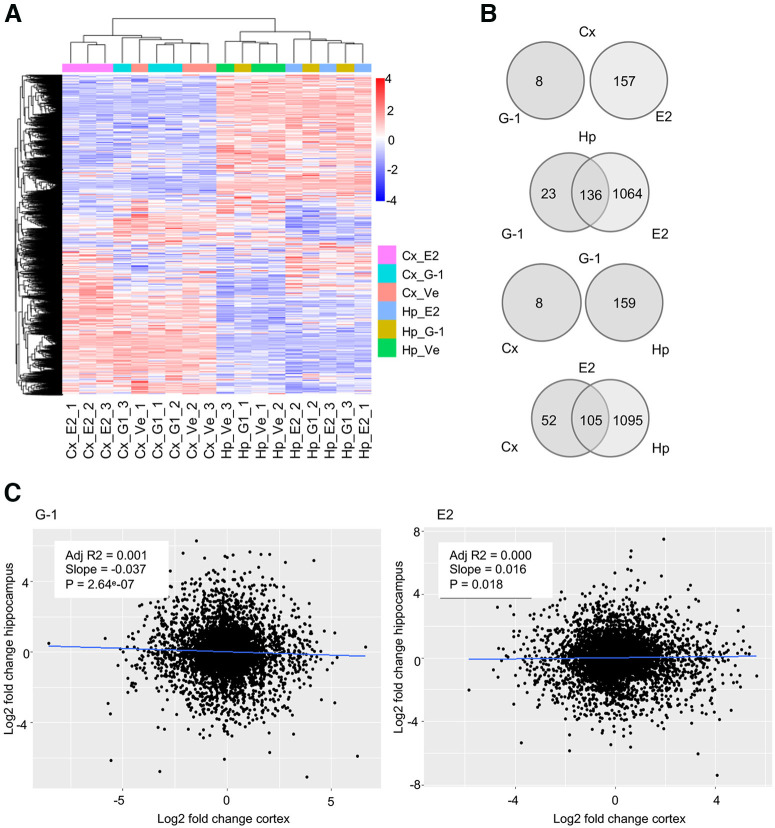
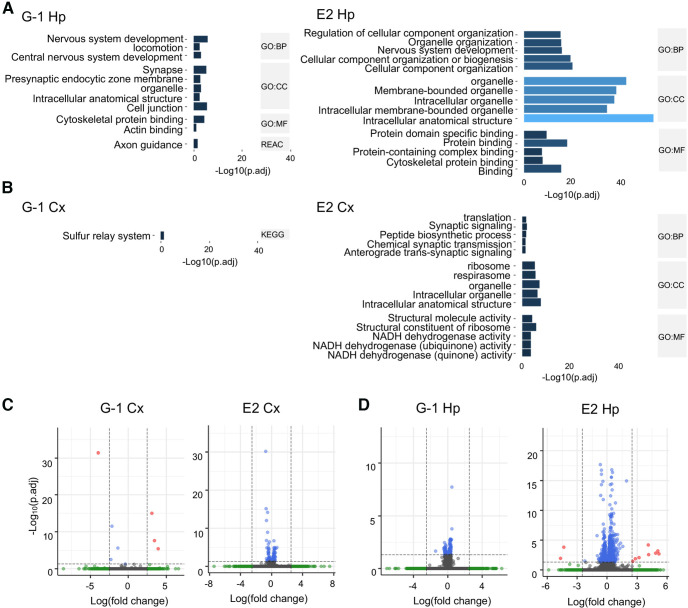
Estrogen plays fundamental roles in nervous system development and function. Traditional studies examining the effect of estrogen in the brain have focused on the nuclear estrogen receptors (ERs), ERα and ERβ. Studies related to the extranuclear, membrane-bound G-protein-coupled ER (GPER/GPR30) have revealed a neuroprotective role for GPER in mature neurons. In this study, we investigated the differential effects of GPER activation in primary rat embryonic day 18 (E18) hippocampal and cortical neurons. Microscopy imaging, multielectrode array (MEA), and Ca2+ imaging experiments revealed that GPER activation with selective agonist, G-1, and nonselective agonist, 17β-estradiol (E2), increased neural growth, neural firing activity, and intracellular Ca2+ more profoundly in hippocampal neurons than in cortical neurons. The GPER-mediated Ca2+ rise in hippocampal neurons involves internal Ca2+ store release via activation of phospholipase C (PLC) and extracellular entry via Ca2+ channels. Immunocytochemistry results revealed no observable difference in GPER expression/localization in neurons, yet real-time qPCR (RT-qPCR) and Western blotting showed a higher GPER expression in the cortex than hippocampus, implying that GPER expression level may not fully account for its robust physiological effects in hippocampal neurons. We used RNA sequencing data to identify distinctly enriched pathways and significantly expressed genes in response to G-1 or E2 in cultured rat E18 hippocampal and cortical neurons. In summary, the identification of differential effects of GPER activation on hippocampal and cortical neurons in the brain and the determination of key genes and molecular pathways are instrumental toward an understanding of estrogen's action in early neuronal development.

Keywords: G-protein-coupled estrogen receptor (GPER/GPR30); electrophysiology; estrogen; hippocampus; neurodevelopment; transcriptome.


Figures

Figure 1.
Figure 1.
GPER activation increases neurite outgrowth in hippocampal but not cortical neurons. Selected images and results of hippocampal (A) and cortical (B) neurite outgrowth after 72 HIC. Ai, Hippocampal neurons showed an increase in outgrowth compared with vehicle when GPER is activated with the selective agonist G-1 as well as with the nonspecific agonist E2. This effect was inhibited by the GPER-specific antagonist G-15. Bi, Cortical neurons showed no significant effect of GPER activation on neurite outgrowth using either G-1 or E2 compared with vehicle control. Cortical neurite outgrowth was inhibited by blocking GPER activation using G-15. Significance was determined using two–way ANOVA followed by Dunnett’s test for multiple comparisons (hippocampal, F(7,2527) = 10.73, p < 0.001, mean n = 223 cells; cortical, F(7,1757) = 8.19, p < 0.001, mean n = 298 cells). Insets, Violin plot representation of the same datasets as shown in bar graphs. Statistical data of GPER activation/inactivation on hippocampal and cortical neurite outgrowth at all time points from 8 to 96 h are shown in Extended Data Figure 1-1. Data were from three independent experiments; **p <0.01 and *p <0.05, compared with vehicle. Scale bar: 20 μm. Treatments: G-1 (100 nm), E2 (100 nm), G-15 (10 nm).
Figure 2.
Figure 2.
GPER activation increases neuronal firing activity in hippocampal and cortical neurons. Representative readings from hippocampal (A, B) and cortical (D, E) neurons show a much lower frequency of spikes (green bars) before the introduction of G-1 (A, D) compared with the number of spikes after GPER activation using G-1 (B, E). Statistical data (C, F) show that both the selective GPER agonist G-1 and nonspecific agonist E2 significantly increase the frequency of neuronal firing activity in hippocampal and cortical neurons cultured for 14 d (values normalized to the response before introduction of the drug as a value of 1). This significant increase in spiking activity from both G-1 and E2 is inhibited by the pretreatment with GPER-specific antagonist G-15 (C, F). Hippocampus one-way ANOVA, G-1, E2 F = 14.28, p <0.001, n =60; cortex one-way ANOVA, G-1, E2 F = 4.66, p <0.001, n =180; **p < 0.01, compared with vehicle. Treatments: G-1 (100 nm), E2 (100 nm), G-15 (10 nm). Insets, Violin plot representation of the same datasets as shown in bar graphs.
Figure 3.
Figure 3.
GPER activation increases cytosolic Ca2+ in hippocampal but not cortical neurons. Fura-2 ratiometric Ca2+ traces of hippocampal neurons (A–C) showed a dose-dependent increase in Ca2+ response to GPER-selective agonist G-1. Vehicle (A) showed little to no Ca2+ response while 1 nm G-1 (B) showed a significant increase in Ca2+ response, and 100 nm G-1 (C) showed the greatest increase in Ca2+. D, Mean values of peak amplitude of Ca2+ increase in hippocampal neurons (one-way ANOVA F = 80.97, n =92, Turkey’s post hoc analysis 1 nm G-1 p =0.036, 10 nm G-1 p =0.031, 100 nm G-1 p <0.001). These effects were blocked by 10 nM G-15. E, In cortical neurons, GPER activation lowered levels of Ca2+ at 1 nm G-1 while increasing Ca2+ at higher concentrations of G-1, although these did not reach significance (G-1 1 nm p =0.20, G-1 10 nm p =0.64, G-1 100 nm p =0.45). These effects were not blocked by G-15; *p <0.05, **p <0.01, compared with vehicle; ‡‡p <0.01, compared with G-1 1 nm.
Figure 4.
Figure 4.
Representative model of common GPCR signaling pathways leading to an increase in cytosolic Ca2+. Different GPCR pathways can converge to an increase in intracellular Ca2+ levels. Gs subunit coupling leads to the activation of AC that increases cAMP levels and promotes the activity of PKA. PKA leads to the opening of VGCCs and, therefore, extracellular Ca2+ entry via VGCCs. Gq/11 subunit coupling leads to the activation of PLC which catalyzes the production of DAG and IP3. IP3 can then bind to IP3 receptor-gated Ca2+ channels present on the endoplasmic reticulum, leading to Ca2+ release from intracellular stores. The subsequent rise in intracellular Ca2+, together with DAG, activates PKC which causes the opening of VGCCs. The βγ dimer of G-proteins has also been shown to activate PLC or directly regulate VGCCs and lead to an increase in cytosolic Ca2+.
Figure 5.
Figure 5.
GPER- induced Ca2+ rise is not dependent on cAMP production. A–C, Representative traces of fura-2 ratiometric Ca2+ imaging for vehicle (A), G1 alone (B), and G1 with selective inhibitor of AC DDA (10 μm; C). Statistical data demonstrate that G-1 still significantly increased both the mean values of peak amplitude of Ca2+ increase (D) and the mean frequency of Ca2+ spiking activity (E) when cAMP production is inhibited by DDA (G-1 p <0.001, n =131, DDA + G-1 p <0.001, n =138, vehicle n = 90); *p < 0.05 and **p < 0.01, compared with vehicle.
Figure 6.
Figure 6.
GPER-induced Ca2+ rise in hippocampal neurons involves both extracellular Ca2+ entry via VGCCs and PLC-mediated internal Ca2+store release. A–F, Representative traces of ratiometric Ca2+ imaging in vehicle (A), G-1 alone (B), G-1 plus PLC inhibitor (U73122, 10 μM; C), G-1 plus the inactive analog of the PLC inhibitor (U73343, 10 μM; D), G-1 in Ca2+-free buffer (E), and G-1 plus 100 μM cadmium Cl- (CdCl2), a nonspecific blocker of VGCCs (F). G, Statistical data show that GPER-induced increase in intracellular Ca2+ is blocked fully by inhibition of IP3 production (U73122 p =0.999 vs vehicle, p <0.01 vs G-1), but only partially, yet significantly, inhibited by removal of external Ca2+ ions (Ca2+-free; p <0.05 vs G-1) or by blocking of Ca2+ entry with CdCl2 (p <0.05 vs G-1); **p <0.01 versus vehicle, ‡p <0.05 versus G-1, ‡‡p <0.01 versus G-1.
Figure 7.
Figure 7.
Studies of GPER expression in hippocampal and cortical cultures and tissues. GPER expression and localization in cultured hippocampal and cortical neurons 72 HIC were measured using immunofluorescent and confocal microscopy techniques. A, Representative fluorescence images showing the localization of GPER (red) in cell bodies (arrowheads) and neurites (arrows). Cell nuclei are labeled with DAPI (blue) and neurites are labeled with MAP2 (green). B, RT-qPCR measurement of the relative GPER mRNA level in samples derived from hippocampal and cortical culture at 72 HIC shows a significantly (unpaired Student’s t test, p < 0.01, n = 5 replicates) higher GPER mRNA level in cortical than hippocampal cultures. C, Western blot measurements of GPER protein expression in ex vivo hippocampal and cortical tissues from individual E18 rat brains (n = 10) reveals two protein species with mass sizes of ∼50 and 42 kDa (i). Statistical analysis shows that expression of GPER ∼50 kDa is significantly higher in cortical than in hippocampal tissues (ii), while GPER ∼42 kDa is slightly, but not significantly, higher in cortical than in hippocampal tissues (iii). Unpaired Student’s t test; **p < 0.01. The specificity of the GPER antibody used for this study was validated by immunocytochemistry and Western blotting. The validation results are shown in Extended Data Figure 7-1.
Figure 8.
Figure 8.
RNA sequencing data show different transcriptome changes in hippocampal versus cortical cultures after G-1 or E2 treatment. RNA sequencing was performed on hippocampal or cortical cultures treated with vehicle, G-1 (100 nm), or E2 (100 nm) for 72 h: a total of 18,749 genes were identified (n =3 for each group). A, Heatmap showing the differential expression of genes in cortical (Cx) compared with hippocampal (Hp) cultures. The hierarchical clustering of the log2(fpkm + 1) values shows the separation of transcriptome between cortical and hippocampal cultures. Furthermore, the clustering reveals that in cortical cultures, G-1 treatment has little to no effect, clustering with vehicle, while in hippocampal cultures, both G-1 and E2 treatment are separated from vehicle. B, Venn diagrams showing the overlap of significantly regulated genes among different primary cultures or treatments. In cortical samples, eight genes were significantly regulated by G-1 and 157 by E2 compared with the vehicle (p <0.005, FDR adjusted p-value) with no overlap between the treatments, indicating that in cortical cultures G-1 and E2 significantly regulate two distinct sets of genes. In hippocampal samples, 159 genes were significantly regulated by G-1 and 1200 by E2 compared with the vehicle (p <0.005, FDR adjusted p-value), and ∼85% (136 out of 159) of genes significantly regulated by G1 are also significantly regulated by E2 treatment. Moreover, there is no overlap between cortical and hippocampal cultures treated with G-1, while E2 significantly regulates 105 genes in both cultures. C, Correlation plots show no correlation among cortical and hippocampal genes’ log2 fold change compared with vehicle after treatment with either G-1 or E2.
Figure 9.
Figure 9.
Pathway enrichment and correlation analysis show that GPER activation leads to specific changes in gene expression in hippocampal versus cortical neurons. A, B, Pathway enrichment analysis shows different enrichment of hippocampal (Hp) or cortical (Cx) samples after G-1 (100 nM) and E2 (100 nM) treatment. Only the top five significant enrichment terms ranked by p-value are shown (-Log10 adj. p > 1.3). A, In hippocampal cultures, both G-1 and E2 are enriched for genes involved in nervous system development (GO:BP G-1, adj. p = 1.2e-06; E2, adj. p = 1.47e-16). Moreover, G-1 treatment shows enrichment for synapse (GO:CC, adj. p = 5.77e-06), cytoskeletal protein binding (GO:MF, adj. p = 4.01e-05) and axon guidance (KEGG, adj. p = 0.023). E2 treatment shows enrichment for organelle (GO:CC, adj. p = 2.32e-43) and protein binding (GO:MF, adj. p = 9.74e-19). B, Transcriptome data from cortical cultures treated with G-1 show almost no enrichment, with only one significant GO term (KEGG: sulfur relay system). E2 treatment shows significant enrichment for synaptic signaling (GO:BP synaptic signaling, adj. p = 0.018; chemical synaptic transmission, adj. p = 0.047), ribosome (GO:CC, adj. p = 9.12e-06), and NADH dehydrogenase activity (GO:MF NADH dehydrogenase activity, adj. p = 0.0004). C, D, Volcano plots showing differentially expressed genes. The dashed line shows the p <0.05 cutoff (FDR adjusted p-value). Genes are represented as dots color-coded in gray (not significant, below log2 fold change threshold), green (above log2 fold change threshold > |2.5|), blue (significant, FRD adj. p < 0.05), and red (significant and above the log2 fold change threshold). The top DE genes in hippocampal and cortical cultures regulated by either G1 or E2 are provided in Extended Data Figures 9-1 (hippocampal) and 9-2 (cortical).

Similar articles

Cited by

References

    1. Altmann JB, Yan G, Meeks JF, Abood ME, Brailoiu E, Brailoiu GC (2015) G protein-coupled estrogen receptor-mediated effects on cytosolic calcium and nanomechanics in brain microvascular endothelial cells. J Neurochem 133:629–639. 10.1111/jnc.13066 - DOI - PMC - PubMed
    1. Altun H, Kurutas EB, Sahin N, Sinir H, Findikli E (2017) Decreased levels of G protein-coupled estrogen receptor in children with autism spectrum disorders. Psychiatry Res 257:67–71. 10.1016/j.psychres.2017.06.008 - DOI - PubMed
    1. Amendola J, Woodhouse A, Martin-Eauclaire MF, Goaillard JM (2012) Ca(2)(+)/cAMP-sensitive covariation of I(A) and I(H) voltage dependences tunes rebound firing in dopaminergic neurons. J Neurosci 32:2166–2181. 10.1523/JNEUROSCI.5297-11.2012 - DOI - PMC - PubMed
    1. Azcoitia I, Yague JG, Garcia-Segura LM (2011) Estradiol synthesis within the human brain. Neuroscience 191:139–147. 10.1016/j.neuroscience.2011.02.012 - DOI - PubMed
    1. Bahrami F, Janahmadi M (2013) Antibiotic supplements affect electrophysiological properties and excitability of rat hippocampal pyramidal neurons in primary culture. Iran Biomed J 17:101–106. 10.6091/ibj.11242.2013 - DOI - PMC - PubMed

Publication types

LinkOut - more resources