. 2022 Aug 15;132(16):e153619.
doi: 10.1172/JCI153619.

The NCF1 variant p.R90H aggravates autoimmunity by facilitating the activation of plasmacytoid dendritic cells

Affiliations

The NCF1 variant p.R90H aggravates autoimmunity by facilitating the activation of plasmacytoid dendritic cells

Yao Meng et al. J Clin Invest. .

Abstract

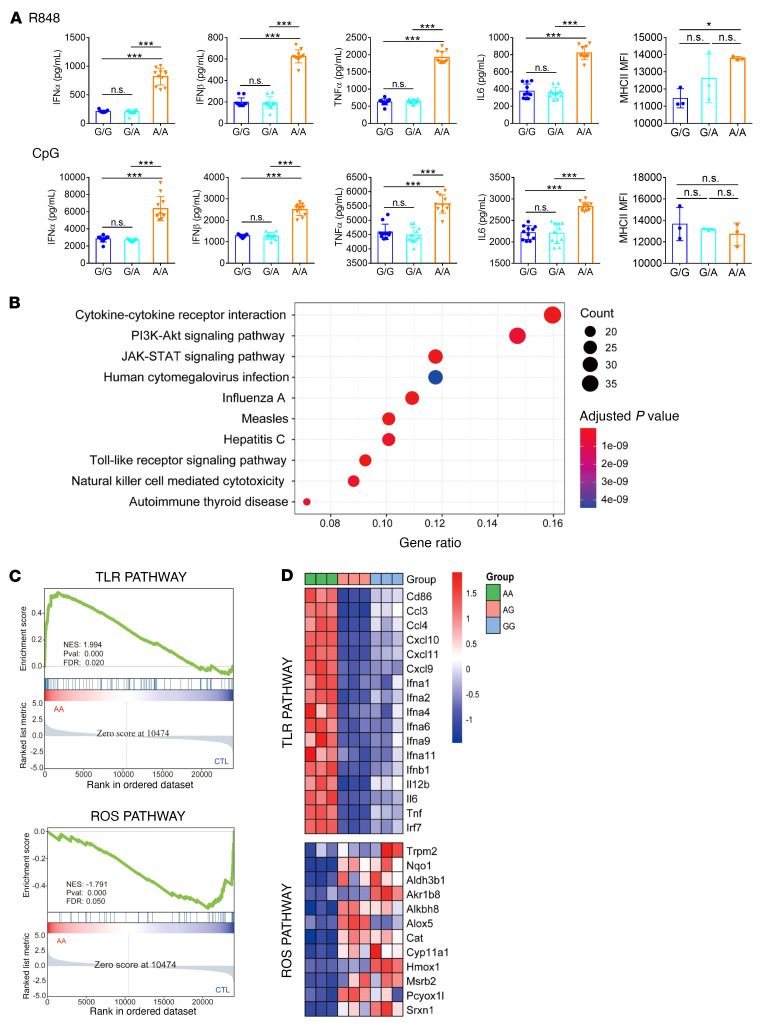
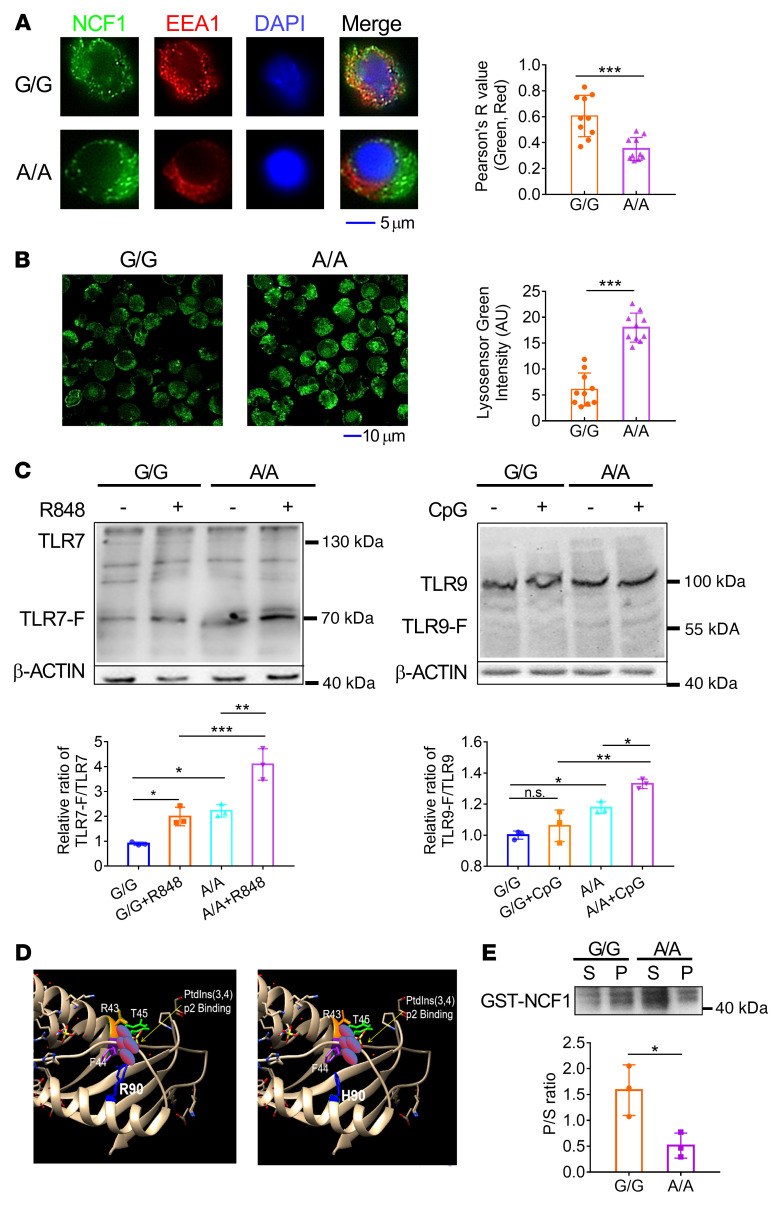
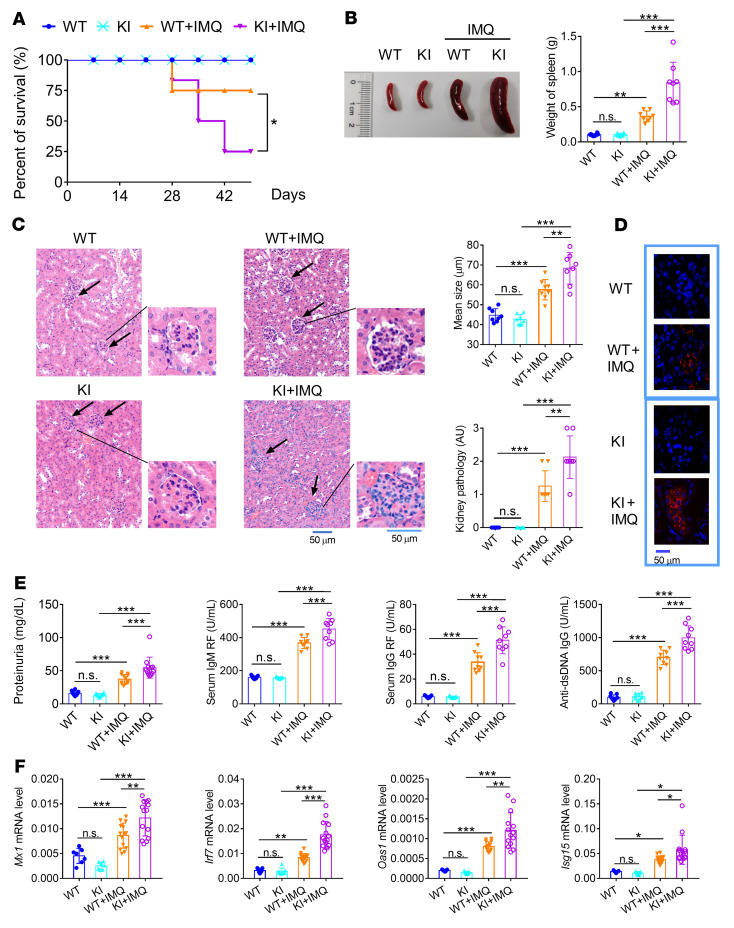
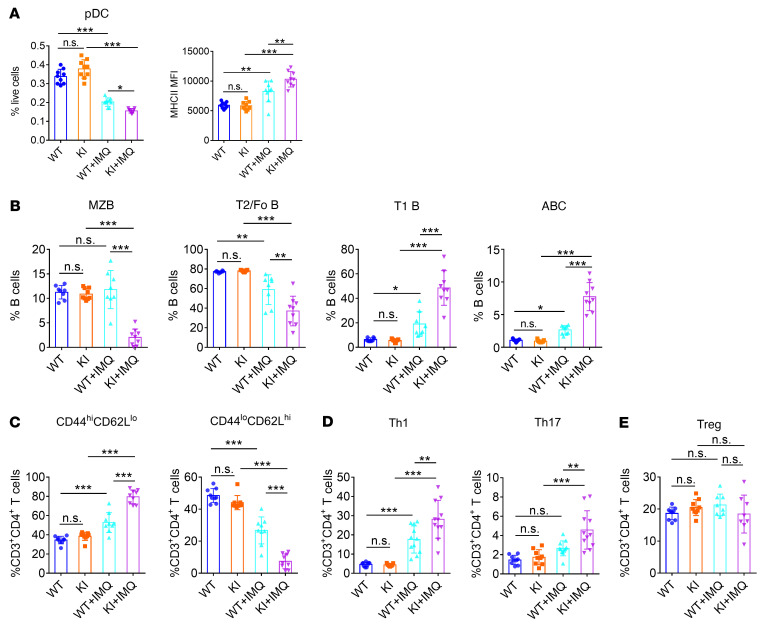
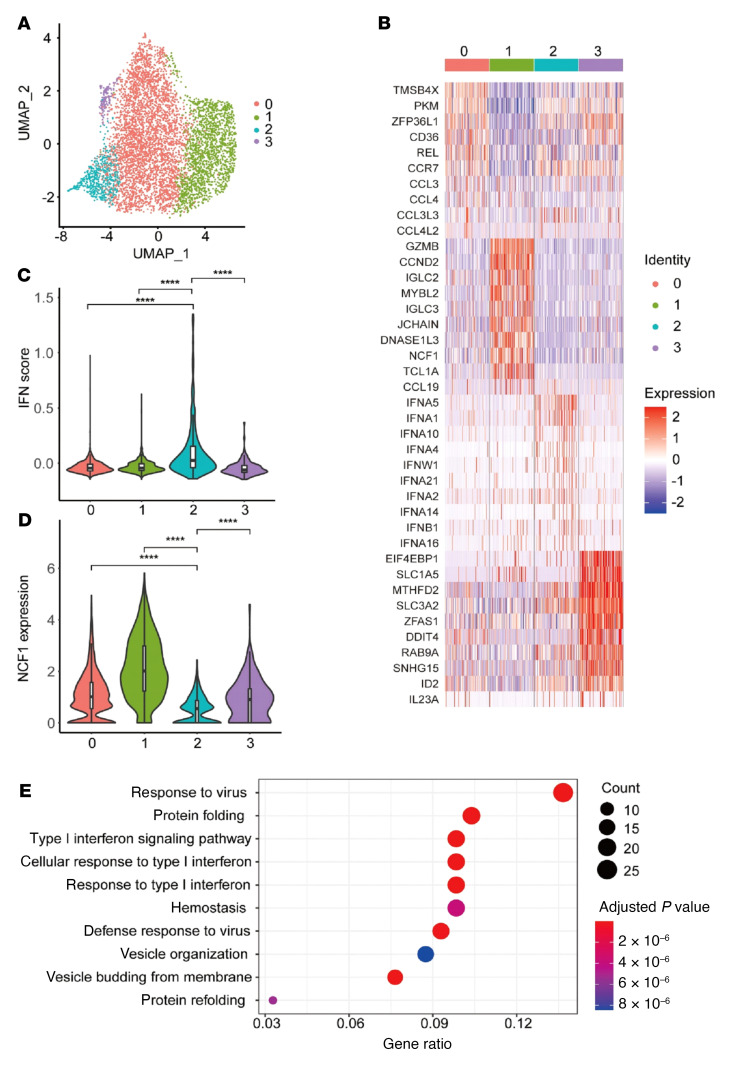
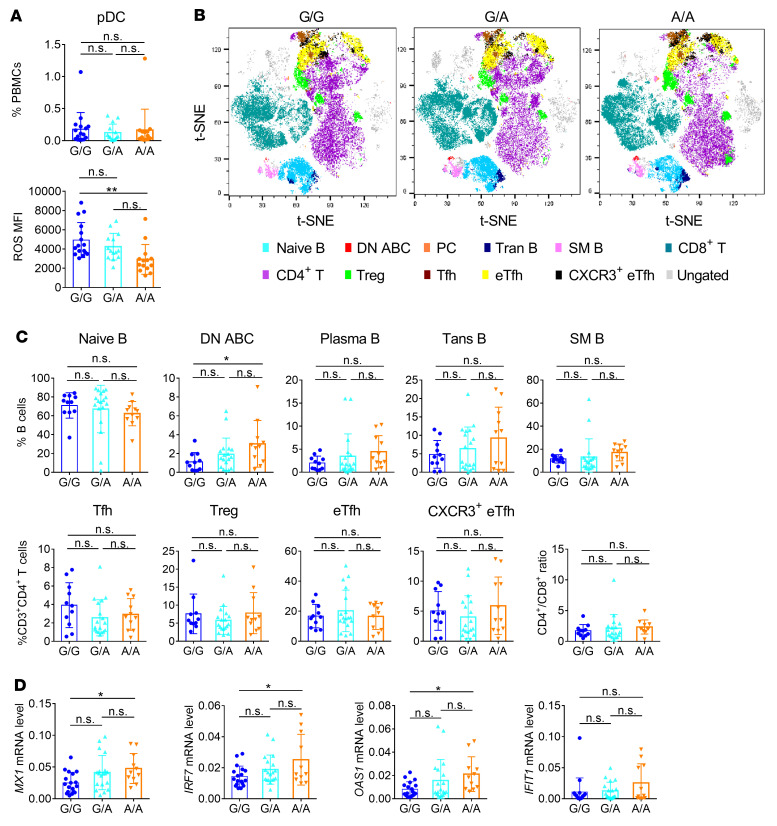
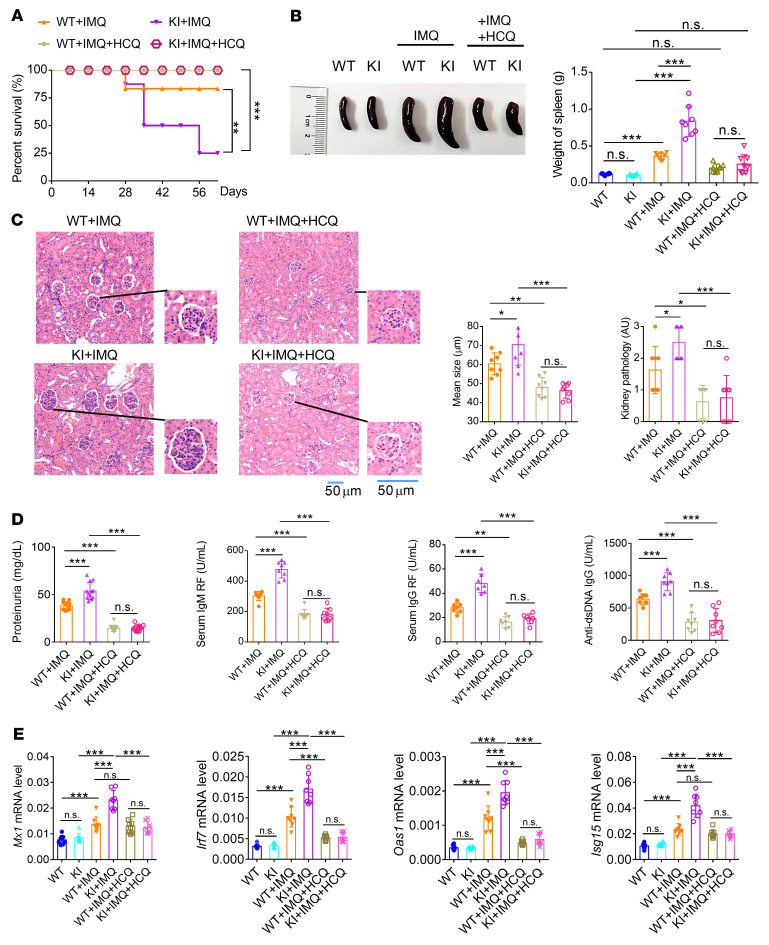
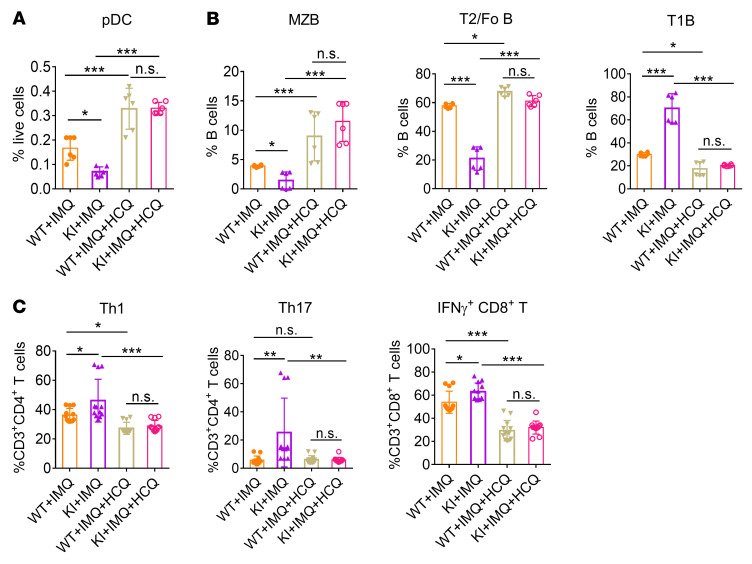
Plasmacytoid dendritic cells (pDCs) are a professional type I IFN producer that play critical roles in the pathogenesis of autoimmune diseases. However, both genetic regulation of the function of pDCs and their relationships with autoimmunity are largely undetermined. Here, we investigated the causality of the neutrophil cytosolic factor 1 (NCF1) missense variant, which is one of the most significant associated risk variants for lupus, and found that the substitution of arginine (R) for histidine (H) at position 90 in the NCF1 protein (NCF1 p.R90H) led to excessive activation of pDCs. A mechanism study demonstrated that p.R90H reduced the affinity of NCF1 for phospholipids, thereby impairing endosomal localization of NCF1. As NCF1 is a subunit of the NADPH oxidase 2 (NOX2) complex, this impairment led to an acidified endosomal pH and facilitated downstream TLR signaling. Consistently, the homozygous knockin mice manifested aggravated lupus progression in a pDC-dependent lupus model. More important, pharmaceutical intervention revealed that hydroxychloroquine (HCQ) could antagonize the detrimental function of NCF1 p.R90H in the lupus model and systemic lupus erythematosus samples, supporting the idea that NCF1 p.R90H could be identified as a genetic biomarker for HCQ application. Therefore, our study provides insights into the genetic control of pDC function and a paradigm for applying genetic variants to improve targeted therapy for autoimmune diseases.

Keywords: Autoimmunity; Lupus.


Figures

Figure 1
Figure 1. The NCF1 p. R90H mutation facilitates pDC activation.
(A) Splenic pDCs from WT (G/G), homozygous (A/A), and heterozygous (G/A) KI mice were sorted and then stimulated with R848 (upper panel) or CpG (lower panel) for 24 hours. Expression of IFN-α, IFN-β, TNF-α, and IL-6 and MHCII levels are shown. Error bars represent the SEM. n = 12. *P < 0.05 and ***P < 0.001, by 1-way ANOVA with Tukey’s multiple-comparison test. (BD) Sorted splenic pDCs with a specific genotype (G/G, G/A, and A/A) were stimulated with R848 for 12 hours and subjected to RNA-Seq. (B) KEGG analysis of upregulated genes in A/A compared with G/G and G/A pDCs. (C) GSEA analysis of TLR pathway and ROS pathway enrichment in A/A and control (CTL) (G/G and G/A) pDCs. NES, normalized enrichment score; Pval, P value.(D) Heatmap of changed genes enriched in TLR and ROS pathways.
Figure 2
Figure 2. NCF1 p.R90H impairs endosomal localization of NCF1 and acidifies the endosomal pH.
pDCs were stimulated with CpG for 2 hours. (A) Colocalization of NCF1 (green) and EEA1 (red) was detected by confocal microscopy and analyzed by ImageJ. Scale bar: 5 μm. One data point in the plot indicates the mean of Pearson’s R values from 5 cells, and a total of 50 cells per group were calculated . (B) The pH of late endosomes/lysosomes in CpG-activated pDCs was indicated by a lysosome sensor, detected by confocal microscopy, and measured by ImageJ. Scale bar: 10 μm. One data point in the plot indicates the average MFI of 5 cells, and a total of 50 cells per group were calculated. (C) Immunoblot analysis of cleavage of TLR7 and TLR9. G/G and A/A pDCs were stimulated with R848 or 5 μM CpG for 1 hour, respectively. The levels of intact TLR7 and the cleaved TLR7 fragment (TLR7-F) in R848-treated groups and the levels of intact TLR9 and the cleaved TLR9 fragment (TLR9-F) in the CpG-treated groups were analyzed. The ratios of cleaved TLR to intact TLR were calculated. (D) Structure of the PX domain of NCF1 90R and 90H. R90 and R43 are amino acids responsible for PtdIns(3,4)p2 binding. (E) Immunoblot analysis of GST-NCF1. S, protein in supernatant, P, protein in precipitation. The P/S ratios were calculated. Experiments were repeated 3 times. Error bars represent the SEM. *P < 0.05, **P < 0.01, and ***P < 0.001, by 2-tailed, unpaired t test (A, B, and E) or 1-way ANOVA with Tukey’s multiple-comparison test (C).
Figure 3
Figure 3. Ncf1-KI mice exhibit aggravated lupus progression.
WT and KI mice were treated with IMQ for 9 weeks. (A) Survival of WT mice (WT), KI mice (KI), WT lupus mice (WT+IMQ) and KI lupus mice (KI+IMQ). n = 20 mice per group. (B) Image and weight of spleens (n = 8). (C) H&E staining, glomerulus size, and pathological scores for renal tissues. Scale bars: 50 μm. (D) Deposition of anti-IgG antibody in the glomerulus (blue, DAPI; red, Alexa Fluor 647 goat anti–mouse IgG antibody). (E) Levels of proteinuria (n = 12), serum IgM and IgG RF, and anti–dsDNA IgG (n = 9). (F) MRNA levels of Mx1, Irf7, Oas1, and Isg15 in renal tissues (n = 7 or 14). The expression of mRNAs was normalized to the housekeeping gene Actb mRNA by calculating 2–ΔCt. Error bars represent the SEM. *P < 0.05, **P < 0.01, and ***P < 0.001, by 1-way ANOVA with Tukey’s multiple-comparison test.
Figure 4
Figure 4. NCF1 p.R90H facilitates the overactivation of immune cells.
Immune cell subsets in the spleen were analyzed by FACS. (A) Percentage and MHCII expression in pDCs (n = 9). (B) Proportion of B cell subsets (n = 9). (C) Proportion of activated splenic CD4+ T cell subsets (n = 9). (D) Proportion of splenic Th1 cell, Th17 cell, and (E) Treg subsets (n = 8–11). Error bars represent the SEM. *P < 0.05, **P < 0.01, and ***P < 0.001, by 1-way ANOVA with Tukey’s multiple-comparison test.
Figure 5
Figure 5. Single-cell analysis of pDCs.
Human primary pDCs were stimulated with R848 for 12 hours and subjected to 10X Genomic detection. (A) UMAP plots of single cells. (B) Characteristic genes of the 4 pDC clusters. (C) Enrichment of IFN pathway genes. (D) Expression of NCF1 in the 4 pDC clusters. (E) KEGG analysis of the featured genes in cluster 2. ****P < 0.0001, by Wilcoxon test.
Figure 6
Figure 6. NCF1 p.R90H variant associates with the immunologic change in patients with SLE.
(A) Percentage and ROS levels of pDCs in the peripheral blood of patients with SLE who carry the G/G (n = 16), G/A (n = 14), or A/A (n = 14) allele. (B) FACS analysis of B cell and T cell subsets in patients with SLE. Total B cells (CD19+); naive B cells (CD19+, CD27, IgD+); DN ABCs (CD19+, CD24, IgD, CD27, CD11c+); plasma cells (PCs) (CD19+, CD38hi, CD24lo); transitional B cells (Trans B) (CD19+, CD38hi, CD24hi); switched memory B cells (SM B) (CD19+, CD27+, IgD); total T cells (CD3+); CD4+ T cells (CD3+, CD4+); CD8+ T cells (CD3+, CD8+); Tfh cells (CD3+, CD4+, CD127+,CD45RA, CD25, CXCR5+, PD1hi); Tregs (CD3+, CD4+, CD25+, CD127); eTfh cells (CD3+, CD4+, CXCR5, PD1+); and CXCR3+ eTfh cells (CD3+, CD4+, CXCR5, PD1+, CXCR3+). Shown are t-distributed stochastic neighbor embedding (t-SNE) maps of 3 groups with 3 representative patients per group. (C) Statistics of B and T cell subsets, and the ratio of CD4+ T cells to CD8+ T cells are shown. (G/G, n = 11; G/A, n = 18; A/A, n = 11). (D) MRNA levels of Mx1, Irf7, Oas1, and Ifit1 in SLE PBMCs (G/G, n = 18; G/A, n = 19; A/A, n = 11). The expression of mRNAs was normalized to the housekeeping gene RPL13a by calculating 2–ΔCt. Error bars represent the SEM. *P < 0.05 and **P < 0.01, by 1-way ANOVA with Tukey’s multiple-comparison test.
Figure 7
Figure 7. Pharmaceutical application of HCQ alleviates the aggravation of NCF1 p.R90H in a lupus model.
WT and KI mice were treated with IMQ for 7 weeks. (A) Survival of WT lupus mice (WT+IMQ), KI lupus mice (KI+IMQ), HCQ-treated WT lupus mice (WT+IMQ+HCQ), and HCQ-treated KI lupus mice (KI+IMQ+HCQ). n = 20 mice per group. (B) Image and weights of spleens (n = 8). (C) H&E staining, glomerulus size, and pathological scores for kidneys (n = 8). Scale bar: 50 μm. (D) Levels of proteinuria (n = 12), serum RF IgM and IgG, and anti-dsDNA IgG (n = 8). (E) MRNA levels of Mx1, Irf7, Oas1, and Isg15 in renal tissues (n = 8). The expression of mRNAs was normalized to the housekeeping gene Actb mRNA by calculating 2–ΔCt. Error bars represent the SEM. *P < 0.05, **P < 0.01, and ***P < 0.001, by log-rank test (A) or 1-way ANOVA with Tukey’s multiple-comparison test (BE).
Figure 8
Figure 8. HCQ alleviates the overactivation of immune cells in vivo.
The activation of immune cells from mice in Figure 7 was analyzed by FACS. Percentage of (A) splenic pDCs, (B) B cell subsets, and (C) T cell subsets (n = 6). *P < 0.05, **P < 0.01, and ***P < 0.001, by 1-way ANOVA with Tukey’s multiple-comparison test. Error bars represent the SEM.

Comment in

References

    1. Pascual V, et al. A genomic approach to human autoimmune diseases. Annu Rev Immunol. 2010;28:535–571. doi: 10.1146/annurev-immunol-030409-101221. - DOI - PMC - PubMed
    1. Bronson PG, et al. The genetics of type I interferon in systemic lupus erythematosus. Curr Opin Immunol. 2012;24(5):530–537. doi: 10.1016/j.coi.2012.07.008. - DOI - PubMed
    1. Elkon KB, et al. Type I IFN system in the development and manifestations of SLE. Curr Opin Rheumatol. 2012;24(5):499–505. doi: 10.1097/BOR.0b013e3283562c3e. - DOI - PubMed
    1. Gilliet M, et al. Plasmacytoid dendritic cells: sensing nucleic acids in viral infection and autoimmune diseases. Nat Rev Immunol. 2008;8(8):594–606. doi: 10.1038/nri2358. - DOI - PubMed
    1. Reizis B. Plasmacytoid dendritic cells: development, regulation, and function. Immunity. 2019;50(1):37–50. doi: 10.1016/j.immuni.2018.12.027. - DOI - PMC - PubMed

Publication types

Substances