. 2022 Oct;18(10):1065-1075.
doi: 10.1038/s41589-022-01048-w. Epub 2022 Jul 4.

Targeting colorectal cancer with small-molecule inhibitors of ALDH1B1

Affiliations

Targeting colorectal cancer with small-molecule inhibitors of ALDH1B1

Zhiping Feng et al. Nat Chem Biol. 2022 Oct.

Erratum in

Abstract

Aldehyde dehydrogenases (ALDHs) are promising cancer drug targets, as certain isoforms are required for the survival of stem-like tumor cells. We have discovered selective inhibitors of ALDH1B1, a mitochondrial enzyme that promotes colorectal and pancreatic cancer. We describe bicyclic imidazoliums and guanidines that target the ALDH1B1 active site with comparable molecular interactions and potencies. Both pharmacophores abrogate ALDH1B1 function in cells; however, the guanidines circumvent an off-target mitochondrial toxicity exhibited by the imidazoliums. Our lead isoform-selective guanidinyl antagonists of ALDHs exhibit proteome-wide target specificity, and they selectively block the growth of colon cancer spheroids and organoids. Finally, we have used genetic and chemical perturbations to elucidate the ALDH1B1-dependent transcriptome, which includes genes that regulate mitochondrial metabolism and ribosomal function. Our findings support an essential role for ALDH1B1 in colorectal cancer, provide molecular probes for studying ALDH1B1 functions and yield leads for developing ALDH1B1-targeting therapies.


Conflict of interest statement

COMPETING FINANCIAL INTERESTS

J.K.C., Z.F., M.E.H., T.K., C.R.M., and A.E.O. have filed a PCT application related to the compounds described in this study.

Figures
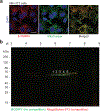
Extended Data Fig. 1.
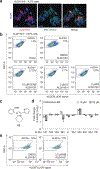
Extended Data Fig. 1.. Photoaffinity labeling of imidazolium-binding proteins
(a) Photoaffinity labeling and TAMRA-azide tagging of live NIH-3T3 cells, demonstrating the mitochondrial localization of the imidazolium target. Scale bar: 10 μm. (b) Mouse liver mitochondria were photocrosslinked with probe 3 in the absence or presence of competitor 2. The mitochondria were then homogenized, reacted with BODIPY azide (no competitior) or MegaStrokes 673 azide (competitor), and resolved by two-dimensional gel electrophoresis. Protein spots that were specifically labeled by 3 (dashed box, spots 1–5) were then isolated for mass spectrometry-based sequencing.
Extended Data Fig. 2.
Extended Data Fig. 2.. Inhibition of cellular ALDH1B1 activity by imidazolium derivatives
(a) Immunofluorescence staining of ALDH1A3–/– A375 cells transiently transfected with ALDH1B1, demonstrating the mitochondrial localization of the exogenous protein. Scale bar: 40 µm. (b) Flow cytometry-based assays of ALDH1B1 activity and its pharmacological inhibition using ALDH1A3–/– A375 cells. The cells were transiently transfected with ALDH1B1 cDNA or a vector control, incubated with the designated compounds, and then treated with ALDEFLUOR reagent. The cells were gated by ALDEFLUOR signal intensity and side scatter area (SSC-A) to identify those with ALDH1B1 activity, and the percentage of cells outside of the negative control gate is shown for each condition. DMSO and the pan-ALDH inhibitor DEAB were used as negative and positive controls, respectively. (c) Chemical structure of 63, which is inactive against ALDH1B1. (d) Activity of 63 against selected ALDH isoforms. Fold-change values are relative to a DMSO control and are the average of three biological replicates ± s.d. (e) Fluorescence-activated cell sorting (FACS) plots of ALDH1B1-overexpressing ALDH1A3–/– A375 cells that were incubated with DMSO or 63 and then treated with ALDEFLUOR reagent.
Extended Data Fig. 3.
Extended Data Fig. 3.. ALDH1B1 promotes SW480 and HCT116 cell growth in spheroid culture
(a and e) Western blot detection of ALDH1B1 protein in individual SW480 and HCT116 cell clones that were transiently transfected with Cas9 cDNA and ALDH1B1 gRNA-1 and gRNA-2. Lysates from the parental lines (P) are also shown, and importin β1 (KPNB1) was used as a loading control. SW480 clone 3 and clone 2 were used as ALDH1B1+/+ and ALDH1B1–/– clones for subsequent studies. (b and f) Phase-contrast micrographs of spheroid cultures derived from SW480 and HCT116 cells with differing ALDH1B1 genotypes. (c and g) Quantification of spheroid sizes for the micrographs shown in (b) and (f). Each dot represents an individual spheroid with an area that is >500 µm2 in the images. Error bars represent the average spheroid size ± s.e.m. (d and h) Viability of the ALDH1B1–/– clone in either adherent or spheroid conditions, as determined by cellular ATP levels and normalized to that of the as ALDH1B1+/+ clone. Data are the average of four (d and h, adherent), eight (d, spheroid) and six (h, spheroid) biological replicates ± s.e.m. Scale bars: 1 mm.
Extended Data Fig. 4.
Extended Data Fig. 4.. Exogenous ALDH1B1 rescues the spheroid growth of ALDH1B1 knockout colon cancer cells
(a) Western blot analysis of SW480 clones with the indicated ALDH1B1 genotypes and lentivirally transduced with either EGFP or exogenous ALDH1B1. Importin β1 (KNPB1) was used as gel-loading control. (b) Spheroid cultures of the SW480 clones described in (a). (c) Quantification of spheroid sizes for the micrographs shown in (b). Each dot represents an individual spheroid with an area that is >500 µm2 in the image. Error bars represent the average spheroid size ± s.e.m. (d) Viability of the ALDH1B1–/– SW480 clone transduced with EGFP or ALDH1B1 and cultured in either adherent or spheroid conditions, as determined by cellular ATP levels and normalized to that of the ALDH1B1+/+ clone transduced with EGFP. Data are the average of four biological replicates ± s.e.m.
Extended Data Fig. 5.
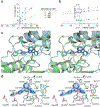
Extended Data Fig. 5.. Molecular basis of ALDH1B1-IGUANA binding
(a-b) Lineweaver-Burk plots demonstrating that IGUANA-4 exhibits non-competitive inhibition with respect to acetaldehyde (a) and uncompetitive inhibition with respect to NAD+ (b). Both enzyme kinetics assays used the same series of inhibitor concentrations, and the data are the average of three biological replicates ± s.e.m. (c) Wall-eyed stereoview of the ALDH1B1/NAD+/2 (light green cartoon and green stick model) and ALDH1B1/NAD+/IGUANA-4 (light blue cartoon and blue stick model) complexes shown as superimposed structures. Residues 143–154 and 490–500 and the NAD+ cofactor were omitted for clarity. (d) Wall-eyed stereoview of the electron density map for IGUANA-4 (blue mesh) bound to ALDH1B1. The polder omit map was calculated with coefficients mFo-DFc and is contoured at 4σ. Residues in the inhibitor-binding site are shown, and the red dashed line indicates a potential n-to-π* interaction between the Asn457 backbone carbonyl and the guanidine (3.2 Å).
Extended Data Fig. 6.
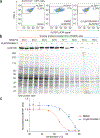
Extended Data Fig. 6.. IGUANAs engage ALDH1B1 in live cells
(a) Flow cytometry-based ALDEFLUOR assays using ALDH1A3–/– A375 cells, demonstrating the ability of IGUANA-3 to inhibit cellular ALDH1B1 activity. The cells were transiently transfected with ALDH1B1 cDNA or a vector control, incubated with IGUANA-3 or DMSO vehicle alone, and then treated with ALDEFLUOR reagent. The cells were gated by ALDEFLUOR signal intensity and side scatter area (SSC-A) to identify those with ALDH1B1 activity, and the percentage of cells outside of the negative control gate is shown for each condition. (b) Cellular thermal shift assay demonstrating that IGUANA-1 stabilizes endogenous ALDH1B1 in live SW480 cells. Western blot signals for ALDH1B1 and total protein staining of the soluble fraction are shown for each condition. (c) Corresponding melting curves of endogenous ALDH1B1 in the presence and absence of IGUANA-1. Data are the average of two biological replicates ± s.d., normalized to the DMSO condition at 45 °C.
Extended Data Fig. 7.
Extended Data Fig. 7.. IGUANAs suppress colon cancer spheroid growth
(a) Brightfield micrographs of SW480 spheroid cultures treated with IGUANA-3 and then stained with crystal violet. (b) Quantification of spheroid sizes for the micrographs shown in (b). Each dot represents an individual spheroid with an area that is >500 µm2 in the micrograph. Error bars represent the average spheroid size ± s.e.m. (c) Brightfield, fluorescent, and merged micrographs of SW480 spheroids treated with IGUANA-1 or DMSO vehicle alone for 3 days and then stained overnight with the viability dye SYTOX Green. Scale bars: a, 1 mm; c, 100 µm.
Figure 1.
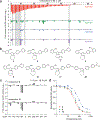
Figure 1.. Identification of an ALDH1B1-selective imidazolium.
(a) Chemical structures of imidazoliums 1-3. N1 and C4 positions on the imidazolium ring are labeled. (b) Reaction scheme for target photocrosslinking and click chemistry tagging. (c) Photoaffinity labeling of a 60-kDa imidazolium-binding protein in live NIH-3T3 cells. Biotin-azide was used to tag the photocrosslinked protein, which was then detected by far-western blot analysis. (d) Photoaffinity labeling and Cy5-azide tagging of the 60-kDa protein (dashed box) in intact, purified mitochondria from mouse liver. The mitochondrial lysate was resolved by two-dimensional gel electrophoresis, and Sypro Ruby was used to fluorescently stain the mitochondrial proteome. (e) Mass spectrometry sequencing of gel spots corresponding to the photoaffinity-labeled proteins, revealing ALDH2 as the candidate target with the highest normalized spectral abundance factor. (f) Confirmation of 3-ALDH2 photocrosslinking by biotin tagging and western blot analysis. Arrowheads label proteins that are both biotinylated and stained by anti-ALDH2 antibody. (g) Activities of 1-3 against selected ALDH isoforms in enzyme kinetics assays using acetaldehyde as substrate. Fold-change values are relative to a DMSO control and are the average of at least two biological replicates ± s.d. (h) Dose-response curves of 2 against ALDH1A1, ALDH1A3, and ALDH1B1. Data are the average of three biological replicates ± s.e.m.
Figure 2.
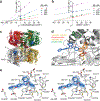
Figure 2.. Molecular basis of ALDH1B1-imidazolium binding.
(a-b) Lineweaver-Burk plots demonstrating that 2 exhibits non-competitive inhibition with respect to acetaldehyde (a) and uncompetitive inhibition with respect to NAD+ (b). Data are the average of two biological replicates ± s.e.m. (c) Tetrameric structure of the ALDH1B1/NAD+/2 complex, with the monomers shown in a different colors. (d) Close-up view of molecular interactions in the inhibitor-binding site, with 2 is shown as a blue stick model and NAD+ represented as dots. Conserved landmarks in the ALDH family are also shown as stick models, including the catalytic cysteine (Cys302; yellow), oxyanion hole (Asn169; red), aromatic box (Phe170, Trp177, and Phe465; orange), and aldehyde substrate anchor loop (Cys461 and His462; green). (e) Wall-eyed stereoview of the electron density map for 2 (blue mesh) bound to ALDH1B1. The polder omit map was calculated with coefficients mFo-DFc and is contoured at 4σ. Residues in the inhibitor-binding site are shown, and the red dashed line indicates a potential n-to-π* interaction between the Asn457 backbone carbonyl and the imidazolium ring (3.3 Å).
Figure 3.
Figure 3.. Structure-activity relationship analysis of the imidazolium pharmacophore.
(a-b) Compound activities against ALDH1 isoforms in enzyme kinetics assays using acetaldehyde as substrate. The compounds were tested at a 1-µM dose, and data are the average of at least two biological replicates. Chemical structures are shown for representative imidazoliums, which are also highlighted in the compound activity profiles with gray bars. (c) Profiling of 8 and 13 against a broader panel of ALDH isoforms. Data are the average of two biological replicates ± s.d. (d) Dose-response curves for 2, 8, and 13 in ALDH1B1 enzyme kinetics assays. Data are the average of three biological replicates ± s.e.m.
Figure 4.
Figure 4.. Imidazolium-based ALDH1B1 inhibitors exhibit off-target mitochondrial toxicity.
(a) Brightfield micrographs of SW480 spheroid cultures treated with the designated imidazolium derivatives and then stained with crystal violet. (b) Quantification of spheroid sizes in (a). Each dot represents an individual spheroid with an area that is >500 µm2 in the micrographs. Error bars represent the average spheroid size ± s.e.m. (c) Dose-response curves for 2 and 8 on SW480 cells cultured in either adherent or spheroid conditions. Data are the average of three biological replicates ± s.e.m. (d) Seahorse assays evaluating the effects of imidazoliums on the oxygen consumption rates of ALDH1B1+/+ and ALDH1B1–/– SW480 cells. Data are the average of three biological replicates ± s.e.m. Scale bars: 1 mm.
Figure 5.
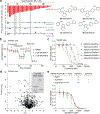
Figure 5.. Development of guanidine-based ALDH1B1 antagonists.
(a) Compound activities against ALDH1 isoforms in enzyme kinetics assays, revealing several ALDH1B1-selective guanidines. The compounds were tested at a 1-µM dose, and data are the average of at least two biological replicates. Chemical structures are shown for representative guanidine, which are also highlighted in the compound activity profiles with gray bars. (b) Seahorse assays showing that guanidiums do not inhibit oxygen consumption rates of SW480 cells. Data are the average of three biological replicates ± s.e.m. (c) Dose-response curves for IGUANA-1, IGUANA-2, and IGUANA-3 on adherent or spheroid cultures of SW480 cells. Data are the average of three biological replicates ± s.e.m. (d) TPP analysis demonstrating the biochemical specificity of IGUANA-1in SW480 cells. Data are the average of two biological replicates, and a volcano plot with cutoffs of ΔTm ≥ 1.5 °C and P < 0.05 is shown. Potential direct targets are colored red. (e) Dose-response curves for IGUANA-1on adherent or spheroid cultures of ALDH1B1–/– SW480 cells lentivirally transduced with either EGFP, exogenous ALDH1B1, or an inhibitor-resistant ALDH1B1 mutant. Data are the average of three biological replicates ± s.e.m.
Figure 6.
Figure 6.. ALDH1B1 inhibitor activities in models of colorectal cancer.
(a) Activities of 5-FU and IGUANA-2 against parental and 5-FU-resistant SW480 cell lines. The cells were cultured as spheroids, and data are the average of three biological replicates ± s.e.m. (b) Activities of IGUANA-1 against patient-derived organoids from colorectal tumors (CTO1, CTO2, CTO3, and CTO4) and normal colonic tissues (CNO1 and CNO2). Data are the average of five (CNO1, CTO3), six (CTO2) and seven (CNO2, CTO1, CTO3) biological replicates ± s.e.m. (c) Volcano plots of the transcriptional perturbations caused by genetically or chemically induced loss of ALDH1B1 function. Gene expression changes with adjusted P values (Padj) < 0.05 are graphed, and selected transcripts are annotated. ALDH1B1 is excluded in the volcano plot for the genetic loss of ALDH1B1 function since its Padj value exceeds the range of the y-axis. (d) Comparison of transcriptional changes caused by the genetic and chemical perturbations. Transcripts with statistically significant changes in expression for both data sets are graphed, and those that are most dependent on ALDH1B1 activity are annotated.

References

    1. Vassalli G Aldehyde dehydrogenases: not just markers, but functional regulators of stem cells. Stem Cells Int 2019, 3904645, (2019). - PMC - PubMed
    1. Xu X et al. Aldehyde dehydrogenases and cancer stem cells. Cancer Lett 369, 50–57, (2015). - PubMed
    1. Marcato P et al. Aldehyde dehydrogenase activity of breast cancer stem cells is primarily due to isoform ALDH1A3 and its expression is predictive of metastasis. Stem Cells 29, 32–45, (2011). - PubMed
    1. Mao P et al. Mesenchymal glioma stem cells are maintained by activated glycolytic metabolism involving aldehyde dehydrogenase 1A3. Proc. Natl. Acad. Sci. U. S. A 110, 8644–8649, (2013). - PMC - PubMed
    1. Luo Y et al. ALDH1A isozymes are markers of human melanoma stem cells and potential therapeutic targets. Stem Cells 30, 2100–2113, (2012). - PMC - PubMed

METHODS-ONLY REFERENCES

    1. Taipale J et al. Effects of oncogenic mutations in Smoothened and Patched can be reversed by cyclopamine. Nature 406, 1005–1009, (2000). - PubMed
    1. Hoppel C, DiMarco JP & Tandler B Riboflavin and rat hepatic cell structure and function. Mitochondrial oxidative metabolism in deficiency states. J. Biol. Chem 254, 4164–4170, (1979). - PubMed
    1. Wolfram S et al. A small azide-modified thiazole-based reporter molecule for fluorescence and mass spectrometric detection. Beilstein J. Org. Chem 10, 2470–2479, (2014). - PMC - PubMed
    1. Elias JE & Gygi SP Target-decoy search strategy for increased confidence in large-scale protein identifications by mass spectrometry. Nat. Methods 4, 207–214, (2007). - PubMed
    1. Chen CH, Cruz LA & Mochly-Rosen D Pharmacological recruitment of aldehyde dehydrogenase 3A1 (ALDH3A1) to assist ALDH2 in acetaldehyde and ethanol metabolism in vivo. Proc. Natl. Acad. Sci. U. S. A 112, 3074–3079, (2015). - PMC - PubMed

Publication types

MeSH terms