. 2022 Jul;29(7):653-664.
doi: 10.1038/s41594-022-00791-x. Epub 2022 Jul 4.

Structural basis for inhibition and regulation of a chitin synthase from Candida albicans

Affiliations

Structural basis for inhibition and regulation of a chitin synthase from Candida albicans

Zhenning Ren et al. Nat Struct Mol Biol. 2022 Jul.

Abstract

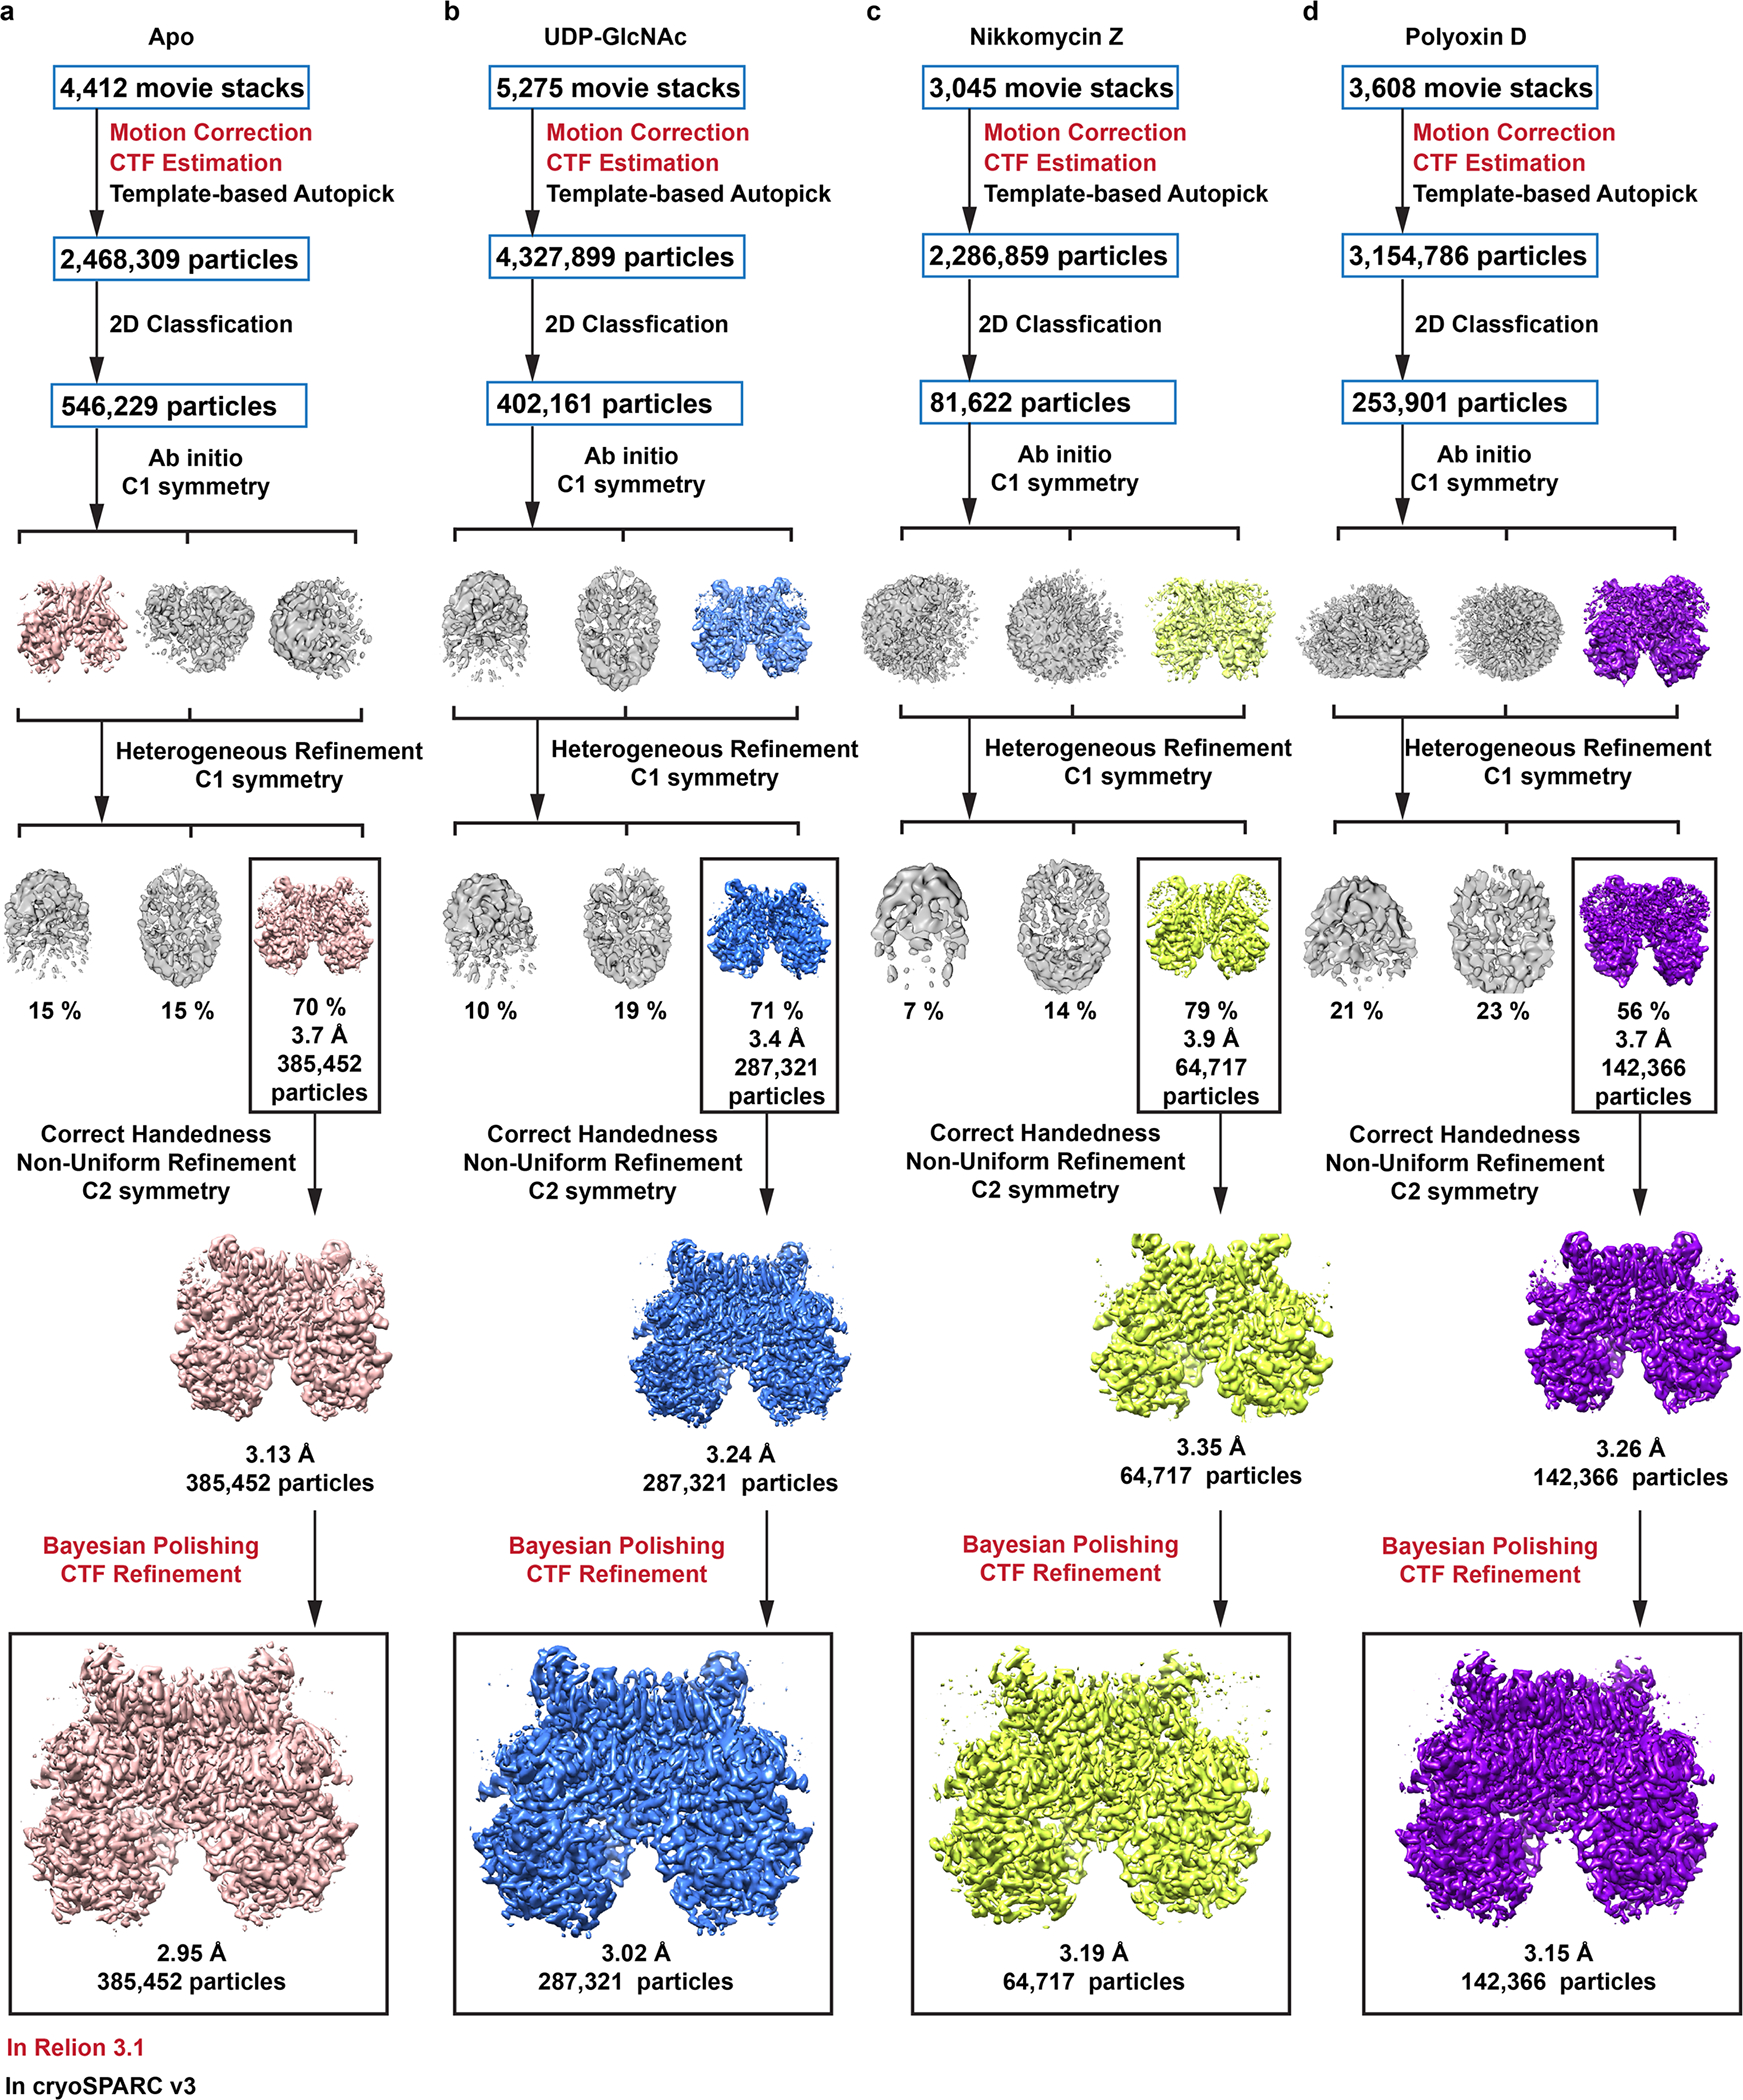
Chitin is an essential component of the fungal cell wall. Chitin synthases (Chss) catalyze chitin formation and translocation across the membrane and are targets of antifungal agents, including nikkomycin Z and polyoxin D. Lack of structural insights into the action of these inhibitors on Chs has hampered their further development to the clinic. We present the cryo-EM structures of Chs2 from Candida albicans (CaChs2) in the apo, substrate-bound, nikkomycin Z-bound, and polyoxin D-bound states. CaChs2 adopts a unique domain-swapped dimer configuration where a conserved motif in the domain-swapped region controls enzyme activity. CaChs2 has a dual regulation mechanism where the chitin translocation tunnel is closed by the extracellular gate and plugged by a lipid molecule in the apo state to prevent non-specific leak. Analyses of substrate and inhibitor binding provide insights into the chemical logic of Chs inhibition, which can guide Chs-targeted antifungal development.


Conflict of interest statement

Competing interests

The authors declare no competing interests.

Figures

Extended Data Fig. 1 |
Extended Data Fig. 1 |. Purification and enzymatic reaction of CaChs2 and isothermal titration calorimetry (ITC) analysis.
a, Representative gel-filtration profile and SDS-PAGE of purified CaChs2. The experiments have been repeated more than ten times independently with essentially the same results. b, Enzymatic reaction of CaChs2. c-e. Representative ITC data of CaChs2 WT (c), W647A (d) and Q643A (e) vs Nikkomycin. The Kd is the average of three independent repeats. The uncropped gel image for a is available as source data.
Extended Data Fig. 2 |
Extended Data Fig. 2 |. Cryo-EM analysis of CaChs2 in apo, UDP-GlcNAc bound, nikkomycin Z bound, and polyoxin D bound states.
a, General flowchart for data processing. b, Representative micrographs for each dataset. The number of total micrographs in each dataset is shown in Extended Data Fig.3. c, Representative 2D classes. d, Local resolution maps. e, Euler angle distribution of the final reconstructions. f, The gold-standard Fourier shell correlation (FSC) curves for the final reconstructions. g, FSC curves of the refined models versus the corresponding full map (red) and half maps (green and blue).
Extended Data Fig. 3 |
Extended Data Fig. 3 |. Data processing flowchart.
Data processing for CaChs2 in apo (a), UDP-GlcNAc bound (b), nikkomycin Z bound (c), and polyoxin D bound (d) states.
Extended Data Fig. 4 |
Extended Data Fig. 4 |. Representative EM densities.
Representative densities for CaChs2 in apo (a), UDP-GlcNAc bound (b), nikkomycin Z bound (c), and polyoxin D bound (d) states.
Extended Data Fig. 5 |
Extended Data Fig. 5 |. Comparison of architectures of chitin synthase CaChs2 and cellulose synthases RsBcsA and PttCesA8.
a, Domain arrangement of CaChs2, RsBcsA and PttCesA8. b-c, Topology diagrams of RsBcsA (b) and PttCesA8 (c).
Extended Data Fig. 6 |
Extended Data Fig. 6 |. The dimer interface of CaChs2.
a, Cartoon representation of a CaChs2 dimer. The dimer interface is highlighted in the rectangle. b-c, Close-up view of the dimer interface in two orientations.
Extended Data Fig. 7 |
Extended Data Fig. 7 |. Structural comparison of polymer translocation tunnels and substrate binding sites of CaChs2, RsBcsA and PttCesA8.
a, Left: Ribbon representation of RsBcsA in the product bound state (PDB code: 5EJZ) with the tunnel highlighted in surface representation and the cellulose polymer in sticks. Trp383, which defines the intracellular entry of the tunnel is highlighted in sticks. Right: Length and radius of the tunnel calculated by the HOLE program. b. Ribbon representation of PttCesA (PDB code: 6WLB) with the tunnel highlighted in surface representation and the cellulose polymer in sticks. Trp718, which defines the intracellular entry of the tunnel is highlighted in sticks. Right: Length and radius of the tunnel calculated by the HOLE program. c-d. Overlay of the substrate binding sites of CaChs2 (green) and substrate-bound RsBcsA (orange) (PDB code: 5EIy). Conserved residues that interact with the substrates and the catalytic residues are shown as sticks. e-f. Overlay of binding sites of CaChs2 (green) and product-bound PttCesA8 (purple) (PDB code: 6WLB). Conserved residues that interact with the substrates and the catalytic residues are shown as sticks.
Extended Data Fig. 8 |
Extended Data Fig. 8 |. Conservation mapping of CaChs2 and EM density of UDP-GlcNAc and Mg2+ at the substrate binding site.
a, Cross-section surface representation of a CaChs2 monomer bound to nikkomycin Z (yellow spheres). b, Detailed interactions between CaChs2 and nikkomycin Z. In both a and b, CaChs2 is colored based on the conservation score calculated by the Consurf Server (https://consurf.tau.ac.il/) from 150 Chs homologs whose sequence identity varies from 35% to 99%. Conservation scores: 1, ~15% conserved; 5, ~60% conserved; 9, 100% conserved. c-d, Density (Threshold = 0.007) of within 6 Å of UDP-GlcNAc, Mg2+, and residues interacting with the substrate, viewed from two orientations, is shown as grey surfaces. The protein model is shown as cartoon and the substrate and residues at the binding site are shown as sticks. The map and model of residues obstructing the view are hidden for clarity.
Extended Data Fig. 9 |
Extended Data Fig. 9 |. Identification of lipids copurified with CaChs2 by LC/MS.
a, Total ion chromatogram (TIC) of normal phase LC/MS of lipids extracted from the CaChs2 protein sample. b, Representative chemical structure of ceramide and mass spectrum of the 2.88 min TIC peak in a showing the chloride adduct [M + Cl] ions of ceramide species. c, Representative chemical structure of and mass spectrum of the 16.20 min TIC peak in a showing the [M-H] ions of PE molecular species. This identification of ceramide and PE was supported by exact mass measurement and MS/MS. The TIC peaks at 14.09, 21.16 and 27.18 min are consistent with glycodiosgenins (GDN) containing two, three and four sugars whose [M + Cl] ions are observed at m/z 875.5, 1037.5 and 1199.5, respectively.
Extended Data Fig. 10 |
Extended Data Fig. 10 |. Map and model of the domain-swapped region and crosslinking experiments to validate the domain-swapped assembly.
a-b, Unsharpened map of the domain-swapped region of UDP-GlcNAc bound CaChs2 shown at threshold 0.00475, viewed from two orientations. c. Representative density of the domain-swapped region. The protein model is shown as cartoon and side chains are shown as sticks. Some of the side chains are not built due to lack of signal. d. CaChs2 viewed from the intracellular side. The Cα atom of P906 and N917, which define the N and C-terminus of the loop between H10 and TM5, are shown as spheres. The distances from the Cα of P906 to that of N917 within the same monomer or in different monomers are labeled with dashed lines. It is noteworthy that the distance between P906 and N917 is closer in the domain swapped arrangement (30 Å) than the non-domain swapped arrangement (46.5 Å). Because the length of an amino acid in a linear chain is ~3.5 Å, non-domain swapped configuration is physically impossible. e. Model of CaChs2 dimer with one protomer in blue and the other in salmon. Cα atoms of residues where cysteine was introduced are shown as spheres. The crosslinking cysteine pairs are labeled with dashed lines. f. SDS-PAGE analysis of single and double cysteine mutants of CaChs2. The experiment has been repeated four times from two biological repeats with essentially the same results. Uncropped gel images for f are available as source data.
Fig. 1 |
Fig. 1 |. Biochemical characterization and overall architecture of CaChs2.
a, Activity assay of CaChs2 measuring the rate of GlcNAc incorporated into insoluble chitin at different UDP-GlcNAc concentrations. The solid line represents a fit to the Michaelis–Menten equation. Data points represent the mean of three independent experiments (n = 3) with enzyme prepared from two biological replicates and error bars represent 1 s.d. b, Characterization of CaChs2 product. Left: FTIR spectra of CaChs2 product (black trace) and commercial shrimp chitin (rose trace) as an α-chitin standard. Right: Region of spectra showing the divided amide I band characteristic of α-chitin. c, GlcNAc incorporated into insoluble chitin over time in the presence or absence of Mg2+. Data points are the mean of three independent experiments (n = 3) with enzyme prepared from two biological replicates with error bars representing 1 s.d. d, CaChs2 activity in response to varying concentrations of nikkomycin Z (circles) and polyoxin D (squares). Each data point is an average of three independent experiment repeats with enzyme prepared from two biological replicates with error bars representing 1 s.d. (n = 3). The solid lines represent a non-linear curve fit to the four-parameter logistic equation. e,f, Unsharpened cryo-EM map of CaChs2 dimer in two orientations (e) and (f). The cryo-EM densities for two Chs2 protomers are colored blue and yellow, respectively. The cryo-EM density for the detergent micelle is shown transparent and colored gray. g,h, Cartoon representation (g) and topology diagram (h) of a CaChs2 monomer. The transmembrane domain (TMD) is colored blue; the interfacial domain (IFD) green; the catalytic helical module (CHM) red; the glycosyltransferase domain (GTD) dark yellow. The β-sheets of the GTD core, the CHM, and the domain-swapped region are highlighted in h. Data for graphs in a, c and d are available as source data.
Fig. 2 |
Fig. 2 |. Translocation tunnel for chitin.
a, Cross-section view of the CaChs2 dimer. One monomer is shown in surface representation, revealing the location and shape of the tunnel, and the other monomer is shown in cartoon representation. b, Ribbon representation of a CaChs2 monomer with the tunnel shown as surface representation. c, Length and radius of the tunnel calculated using the HOLE program. The starting point of the tunnel is defined at the location of W647 and the end point the gate. d, Extracellular gate of the tunnel shown in cartoon and surface representation. The gate residues and the lipid inside the tunnel are shown as sticks. e,f, The chitin translocation tunnel shown as surface (e) and the residues lining the tunnel in stick representation (f). g, Cross-section view of the chitin translocation tunnel. The phospholipid modeled as phosphatidylethanolamine (PE) inside the tunnel and residues interacting with the head group of the lipid are shown as sticks. The position of the lateral opening in this figure is above the plane of the paper. h, Surface representation of the lateral opening of the tunnel viewed from within the membrane leaflet. The lipid molecule and residues that enclose the lateral opening are shown as sticks. i, Comparison of the activities of CaChs2 WT and the tunnel, gate, and lateral opening mutants of CaChs2. Columns represent the mean of at least two independent experiments from two biological replicates each (n = 4 for all except WT where n = 9), and error bars represent 1 s.d. Significance was calculated using two-tailed t-test to compare the activity of the mutant enzymes to the WT enzyme (*P < 0.05, ***P < 0.001, ****P < 0.0001). Data for graph i and exact P values are available as source data.
Fig. 3 |
Fig. 3 |. The UDP-GlcNAc binding site.
a, Cartoon representation of a CaChs2 monomer bound to UDP-GlcNAc, shown as spheres. b,c, Detailed interactions between CaChs2 and UDP-GlcNAc (b), (c). Hydrophilic interactions are shown as dashed lines except for those of E603 and D604, which were shown to illustrate their long distance to the GlcNAc moiety of UDP-GlcNAc. d, Comparison of the activities of CaChs2 WT and mutants related to the UDP-GlcNAc binding site. Columns represent the mean of at least two independent experiments from two biological replicates each (n = 4 for all except WT where n = 9), and error bars represent 1 s.d. Significance was calculated using two-tailed t-test to compare the activity of the mutant enzymes to the WT enzyme (****P < 0.0001). Data for graph d and exact P values are available as source data.
Fig. 4 |
Fig. 4 |. Domain-swapped region.
a, Cartoon representation of a CaChs2 dimer. The domain-swapped regions are highlighted with surface representation. b, Close-up view of the inter-subunit interaction between the domain-swapped region of one monomer and the GTD of the other monomer. c, Close-up view of the intra-subunit interactions between the DISW motif and multiple regions surrounding the substrate binding site. H-bonds and hydrophobic interactions are labeled as dashed lines. d, Comparison of the activity of WT CaChs2 to DISW motif mutants. Simultaneous alanine substitution of the D856–W859 region is named DISW. Columns represent the mean of at least two independent experiments from two biological replicates each (n = 4 for all except WT where n = 9, H569A where n = 8, and K862A and W859A where n = 3), and error bars represent 1 s.d. Significance was calculated using two-tailed t-test to compare the activity of the mutant enzymes to the WT enzyme. (NS P > 0.05 **P < 0.01, ****P < 0.0001. Data for graph d and exact P values are available as source data.
Fig. 5 |
Fig. 5 |. CaChs2 structures bound to nikkomycin Z and polyoxin D.
a, Cross-section surface representation of a CaChs2 monomer bound to nikkomycin Z (yellow spheres). b,c, Chemical structure (b) and cryo-EM density (c) of nikkomycin Z. d, Detailed interactions between CaChs2 and nikkomycin Z. Hydrophilic and π-π stacking interactions are labeled with dashed lines. e, Electrostatic surface representation of the nikkomycin Z binding site. Key side chains are shown as sticks. f, Cross-section surface representation of a CaChs2 monomer bound to polyoxin D (yellow spheres). g,h, Chemical structure (g) and cryo-EM density (h) of polyoxin D. i, Detailed interactions between CaChs2 and polyoxin D. Hydrophilic and π-π stacking interactions are labeled with dashed lines. j, Electrostatic surface representation of the polyoxin D binding site. Key side chains are shown as sticks.
Fig. 6 |
Fig. 6 |. Overlay of the substrate binding sites of uDP-GlcNAc-bound, nikkomycin Z-bound, and polyoxin D-bound CaChs2.
a, Overlay of the substrate binding sites of UDP-GlcNAc-bound (brown) and nikkomycin Z-bound (green) CaChs2. b, Overlay of the substrate binding sites of nikkomycin Z-bound (green) and polyoxin D-bound (magenta) CaChs2. H-bond and π-π stacking interactions between substrate/ligand to CaChs2 are labeled with dashed lines in indicated colors.
Fig. 7 |
Fig. 7 |. Working models of lipid modulation and drug inhibition on CaChs2 function as well as of higher-order assembly of chitin chains.
a, Lipid modulation and drug inhibition. In the off state, the extracellular gate (blue) of the chitin translocation tunnel is closed. The tunnel is further obstructed by a PE molecule that enters from the lateral opening to prevent non-specific leakage of ions, water, and small molecules. The nascent chitin chain extends into the tunnel and expels the lipid out of the tunnel. When the chitin chain reaches the extracellular side, the gate opens, and the chain continues to elongate toward the extracellular space. TM3 and EH1 (orange triangle) of CaChs2 protrude out of the membrane, and they may provide interactions with the nascent chitin chain and facilitate the elongation. Nikkomycin Z and polyoxin D inhibit chitin synthesis by two mechanisms. First, they occupy the UDP-GlcNAc binding site competitively. Second, once bound, their N-terminal amino acid extends into the tunnel, and either partially overlaps with the acceptor binding site or obstructs chitin translocation. b, Higher order chitin assembly. When the nascent chitin chain reaches a certain length, the reducing end could fold back and form antiparallel chitin strands with the GlcNAc units near the non-reducing end. The dimeric architecture of CaChs2 can facilitate assembly of two antiparallel chitin strands, one from each monomer, into α-chitin. At Chs2-enriched regions of the plasma membrane, the α-chitin strands can further assemble into the higher-order structures of protofibril and microfibril.

References

    1. Tharanathan RN & Kittur FS Chitin–the undisputed biomolecule of great potential. Crit. Rev. Food Sci. Nutr. 43, 61–87 (2003). - PubMed
    1. Steinfeld L, Vafaei A, Rosner J & Merzendorfer H Chitin prevalence and function in bacteria, fungi and protists. Adv. Exp. Med. Biol. 1142, 19–59 (2019). - PubMed
    1. Mahmoud YA, El-Naggar ME, Abdel-Megeed A & El-Newehy M Recent advancements in microbial polysaccharides: synthesis and applications. Polymers (Basel) 13, 4136 (2021). - PMC - PubMed
    1. Mikusova V & Mikus P Advances in chitosan-based nanoparticles for drug delivery. Int. J. Mol. Sci. 22, 5776 (2021). - PMC - PubMed
    1. Bhatt K et al. High mortality co-infections of COVID-19 patients: mucormycosis and other fungal infections. Discoveries (Craiova) 9, e126 (2021). - PMC - PubMed

Publication types

MeSH terms