. 2022 Jul;607(7917):52-59.
doi: 10.1038/s41586-022-04893-w. Epub 2022 Jul 4.

A detailed map of Higgs boson interactions by the ATLAS experiment ten years after the discovery

Collaborators

A detailed map of Higgs boson interactions by the ATLAS experiment ten years after the discovery

ATLAS Collaboration. Nature. 2022 Jul.

Erratum in

Abstract

The standard model of particle physics1-4 describes the known fundamental particles and forces that make up our Universe, with the exception of gravity. One of the central features of the standard model is a field that permeates all of space and interacts with fundamental particles5-9. The quantum excitation of this field, known as the Higgs field, manifests itself as the Higgs boson, the only fundamental particle with no spin. In 2012, a particle with properties consistent with the Higgs boson of the standard model was observed by the ATLAS and CMS experiments at the Large Hadron Collider at CERN10,11. Since then, more than 30 times as many Higgs bosons have been recorded by the ATLAS experiment, enabling much more precise measurements and new tests of the theory. Here, on the basis of this larger dataset, we combine an unprecedented number of production and decay processes of the Higgs boson to scrutinize its interactions with elementary particles. Interactions with gluons, photons, and W and Z bosons-the carriers of the strong, electromagnetic and weak forces-are studied in detail. Interactions with three third-generation matter particles (bottom (b) and top (t) quarks, and tau leptons (τ)) are well measured and indications of interactions with a second-generation particle (muons, μ) are emerging. These tests reveal that the Higgs boson discovered ten years ago is remarkably consistent with the predictions of the theory and provide stringent constraints on many models of new phenomena beyond the standard model.


Conflict of interest statement

The authors declare no competing interests.

Figures

Fig. 1
Fig. 1. Examples of Feynman diagrams for Higgs boson production and decay.
ae, The Higgs boson is produced via gluon–gluon fusion (a), vector boson fusion (VBF; b) and associated production with vector bosons (c), top or b quark pairs (d), or a single top quark (e). fi, The Higgs boson decays into a pair of vector bosons (f), a pair of photons or a Z boson and a photon (g), a pair of quarks (h), and a pair of charged leptons (i). Loop-induced Higgs boson interactions with gluons or photons are shown in blue, and processes involving couplings to W or Z bosons in green, to quarks in orange, and to leptons in red. Two different shades of green (orange) are used to separate the VBF and VH (tt¯H and tH) production processes.
Fig. 2
Fig. 2. Observed and predicted Higgs boson production cross-sections and branching fractions.
a, Cross-sections for different Higgs boson production processes are measured assuming standard model (SM) values for the decay branching fractions. b, Branching fractions for different Higgs boson decay modes are measured assuming SM values for the production cross-sections. The lower panels show the ratios of the measured values to their SM predictions. The vertical bar on each point denotes the 68% confidence interval. The p value for compatibility of the measurement and the SM prediction is 65% for a and 56% for b. Data are from ATLAS Run 2.
Fig. 3
Fig. 3. Ratio of observed rate to predicted standard model event rate for different combinations of Higgs boson production and decay processes.
The horizontal bar on each point denotes the 68% confidence interval. The narrow grey bands indicate the theory uncertainties in the standard model (SM) cross-section multiplied by the branching fraction predictions. The p value for compatibility of the measurement and the SM prediction is 72%.  σi Bf is normalized to the SM prediction. Data are from ATLAS Run 2.
Fig. 4
Fig. 4. Negative log-likelihood contours corresponding to 68% and 95% CL in the (κV, κF) plane.
The data are obtained from a combined fit assuming no contributions from invisible or undetected non-standard model Higgs boson decays. The p value for compatibility of the combined measurement and the standard model (SM) prediction is 14%. Data are from ATLAS Run 2.
Fig. 5
Fig. 5. Reduced Higgs boson coupling strength modifiers and their uncertainties.
They are defined as κFmF/vev for fermions (F = t, b, τ, μ) and κVmV/vev for vector bosons as a function of their masses mF and mV. Two fit scenarios with κc = κt (coloured circle markers), or κc left free-floating in the fit (grey cross markers) are shown. Loop-induced processes are assumed to have the standard model (SM) structure, and Higgs boson decays to non-SM particles are not allowed. The vertical bar on each point denotes the 68% confidence interval. The p values for compatibility of the combined measurement and the SM prediction are 56% and 65% for the respective scenarios. The lower panel shows the values of the coupling strength modifiers. The grey arrow points in the direction of the best-fit value and the corresponding grey uncertainty bar extends beyond the lower panel range. Data are from ATLAS Run 2.
Fig. 6
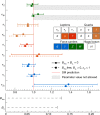
Fig. 6. Reduced coupling strength modifiers and their uncertainties per particle type with effective photon, and gluon couplings.
The horizontal bars on each point denote the 68% confidence interval. The scenario in which Binv. = Bu. = 0 is assumed is shown as solid lines with circle markers. The p value for compatibility with the standard model (SM) prediction is 61% in this case. The scenario in which Binv. and Bu. are allowed to contribute to the total Higgs boson decay width while assuming that κV ≤ 1 and Bu. ≥ 0 is shown as dashed lines with square markers. The lower panel shows the 95% CL upper limits on Binv. and Bu.. Data are from ATLAS Run 2.
Fig. 7
Fig. 7. Observed and predicted Higgs boson production cross-sections in different kinematic regions.
The vertical bar on each point denotes the 68% confidence interval. The p value for compatibility of the combined measurement and the standard model (SM) prediction is 94%. Kinematic regions are defined separately for each production process, based on the jet multiplicity, the transverse momentum of the Higgs (pTH) and vector bosons (pTW and pTZ) and the two-jet invariant mass (mjj). The ‘VH-enriched’ and ‘VBF-enriched’ regions with the respective requirements of mjj[60,120)GeV and mjj[60,120)GeV are enhanced in signal events from VH and VBF productions, respectively. Data are from ATLAS Run 2.

References

    1. Weinberg S. A model of leptons. Phys. Rev. Lett. 1967;19:1264–1266. doi: 10.1103/PhysRevLett.19.1264. - DOI
    1. Glashow SL. Partial symmetries of weak interactions. Nucl. Phys. 1961;22:579–588. doi: 10.1016/0029-5582(61)90469-2. - DOI
    1. Salam A. Weak and electromagnetic interactions. Proc. 8th Nobel Symposium, Conf. Proc. C. 1968;680519:367–377.
    1. ’t Hooft G, Veltman MJG. Regularization and renormalization of gauge fields. Nucl. Phys. B. 1972;44:189–213. doi: 10.1016/0550-3213(72)90279-9. - DOI
    1. Higgs PW. Broken symmetries, massless particles and gauge fields. Phys. Lett. 1964;12:132–133. doi: 10.1016/0031-9163(64)91136-9. - DOI