. 2022 Jul;6(7):791-805.
doi: 10.1038/s41551-022-00902-5. Epub 2022 Jul 4.

Exosomes decorated with a recombinant SARS-CoV-2 receptor-binding domain as an inhalable COVID-19 vaccine

Affiliations

Exosomes decorated with a recombinant SARS-CoV-2 receptor-binding domain as an inhalable COVID-19 vaccine

Zhenzhen Wang et al. Nat Biomed Eng. 2022 Jul.

Abstract

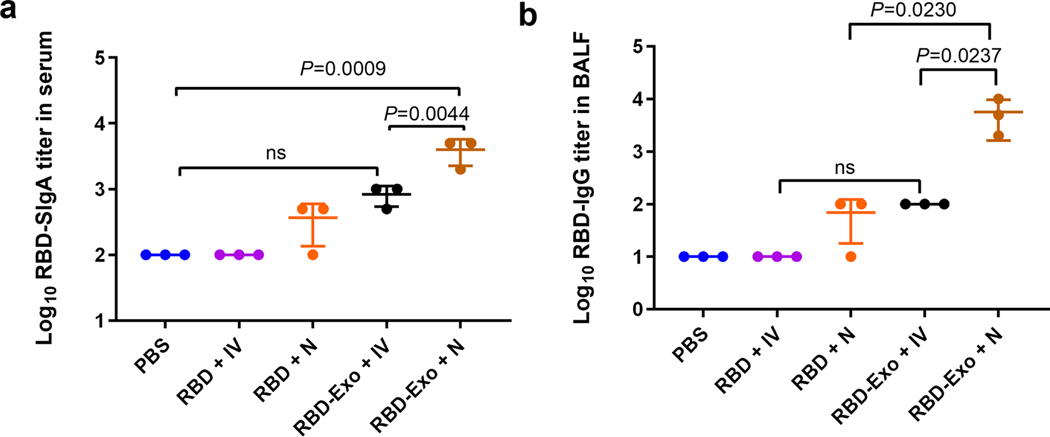
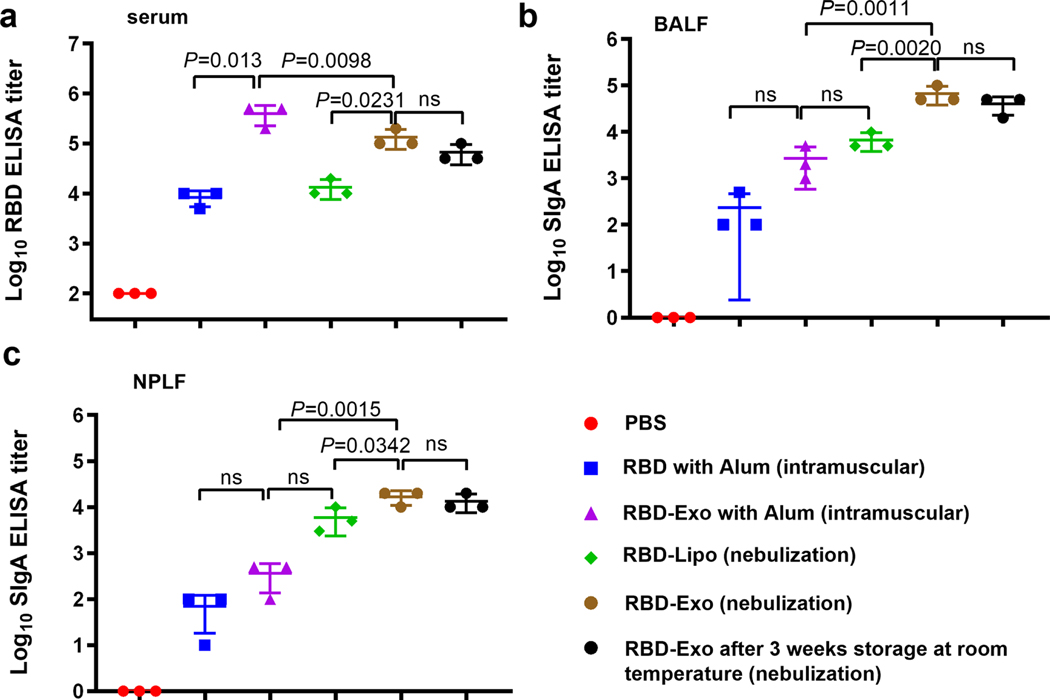
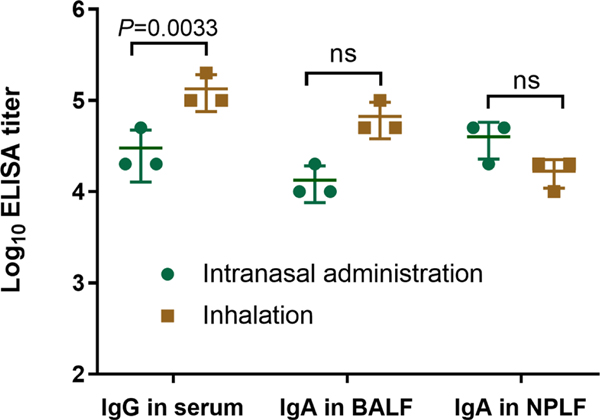
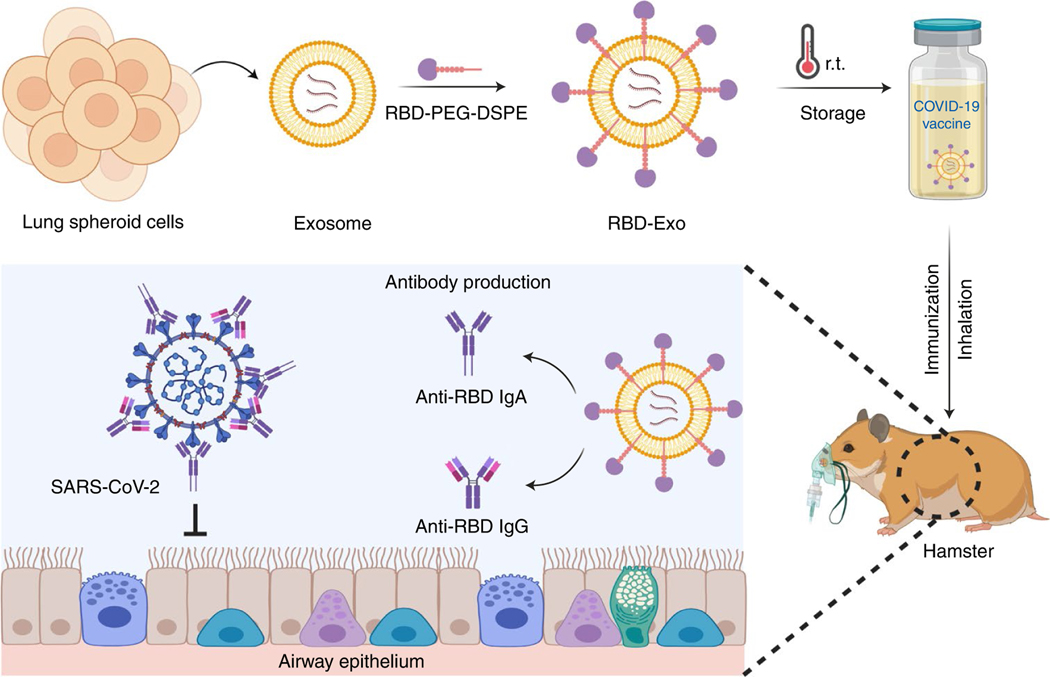
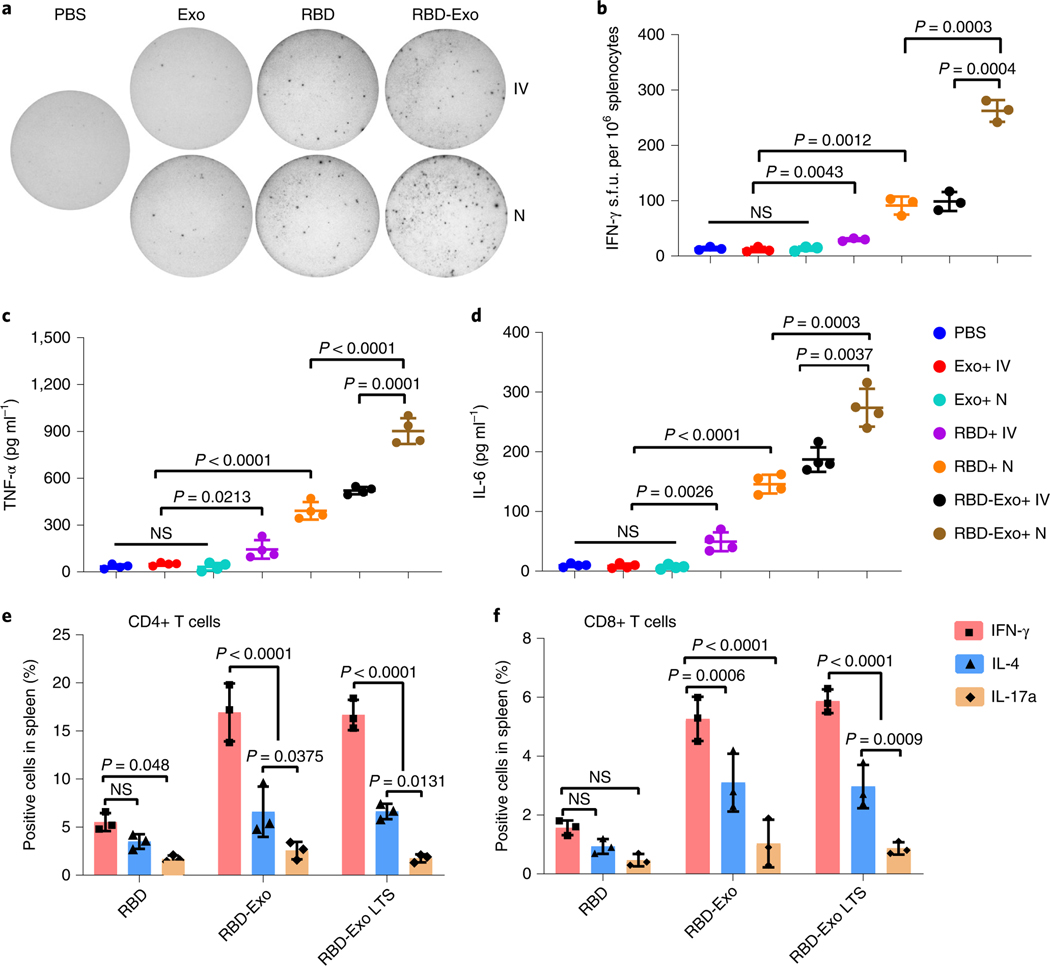
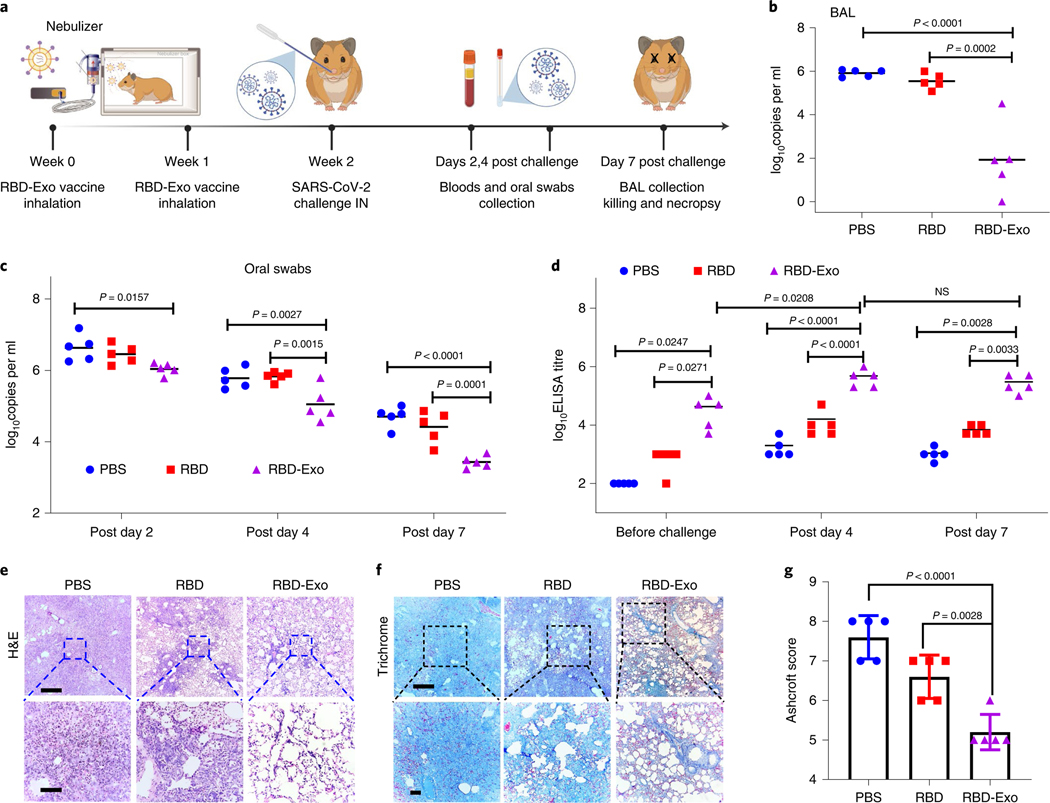
The first two mRNA vaccines against infection by severe acute respiratory syndrome coronavirus 2 (SARS-CoV-2) that were approved by regulators require a cold chain and were designed to elicit systemic immunity via intramuscular injection. Here we report the design and preclinical testing of an inhalable virus-like-particle as a COVID-19 vaccine that, after lyophilisation, is stable at room temperature for over three months. The vaccine consists of a recombinant SARS-CoV-2 receptor-binding domain (RBD) conjugated to lung-derived exosomes which, with respect to liposomes, enhance the retention of the RBD in both the mucus-lined respiratory airway and in lung parenchyma. In mice, the vaccine elicited RBD-specific IgG antibodies, mucosal IgA responses and CD4+ and CD8+ T cells with a Th1-like cytokine expression profile in the animals' lungs, and cleared them of SARS-CoV-2 pseudovirus after a challenge. In hamsters, two doses of the vaccine attenuated severe pneumonia and reduced inflammatory infiltrates after a challenge with live SARS-CoV-2. Inhalable and room-temperature-stable virus-like particles may become promising vaccine candidates.


Conflict of interest statement

Competing interests

The other authors declare no competing interests.

Figures

Extended Data Fig. 1 |
Extended Data Fig. 1 |. RBD-specific IgA and Igg responses.
a,b, RBD-specific IgA antibody titers in serum (a) of mice and RBD-specific IgG antibody titers in BALF (b) of mice detected by ELISA after two doses of immunizations with different treatments. Data are mean ± s.d. n = 3. Statistical analysis was performed by one-way ANOVA test with Bonferroni correction. ns indicates no significance. All replicates are biological.
Extended Data Fig. 2 |
Extended Data Fig. 2 |. Immunogenicity stability test of RBD-Exo after storage.
a-c, RBD-specific IgG antibody titer from murine serum (a) and RBD-specific secretory IgA antibody titer from bronchoalveolar lavage fluid (BALF) (b) and nasopharyngeal lavage fluid (NPLF) (c), detected by ELISA after two doses of immunizations with different treatments. Data are mean ± s.d. n = 3. Statistical analysis was performed by one-way ANOVA test with Bonferroni correction. ns indicates no significance. All replicates are biological.
Extended Data Fig. 3 |
Extended Data Fig. 3 |. Comparison of intranasal and inhalation immunization.
RBD-specific IgG antibodies in serum of mice and secretory IgA antibodies from BALF and NPLF of mice detected by ELISA, in which the mice were vaccinated with RBD-Exo VLP by intranasal administration or inhalation. Data are mean ± s.d. n = 3. Statistical analysis was performed by two-way ANOVA tests with a Tukey post hoc test for multiple comparisons. ns indicates no significance. All replicates are biological.
Extended Data Fig. 4 |
Extended Data Fig. 4 |. Biodistribution of RBD-Exo in mice after inhalation.
a, Ex vivo imaging of major organs of mice 24 hours after RBD-Exo-RhB or RBD-RhB inhalation. b, Quantification of the integrated density of RhB fluorescence in the major organs; n = 3 per group. c, Confocal images showing the biodistribution of RBD-Exo-RhB or RBD-RhB in heart, liver, spleen, lung, and kidney tissues. Scale bar, 50 μm. d, Quantitative results from in spleen tissues. n = 5. Data are mean ± s.d. Statistical analysis was performed by two-tailed, unpaired Student’s t-test. The replicates in b are biological. Analysis in d represents the technical replicates from three independent biological samples.
Fig. 1 |
Fig. 1 |. Inhalation of the RBD-Exo VLP vaccine induces SARS-CoV-2 neutralization in hamsters and protects their lungs.
Schematic representation of the fabrication of the RBD-Exo vaccine, which is delivered into the lungs via inhalation. RBD-Exo induces mucosal immunity and systemic immunity with the generation of RBD-specific IgA and IgG antibodies against SARS-CoV-2 infection in hamsters. This schematic was created with BioRender.com.
Fig. 2 |
Fig. 2 |. Lung distribution of the RFP-loaded LSC-exosomes.
a, The experimental study schematic of RFP-loaded LSC-exosomes and RFP-loaded liposomes in healthy CD1 mice, n = 3 per group. b, Ex vivo imaging of mouse lungs after RFP-loaded LSC-exosome or RFP-loaded liposome delivery after 4 and 24 h. c, Quantification of the integrated density of RFP fluorescence in ex vivo mouse lungs; each dot represents data from one lung, n = 3 per group. d, Immunostaining of whole lung, tracheal, bronchial and parenchymal sections for DAPI (blue), phalloidin (green) and exosomes (red) or liposomes (red). These images were obtained under ×10 magnification. T, trachea; B, bronchioles; P, parenchyma. Scale bar, 1,000 μm for whole lung, 100 μm for parenchyma. e, Quantification of the integrated density of RFP fluorescence across all groups in tracheal, bronchial and parenchymal tiles from whole lung images; each dot represents data from one image tile, n = 12–276. fh, Quantification of the integrated density of RFP fluorescence in tracheal (f), bronchial (g) and parenchyma (h) tiles from whole lung images; each dot represents data from one image tile, n = 2–82. i, Immunostaining of parenchymal sections for DAPI (blue), CD11b (green), and exosomes (red) or liposomes (red). Scale bar, 50 μm. j, Quantification of exosome or liposome uptake by CD11b+ APCs in ex vivo mouse lungs; numbers in red indicate total number of positive cells across all representative images, n = 6 images per group. EV, extracellular vesicle. Throughout, data are mean ± s.d. P values were calculated by one-way ANOVA with Bonferroni correction. The replicates in c are biological. Analysis in eh, and j represents the technical replicates. The schematic in a was created with BioRender.com.
Fig. 3 |
Fig. 3 |. Characterization of RBD-Exo and its stability.
a, Schematic illustrating the preparation of LSC-Exo with RBD to generate RBD-Exo. b, SDS–PAGE gel of RBD and RBD-PEG-DSPE. c, TEM images of LSC-Exo and RBD-Exo. RBD was discovered using gold nanoparticle-labelled secondary antibodies with diameters of 15 nm. d, Immunoblots of RBD and CD63 in lysed RBD-Exo, RBD and Exo. e, Size measurements of LSC-Exo (left) and RBD-Exo (right) via NTA. fi, TEM images (f), concentrations (g), size change (h) and RBD level change (i) of RBD-Exo after storing at −80 °C, 4 °C and r.t. for 3 weeks (3W) or 3 months (3M). RBD level was calculated using the ratio of the level in the treatment group to that in the pre-lyophilisation group (Pre-lyo), n = 5 per group in g and h, n = 4 per group in i. j, Summary of stability data of RBD-Exo over 3 weeks or 3 months. k, Left: representative immunostaining of C57BL/6 dendritic cells for DAPI (blue) and RBD-RhB (red) or RBD-RhB-Exo (red). Right: flow cytometry analysis of RBD and RBD-Exo internalization by C57BL/6 dendritic cells, n = 3. Scale bar, 50 μm. Data are mean ± s.d., P values calculated by two-tailed, unpaired Student’s t-test (k) or one-way ANOVA with Bonferroni correction (gi). NS, not significant. All replicates are biological. The uncropped gel (b) and blots (d) are provided in Source Data 3. The schematic in a was created with BioRender.com.
Fig. 4 |
Fig. 4 |. Vaccination with RBD-Exo induces antibody production and enhances the clearance of SARS-CoV-2 mimics in mice.
a, Schematic illustrating animal study design. b, Ex vivo imaging of the lungs of mice after intratracheal delivery of SARS-CoV-2 mimics at different time points. c, Semi-quantitative analysis of SARS-CoV-2 mimics labelled with AF647 from confocal images of lung tissues, n = 4. d, Anti-RBD antibody titre from murine serum detected by ELISA, n = 3. e, Ratio of RBD-specific IgG2a to IgG1 antibody generated, n = 3. f,g, RBD-specific SIgA antibody titres from NPLF (f) and BALF (g) detected by ELISA, n = 3. h,i, IFN-γ+, IL-4+ or IL-17a+ of CD4+ T cells (h) and CD8+ T cells (i) specific to the RBD peptide pool in the lung at week 1 after second vaccination. RBD-Exo LTS, RBD-Exo reconstitution after 3 weeks of storage at room temperature, n = 3. Throughout, data are mean ± s.d., statistical analysis by two-tailed, unpaired Student’s t-test (cg) or two-way ANOVA with a Tukey post hoc test for multiple comparisons (h,i). All replicates are biological. The schematic in a was created with BioRender.com.
Fig. 5 |
Fig. 5 |. Induction of systemic cytokines in mice vaccinated with RBD-Exo.
a, IFN-γ release spots in a 96-well plate with 106 splenocytes per well after rechallenge with RBD. Splenocytes were derived from each treatment group that received IV or N administration. b, IFN-γ splenocytes shown as s.f.u. per 106 cells, n = 3. c, TNF-α levels from splenocytes supernatant restimulated by RBD, n = 4. d, IL-6 levels from splenocytes supernatant restimulated by RBD, n = 4. e,f, IFN-γ+, IL-4+ or IL-17a+ CD4+ T cells (e) and CD8+ T cells (f) specific to an RBD peptide pool in the splenocytes at week 1 after the last vaccination, n = 3. Throughout, data are mean ± s.d., statistical analysis by two-tailed, unpaired Student’s t-test (bd) or two-way ANOVA with a Tukey post hoc test for multiple comparisons (e,f). All replicates are biological.
Fig. 6 |
Fig. 6 |. Protective effect of the RBD-Exo vaccine in the Syrian hamster model of SARS-CoV-2 infection.
a, Schematic showing hamster study design. b, Impact of RBD-Exo on viral genomic RNA (gRNA) in BAL fluid at 7 d post challenge. c, Impact of RBD-Exo on viral gRNA in oral swabs at the indicated time points. d, RBD-specific binding antibody from hamster serum at week 2 (1 d before challenge), 4 d and 7 d after viral challenge as detected by ELISA. e,f, H&E (e) and Masson’s trichrome (f) images of lung tissues from hamsters at 7 d post challenge. Scale bars, 500 μm (top), 100 μm (bottom). g, Quantitation of lung fibrosis of challenged hamsters by Ashcroft scoring performed blindly. Throughout, each dot stands for data from one animal, n = 5. Data are mean ± s.d., P values calculated by one-way ANOVA with Bonferroni correction. All replicates are biological. The schematic in a was created with BioRender.com.
Fig. 7 |
Fig. 7 |. Histopathological changes and RNAscope analysis in Syrian hamsters vaccinated with RBD-Exo.
a, SARS-N IHC staining of lung tissues in hamsters vaccinated with PBS, RBD or RBD-Exo at 7 d post viral challenge. Scale bar, 100 μm. b, Immunofluorescence images of pan-CK (green), SARS-N (magenta) and DAPI (blue) of lung tissues in hamsters to study the distribution of SARS-N. Scale bar, 50 μm. c, RNAscope in situ hybridization detection of vRNA in lung tissues of hamsters at 7 d post challenge. Scale bar, 100 μm. d, Immunofluorescence images of Iba-1 (red), CD206 (green), SARS-N (greyscale) and DAPI (blue) of lung tissues in hamsters at 7 d post challenge. Scale bar, 50 μm. e, IHC staining of MPO, CD3 T lymphocytes and interferon inducible gene MX1 of hamsters at 7 d post challenge. Scale bar, 100 μm. f, Quantitation of SARS-N positive cells of lung tissues in hamsters. Each dot represents data from one image file, n = 15. gi, Quantitation of positive MPO (g), CD3 (h) and MX1 (i) cell numbers in lung tissues of hamsters. Each dot stands for data from one image file, n = 15. Throughout, data are mean ± s.d., P values calculated by one-way ANOVA with Bonferroni correction. Analysis in fi represents technical replicates from 5 independent biological samples.
Fig. 8 |
Fig. 8 |. RBD-Exo VLP efficiently neutralizes the SARS-CoV-2 D614g pseudovirus.
a, Ex vivo imaging of lungs of immunized mice after inoculation with SARS-CoV-2 D614G pseudovirus with GFP expression for 24 h. b, Quantification of the integrated density of GFP fluorescence in ex vivo mouse lungs; each dot represents data from one lung, n = 3 per group. c, Immunostaining imaging of whole lung (top row), trachea/bronchioles (middle row) and parenchyma (bottom row) of mice with different vaccinations for DAPI (blue), phalloidin (red) and SARS-CoV-2 D614G pseudovirus (green), and immunohistochemistry staining of spike protein of SARS-CoV-2 D614G pseudovirus (SARS-S, bottom row) in lung tissue after different vaccinations. Whole lung images were taken under ×10 magnification. Scale bar, 50 μm. d,e Quantification of the integrated density of GFP fluorescence in tracheal/bronchial (d) and parenchymal tiles (e) from whole lung images. Each dot represents data from one image tile, n = 43–55. f, Quantitation of positive spike protein cell numbers in lung tissues. Each dot stands for data from one image, n = 6. g, SARS-CoV-2 D614G pseudovirus-infected primary bronchial/tracheal epithelial cells with GFP expression, inhibited by IgA antibodies purified from vaccinated mice. Scale bar, 50 μm. h, Flow cytometry plots of SARS-CoV-2 D614G pseudovirus-infected primary small airway epithelial cells, which were inhibited by IgA antibodies purified from vaccinated mice, n = 3 per group. i,j, Purified IgG and IgA pseudovirus neutralization assay (i) and IC50 values (j), n = 3 per group in i; n = 9 per group in j. Data are mean ± s.d., statistical analysis by one-way ANOVA with Bonferroni correction (b, df, h) or two-tailed, unpaired Student’s t-test (j). The replicates in b, h and i are biological. Analysis in df and j represents technical replicates from 3 independent biological samples.

References

    1. Wang C, Horby PW, Hayden FG & Gao GF A novel coronavirus outbreak of global health concern. Lancet 395, 470–473 (2020). - PMC - PubMed
    1. Guan W-j et al. Clinical characteristics of coronavirus disease 2019 in China. N. Engl. J. Med 382, 1708–1720 (2020). - PMC - PubMed
    1. Sharma K. et al. Vaccines for COVID-19: where do we stand in 2021? Paediatr. Respir. Rev 39, 22–31 (2021). - PMC - PubMed
    1. King RG et al. Single-dose intranasal administration of AdCOVID elicits systemic and mucosal immunity against SARS-CoV-2 and fully protects mice from lethal challenge. Vaccines 9, 881 (2021). - PMC - PubMed
    1. Hassan AO et al. A single-dose intranasal ChAd vaccine protects upper and lower respiratory tracts against SARS-CoV-2. Cell 183, 169–184 (2020). - PMC - PubMed

Publication types