. 2023 Feb;39(2):213-244.
doi: 10.1007/s12264-022-00897-8. Epub 2022 Jul 5.

Spatiotemporal Dynamics of the Molecular Expression Pattern and Intercellular Interactions in the Glial Scar Response to Spinal Cord Injury

Affiliations

Spatiotemporal Dynamics of the Molecular Expression Pattern and Intercellular Interactions in the Glial Scar Response to Spinal Cord Injury

Leilei Gong et al. Neurosci Bull. 2023 Feb.

Abstract

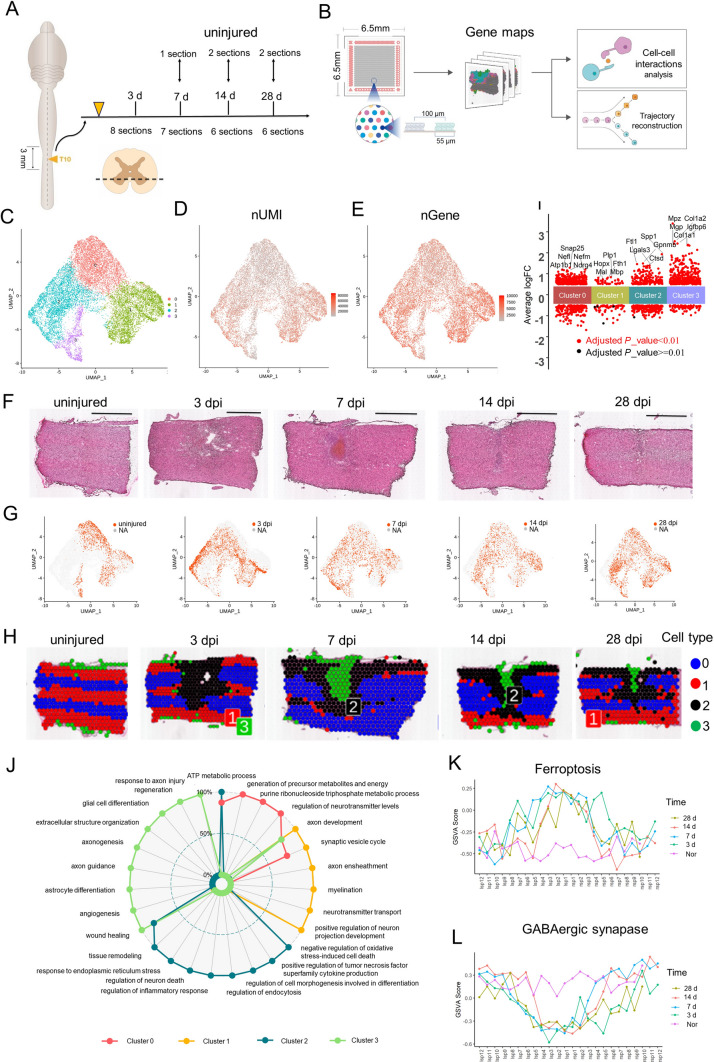
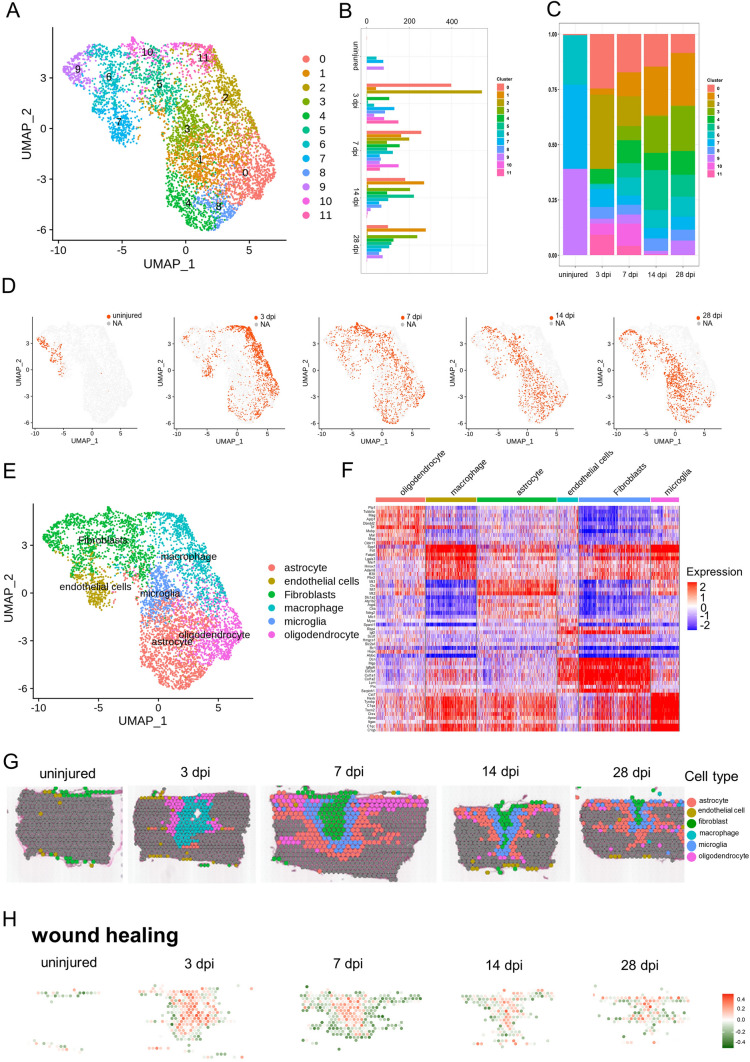
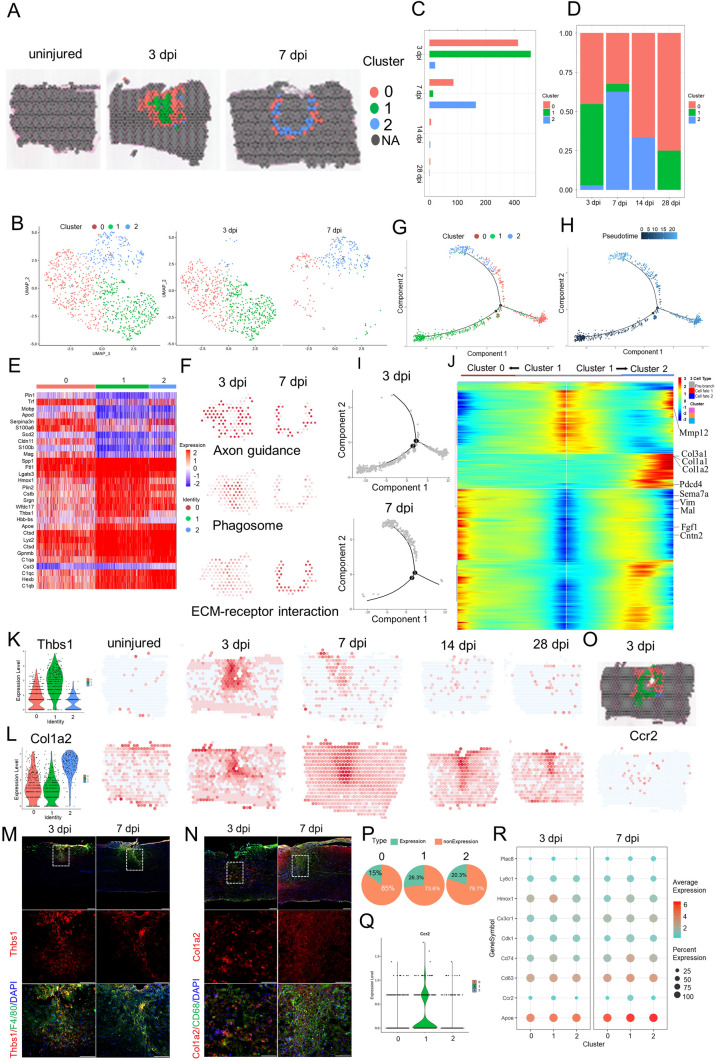
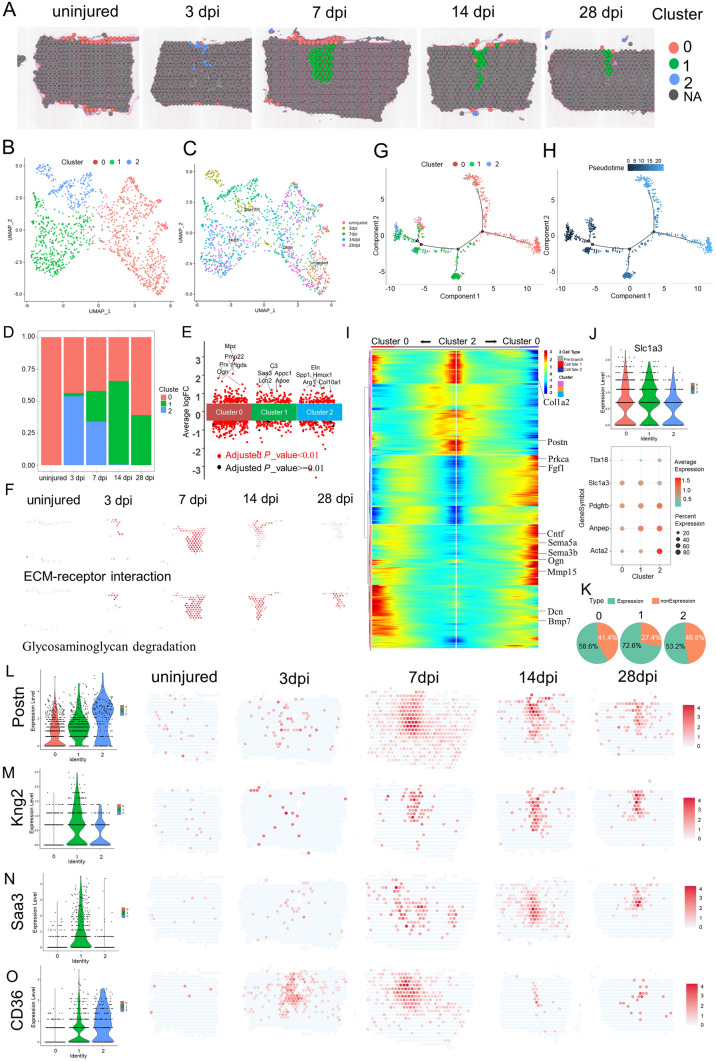
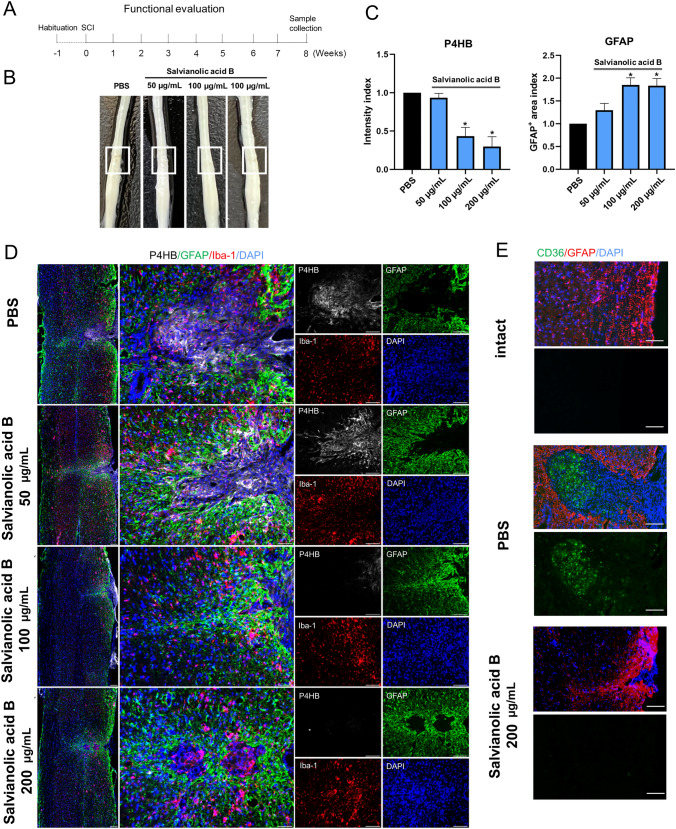
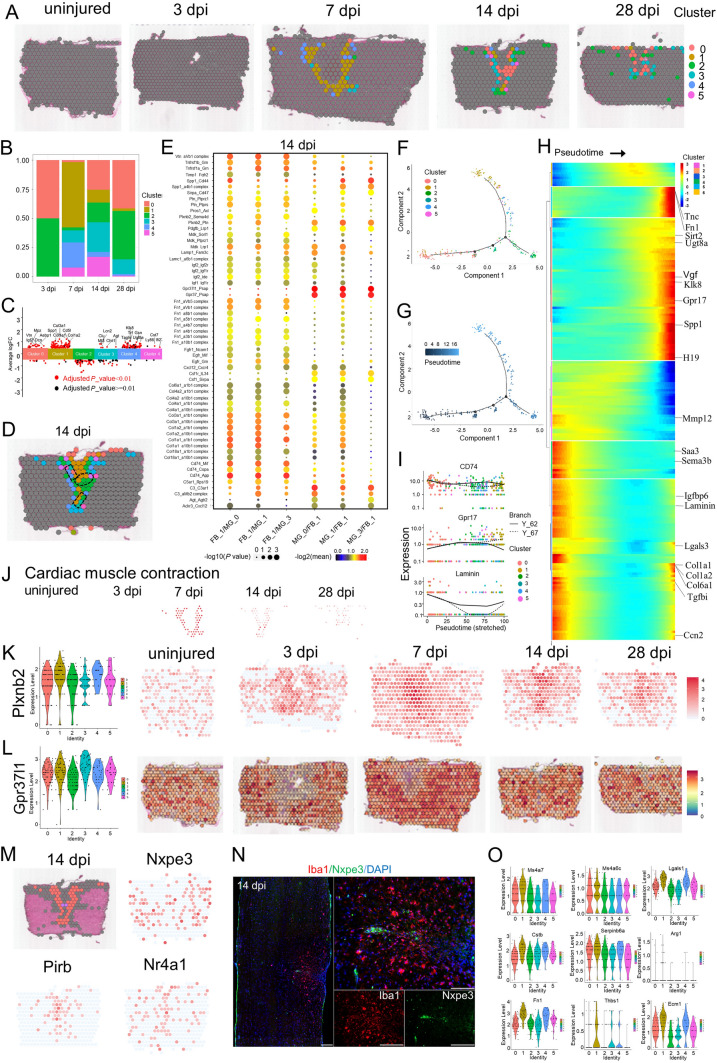
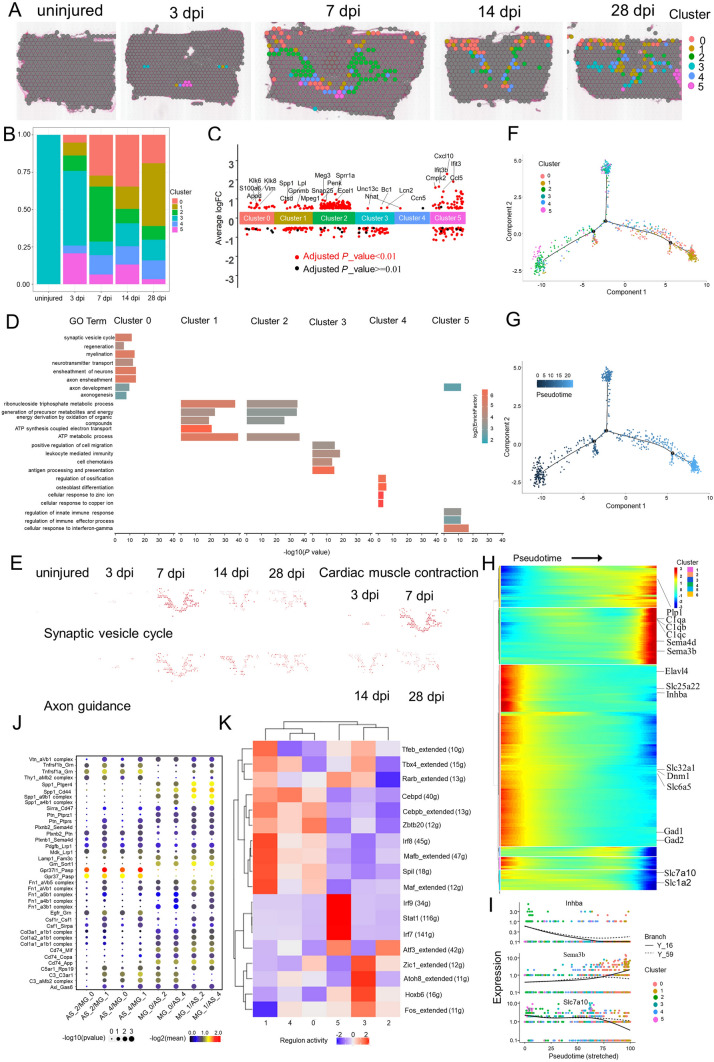
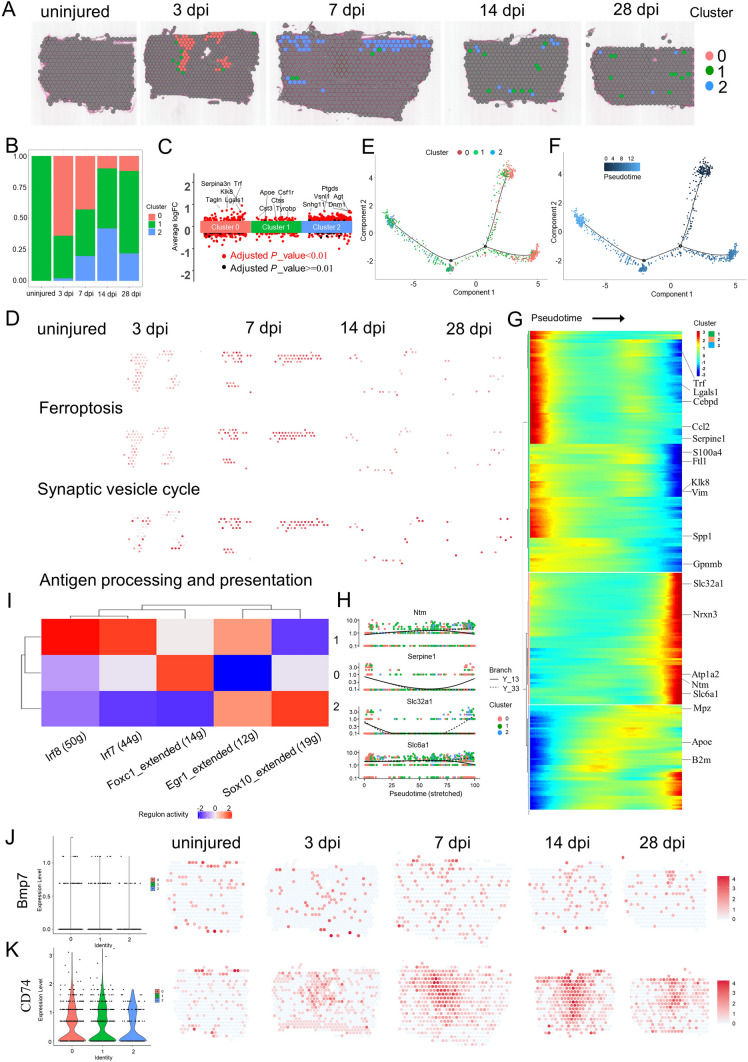
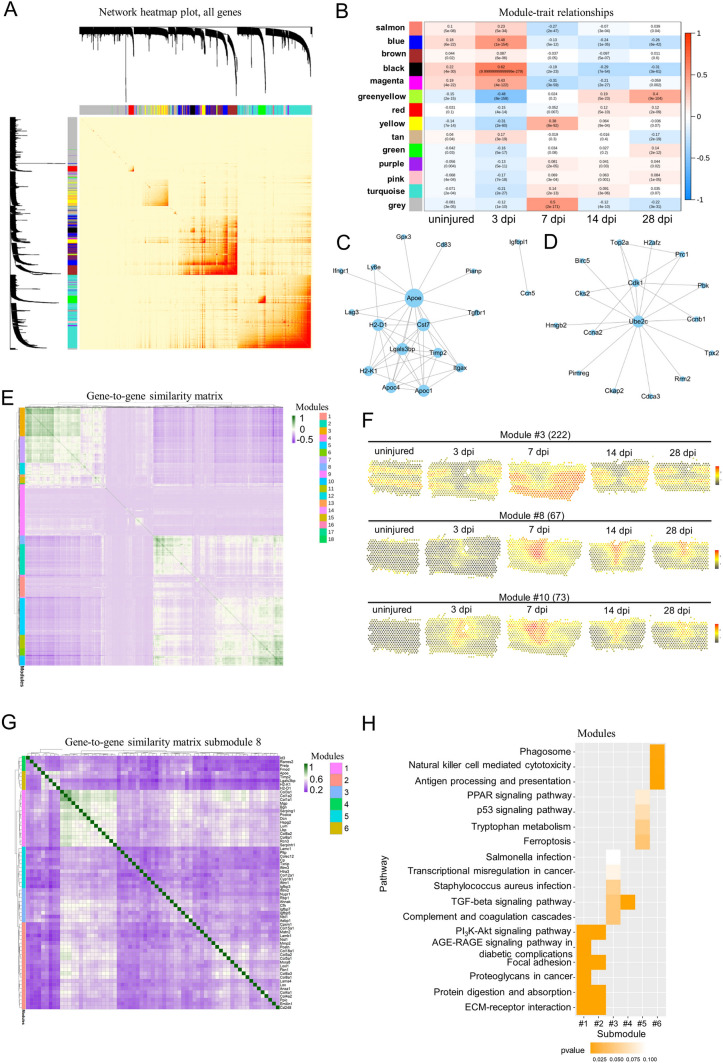
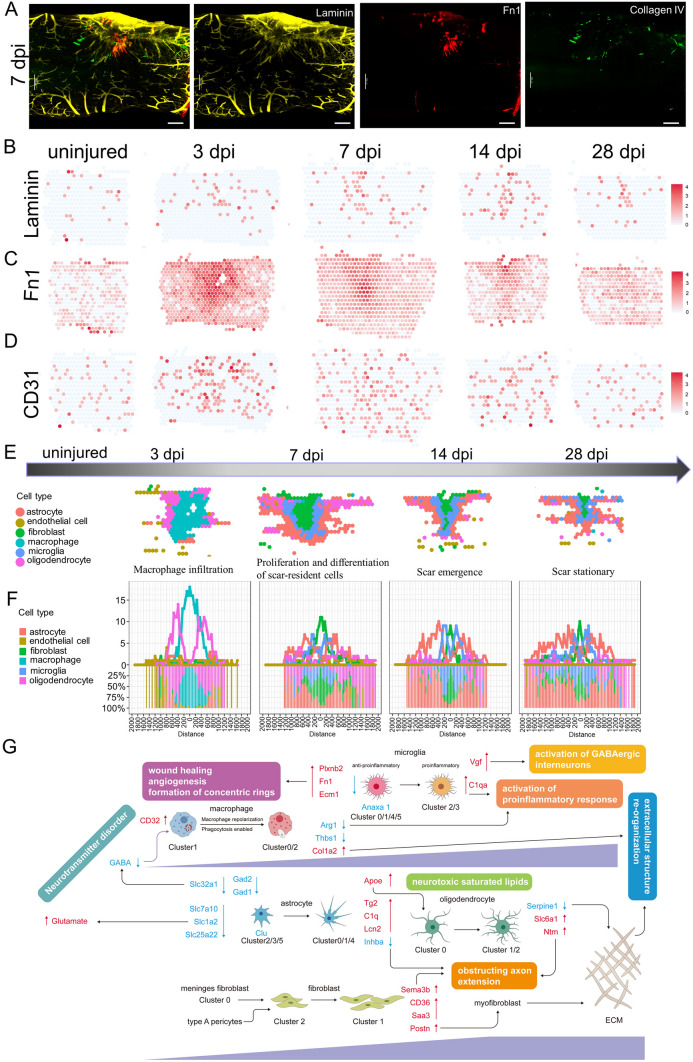
Nerve regeneration in adult mammalian spinal cord is poor because of the lack of intrinsic regeneration of neurons and extrinsic factors - the glial scar is triggered by injury and inhibits or promotes regeneration. Recent technological advances in spatial transcriptomics (ST) provide a unique opportunity to decipher most genes systematically throughout scar formation, which remains poorly understood. Here, we first constructed the tissue-wide gene expression patterns of mouse spinal cords over the course of scar formation using ST after spinal cord injury from 32 samples. Locally, we profiled gene expression gradients from the leading edge to the core of the scar areas to further understand the scar microenvironment, such as neurotransmitter disorders, activation of the pro-inflammatory response, neurotoxic saturated lipids, angiogenesis, obstructed axon extension, and extracellular structure re-organization. In addition, we described 21 cell transcriptional states during scar formation and delineated the origins, functional diversity, and possible trajectories of subpopulations of fibroblasts, glia, and immune cells. Specifically, we found some regulators in special cell types, such as Thbs1 and Col1a2 in macrophages, CD36 and Postn in fibroblasts, Plxnb2 and Nxpe3 in microglia, Clu in astrocytes, and CD74 in oligodendrocytes. Furthermore, salvianolic acid B, a blood-brain barrier permeation and CD36 inhibitor, was administered after surgery and found to remedy fibrosis. Subsequently, we described the extent of the scar boundary and profiled the bidirectional ligand-receptor interactions at the neighboring cluster boundary, contributing to maintain scar architecture during gliosis and fibrosis, and found that GPR37L1_PSAP, and GPR37_PSAP were the most significant gene-pairs among microglia, fibroblasts, and astrocytes. Last, we quantified the fraction of scar-resident cells and proposed four possible phases of scar formation: macrophage infiltration, proliferation and differentiation of scar-resident cells, scar emergence, and scar stationary. Together, these profiles delineated the spatial heterogeneity of the scar, confirmed the previous concepts about scar architecture, provided some new clues for scar formation, and served as a valuable resource for the treatment of central nervous system injury.

Keywords: Glial scar; Microenvironment; Salvianolic acid; Spatial transcriptomics; Spinal cord injury; Therapeutic strategy.


Conflict of interest statement

The authors declare that they have no conflict of interests.

Figures

Fig. 1
Fig. 1
Generation of a spatiotemporal transcriptional atlas of the mouse glial scar. A Overview of the study design for glia scar formation and location of sections used in this study. B Experimental workflow and analysis for spatial RNA-seq of the glia scar in adult mouse at four stages of scar maturation after T10 right lateral hemisection. The spatial microarrays had 4,992 spatially-barcoded spots 55 µm in diameter and a 100-µm center-to-center distance. The Spatial Transcriptomic (ST) procedure yielded matrices with read counts for every gene in every spot, which were then decomposed by a set of factors (“cell types”). C Uniform Manifold Approximation and Projection (UMAP) plot of spots from all sections visualized using Seurat package and profiling the cell clusters. (D, E) UMAP profiling the number of expressed unique molecular identifier (nUMI) and genes (nGene). F H&E staining images showing the changes in pathological morphology of glia scar maturation (scale bar, 1,000 µm). G UMAP profiles of the spots at different times after injury. H UMAP spots mapped to their spatial locations. I The top 5 highest differentially-expressed genes in each cluster. J Gene Ontology analysis data enriched for each cluster. K GSVA scores of the ferroptosis signaling pathway counted at three stages in Layer 3. L GSVA scores of the GABAergic synapse pathway counted at three stages in Layer 3.
Fig. 2
Fig. 2
Cataloguing resident cells during glial scar maturation with ST. A UMAP spots showing the re-clustering analysis of cluster 2 cells and cluster 3 cells from four stages of scar maturation. B Histogram showing the number of spots in each subpopulation. C Bar plot showing the fraction of all spots comprising each subpopulation at different stages of scar maturation. D UMAP spots embedding overlay showing the distribution of spots at different time points after injury. E UMAP spots embedding overlay showing the six main cell clusters at different time points after injury. F Heat map showing the top 10 markers for the annotation of individual clusters shown as fraction of expression (color) of gene markers (columns). G Spatial maps showing the six main cell clusters at different time points after injury. H Spatial maps showing the GSVA scores of wound healing enriched in the six main cell clusters at different time points after injury.
Fig. 3
Fig. 3
Phenotypic and functional heterogeneity of macrophage in the glial scar. A Spatial maps showing the distribution of three macrophage clusters in the glial scar at 3 and 7 dpi. B UMAP spots showing the three clusters of macrophages in the glial scar at 3 and 7 dpi. C Histogram showing the number of spots in each subpopulation at different time points after injury. D Bar plot showing the fraction of all spots comprising each subpopulation at different time points after injury. E Heat map showing the top 10 markers for the annotation of individual clusters shown as fraction of expression (color) of gene markers (columns). F Spatial maps showing the GSVA score of the axon guidance pathway enrichment in cluster 0 cells, phagosome pathway enrichment in cluster 1 cells and ECM-receptor interaction pathway enrichment in cluster 2 cells at different time points after injury. G–I Trajectory of macrophages in the glial scar from cluster 1 cells into clusters 0/2. J Heat map showing the gene expression dynamics along the trajectory. K Violin plots and spatial maps showing the expression of Thbs1 at different time points after injury. L Violin plots and spatial maps showing the expression of Col1a2 at different time points after injury. M Immunofluorescence (IF) in 3 dpi and 7 dpi scars stained for Thbs1 (red), F4/80 (green), and DAPI (blue) confirming that Thbs1 is overexpressed in the three macrophage clusters (n = 3; scale bar, 200 µm). N IF in 3 dpi and 7 dpi scars stained for Col1a2 (red), CD68 (green), and DAPI (blue) confirming that Col1a2 is overexpressed in the three macrophage clusters (n = 3; scale bar, 200 µm). O Spatial maps showing the distribution of the three macrophage clusters in the glial scar at 3 dpi and the expression of Ccr2 at 3 dpi. P Pie chart showing the percentages of Ccr2+ cells in the three macrophage clusters (n = 27). Q Violin Plots showing the expression of Ccr2 in the three macrophage clusters (n = 27). R Dot plots showing the marker genes that best identify each cell type.
Fig. 4
Fig. 4
Phenotypic and functional heterogeneity of fibroblasts in the glial scar. A Spatial maps showing the distribution of the three fibroblast clusters in the glial scar at different time points after injury. B UMAP spots showing the three clusters of fibroblasts in the glial scar. C UMAP spots embedding overlay showing the distribution of spots at different time points after injury. D Bar plot showing the fraction of all spots comprising each subpopulation at different time points after injury. E Jitterplot showing the top 5 differentially-expressed genes. F Spatial maps showing the GSVA scores of the ECM-receptor interaction pathway enrichment in cluster 2 cells and the glycosaminoglycan degradation pathway enrichment in cluster 1 cells at different time points after injury. G, H Trajectory of fibroblasts in the glial scar. I Heat map showing the upregulated or downregulated genes in different cell fates. J Violin plots showing the expression of Slc1a3 in the three clusters. K Dot plots showing the marker genes that best identify type A pericytes. L Pie chart showing the percentages of Slc1a3+ cells in the three fibroblast clusters (n = 32). M Violin plots and spatial maps showing the expression of Postn, a myofibroblast differentiation marker, at different time points after injury. N Violin plots and spatial maps showing the expression of Kng2 at different time points after injury. O Violin plots and spatial maps showing the expression of Saa3, an inflammatory ligand, at different time points after injury.
Fig. 5
Fig. 5
Pharmacological blockade of CD36 restrains fibrosis. A Experimental workflow and analysis for SAB treatment after T10 right lateral hemisection. B Representative images of injured mouse spinal cords treated with PBS and with SAB (50, 100, and 200 µg/mL) at 8 weeks post-infarction. The injury site is boxed in white. C, D SAB treatment reduces accumulation of P4HB+ cells in the scar core and promotes GFAP+ cells crossing the scar core and forming bridges in mice treated with SAB (200 µg/mL) (scale bar, 200 µm). E SAB treatment reduces the expression of CD36 in the scar core (scale bar, 100 µm).
Fig. 6
Fig. 6
Phenotypic and functional heterogeneity of microglia in the glial scar. A Spatial maps showing the distribution of 6 microglia clusters in the glial scar at different time points after injury. B Bar plot showing the fraction of all spots comprising each subpopulation at different time points after injury. C Jitterplot showing the top 5 differentially-expressed genes (DEGs) in each subpopulation. D Definition of the boundary areas to study the interaction between two neighboring microglia clusters in the scar. Regions 2 spots wide along the boundary lines in each cluster are selected. E Dot plot showing the mean interaction scores between neighboring clusters at the boundaries for ligand-receptor pairs. The ligand-receptor pairs are listed on the left. The size of a circle denotes the p-value, and the color denotes the mean interaction score. F, G Trajectory of microglia in the glial scar. H Heat map showing the changes in genes expression along a spatial trajectory. I Correlation of the expression of CD74, Gpr17, and laminin with pseudotime. J Spatial maps showing the GSVA score of the cardiac muscle contraction pathway enrichment in cluster 1 cells at different time points after injury. K Violin plots and spatial maps showing the expression of Plxnb2 at different time points after injury. L Violin plots and spatial maps showing the expression of Gpr37l1 at different time points after injury. M Spatial maps showing the expression of selected DEGs in spots that cross the fibroblast scar and form bridges at 14 dpi. N IF-stained 14-dpi scars for Nxpe3 (red) and DAPI (blue) (scale bars, 200 µm). O Violin plots showing the expression of selected genes contributing to microglia-organized scar-free spinal cord repair in neonatal mice.
Fig. 7
Fig. 7
Phenotypic and functional heterogeneity of astrocytes in the glial scar. A Spatial maps showing the distribution of 6 astrocyte clusters in the glial scar at different time points after injury. B Bar plot showing the fraction of all spots comprising each subpopulation at different time points after injury. C Jitterplot showing the top 5 differentially expressed genes in each subpopulation. D Selected GO terms that were enriched for each cluster using Fisher’s exact test. E Spatial maps showing the GSVA score of the synaptic vesicle cycle and axon guidance pathways enriched in cluster 0 cells, and the cardiac muscle contraction pathway enriched in cluster 1 cells at different time points after injury. F, G Trajectory of astrocyte in the glial scar. H Heat map showing the changes in gene expression along a spatial trajectory. I Expression of Inhba, Sema3b, and Slc7a10 correlates with pseudotime. J Dot plot showing the mean interaction scores between neighboring clusters at the boundaries for ligand-receptor pairs. The ligand-receptor pairs are listed on the left. The size of a circle denotes the p-value and the color denotes the mean interaction score. K Heat map showing the enriched transcription factors by single-cell regulatory network inference and clustering analysis in different clusters after injury.
Fig. 8
Fig. 8
Phenotypic and functional heterogeneity of oligodendrocytes in the glial scar. A Spatial maps showing the distribution of 3 oligodendrocyte clusters in the glial scar at different time points after injury. B Bar plot showing the fraction of all spots comprising each subpopulation at different time points after injury. C Jitterplot showing the top 5 differentially expressed genes in each subpopulation. D Spatial maps showing the GSVA scores of ferroptosis pathway enrichment in cluster 0 cells, antigen processing and presentation pathway enrichment in cluster 1 cells, and synaptic vesicle cycle pathway enrichment in cluster 2 cells at different time points after injury. E, F Trajectory of oligodendrocytes in the glial scar. G Heat map showing the changes in gene expression along a spatial trajectory. H Expression of Ntm, Serpine1, Slc32a1, and Slc6a1 is correlated with pseudotime. I Heat map showing the enriched transcription factors by single-cell regulatory network inference and clustering analysis in different clusters after injury. J Violin plots and spatial maps showing the expression of Bmp7 at different time points after injury. K Violin plots and spatial maps showing the expression of CD74 at different time points after injury.
Fig. 9
Fig. 9
Spatiotemporal dynamics of gene expression during maturation of the scar. A Hierarchical clustering showing the network of the correlation of module membership and gene significance, as well as the correlation among all genes. B Heatmap depicting the correlation scores (digit in the box above) as well as its corresponding P-value (digit in the box below) of modules (rows) and different times after injury (columns). C Co-expression of selected hub gene enrichment in Megreenyellow. The networks are created by Cytoscape. D Co-expression network of selected hub gene enrichment in Meblue using Cytoscape. E Biclustering of the spatial gene expression measurements reveal spatially and temporally co-expressed genes. Identifiers of co-expression modules are listed. F Average spatiotemporal expression dynamics of modules 3, 8, and 10. G Hierarchical clustering of genes in module 8. H Analysis of enriched KEGG pathways among the genes for the submodules in G.
Fig. 10
Fig. 10
Visualization and interpretation of the scar with transparency and ST. A IF-stained 7-dpi scars for laminin (yellow), Fn1 (red), and collagen IV (green) showing the extent of the scar boundary (scale bars, 200 µm). B–D Spatial maps showing the expression of laminin (B) Fn1 (C), and CD31 (D) at different time points after injury. E ST showing the extent of the scar boundary of different cell types. F Quantification of the number and fraction of spots representing astrocytes, endothelial cells, fibroblasts, macrophages, microglia, and oligodendrocytes. G Summary of the changes in key genes and biological processes after SCI.

Similar articles

Cited by

References

    1. Alizadeh A, Dyck SM, Karimi-Abdolrezaee S. Traumatic spinal cord injury: An overview of pathophysiology, models and acute injury mechanisms. Front Neurol. 2019;10:282. - PMC - PubMed
    1. Anjum A, Yazid MD, Fauzi Daud M, Idris J, Ng AMH, Selvi Naicker A, et al. Spinal cord injury: Pathophysiology, multimolecular interactions, and underlying recovery mechanisms. Int J Mol Sci. 2020;21:7533. - PMC - PubMed
    1. Courtine G, Sofroniew MV. Spinal cord repair: Advances in biology and technology. Nat Med. 2019;25:898–908. - PubMed
    1. Zhao JL, Roberts A, Wang ZL, Savage J, Ji RR. Emerging role of PD-1 in the central nervous system and brain diseases. Neurosci Bull. 2021;37:1188–1202. - PMC - PubMed
    1. Wang H, Zhou WX, Huang JF, Zheng XQ, Tian HJ, Wang B, et al. Endocrine therapy for the functional recovery of spinal cord injury. Front Neurosci. 2020;14:590570. - PMC - PubMed

Substances