. 2022 Jul;54(7):1037-1050.
doi: 10.1038/s41588-022-01089-w. Epub 2022 Jul 4.

Multiomic atlas with functional stratification and developmental dynamics of zebrafish cis-regulatory elements

Affiliations

Multiomic atlas with functional stratification and developmental dynamics of zebrafish cis-regulatory elements

Damir Baranasic et al. Nat Genet. 2022 Jul.

Abstract

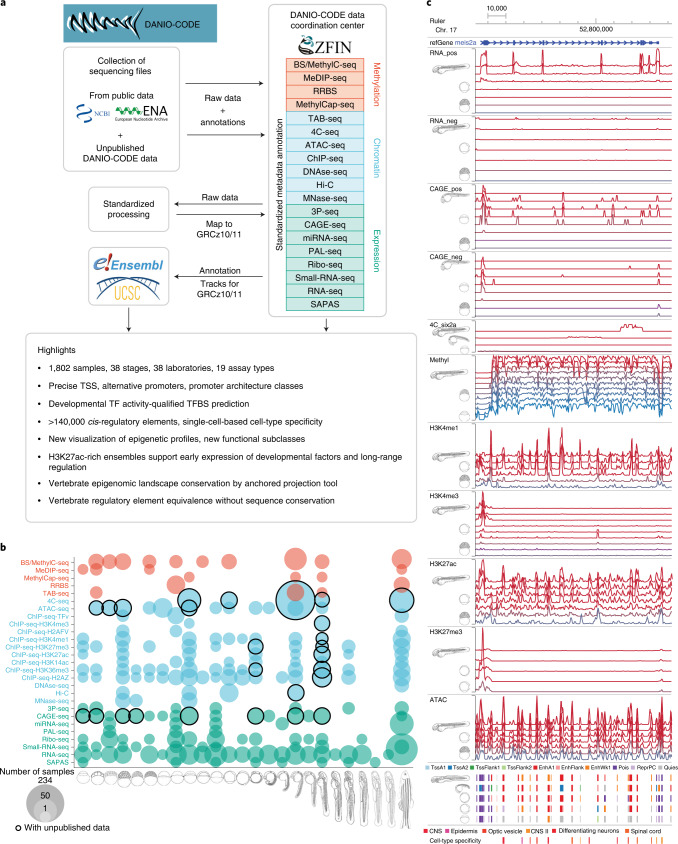
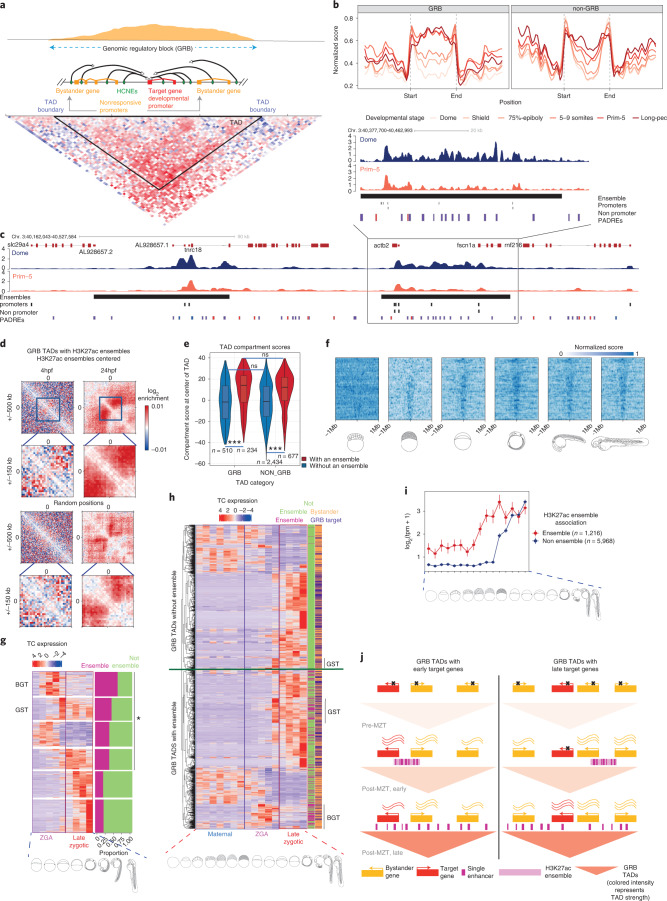
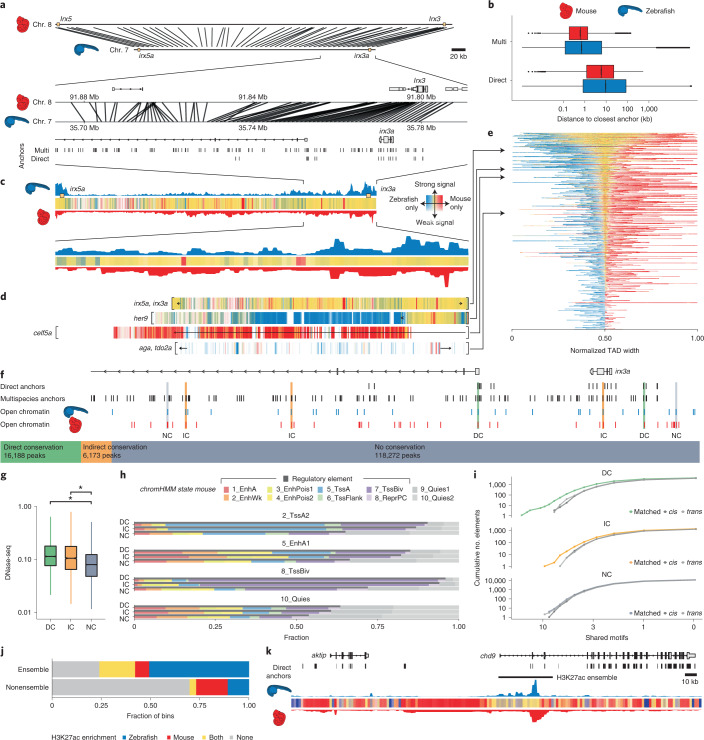
Zebrafish, a popular organism for studying embryonic development and for modeling human diseases, has so far lacked a systematic functional annotation program akin to those in other animal models. To address this, we formed the international DANIO-CODE consortium and created a central repository to store and process zebrafish developmental functional genomic data. Our data coordination center ( https://danio-code.zfin.org ) combines a total of 1,802 sets of unpublished and re-analyzed published genomic data, which we used to improve existing annotations and show its utility in experimental design. We identified over 140,000 cis-regulatory elements throughout development, including classes with distinct features dependent on their activity in time and space. We delineated the distinct distance topology and chromatin features between regulatory elements active during zygotic genome activation and those active during organogenesis. Finally, we matched regulatory elements and epigenomic landscapes between zebrafish and mouse and predicted functional relationships between them beyond sequence similarity, thus extending the utility of zebrafish developmental genomics to mammals.


Conflict of interest statement

The authors declare no competing interests.

Figures

Fig. 1
Fig. 1. Comprehensive collection and annotation of zebrafish developmental genomic data.
a, Collection and manual annotation processes of datasets with the DANIO-CODE DCC with highlights of key findings. b, Extent of the open repository for developmental multiomic data for zebrafish with assay type (y axis) and developmental stage (x axis). Data first reported in this study are highlighted with black circles. c, Visualization of temporal dynamics of selected transcriptomic and epigenomic features during development at a developmentally active locus. Coloring of tracks represents developmental series from maternal (blue) to zygotically active stages of embryogenesis (red). Symbols and track colors indicate representative stages (Extended Data Fig. 1d). CNS, central nervous system.
Fig. 2
Fig. 2. Transcript categories and single-nucleotide resolution 5′ end verification during development.
a, DANIO-CODE transcript 5′ ends supported by CAGE TSS during stages of development. b, Distribution of absolute distance of Ensembl TSSs to CAGE-dominant TSSs in the Prim-5 stage. c, Relationship between guide distance to TSSs and ddCt. Inset: number of dCas guides for all 26 tested genes. d, CAGE-defined TSSs increase the accuracy of promoter identification and support dCas inhibition guide reagent designs. Distance between Ensembl TSSs and CAGE-dominant TSSs (top). Genome view with CRISPR guide position and efficacy, Ensembl and RefSeq transcripts, CAGE and RNA-seq expression (bottom).
Fig. 3
Fig. 3. Alternative promoter usage and motif activity response analysis.
a, Heat map shows the dynamics of expression levels of reference and alternative promoters across 16 developmental stages represented as images. Expression levels are scaled in the range of 0–1 for each row. Reference and alternative transcripts using the same and different coding sequence (CDS) starts are denoted. Transcript pairs without full CDS annotation are denoted as ambiguous. b, Distribution of correlation coefficient of expression levels of promoters across 16 developmental stages. c, Enrichment of KEGG pathways on multipromoter genes. The adjusted P value cut-off is 0.05, denoted by a vertical dashed line. The number of genes in KEGG pathways and those overlapping with multipromoter genes is shown inside the bars, d, MARA motif activity plots of three TF motifs across development. Posterior means and standard deviations (depicted as error bars) are based on analysis of the expression levels of all n = 27,781 promoters for each sample. Motif logos are depicted as insets. e, Genome browser view of the actin alpha 1a promoter. From the top: ATAC signal, CAGE signal, a single TSR (black), two Ensembl transcripts (dark red) and TFBSs predicted to regulate this TSR (red) are shown. Color intensities of the TFBSs reflect MARA scores of predicted regulatory role of TFs.
Fig. 4
Fig. 4. Classification of developmental cis-regulatory elements.
a, Genome browser screenshot showing ChromHMM classification of PADREs, and respective histone post-translational modification signals used to define them. b, UMAP plot of PADREs at the Prim-5 stage. Each point represents one open chromatin region, colored by functional assignment. c, Occurrence probabilities of chromatin marks for ChromHMM states. The states function was manually assigned using The Roadmap Epigenomic annotations as reference. 1_TssA1, 2_TssA2: active TSS; 3_TssFlank1, 4_TssFlank2, TSS flanking region; 5_EnhA1, active enhancer; 6_EnhFlank, enhancer flanking region; 7_EnhWk1, primed enhancer; 8_Pois, poised elements; 9_PcRep, Polycomb-repressed regions; 10_Quies, quiescent state. dg, UMAP plot showing PADREs overlapping with CAGE promoters (d), CTCF motif (e), eRNA enhancers (f) and transgenically validated enhancers (g). The transgenically validated enhancers are predominantly associated with enhancer-associated chromatin states (Supplementary Table 11). h, UMAP plot showing the mean phastCons score for each PADRE (top right) and overlap with human CNEs (top left). The bottom subpanel shows the distribution of phastCons scores of active enhancers throughout development (left, bars represents interquartile range), as well as the distribution of the phastCons score for PADREs separated by function at the Prim-5 stage. Two-sided Wilcoxon rank sum test was used to calculate P values between promoters and enhancers (P = 2.2 × 10−16) and enhancers and Polycomb-associated elements (P = 2.2 × 10−16). Exons and intergenic regions were added as reference (right) i, Position of cell-type-specific elements on the UMAP plot (top). ATAC, H3K27ac and H3K4me1 signals around the peak summit of cell-type-specific PADREs (bottom).
Fig. 5
Fig. 5. Developmental dynamics of PADREs.
a, Openness profile of selected SOM classes (4: early; 6: post-ZGA constitutive; 14: late class), and their position density on the UMAP plots of different developmental stages (top). Heat map of signal intensity of ATAC, H3K27ac and H3K4me1 at the Dome and the Prim-5 stages, along with their respective profiles (bottom). b, Position of COPEs, DOPEs and DOPEs marked with H3K27ac in adult tissues on the UMAP plot (left). Profiles of ATAC, H3K27ac and H3K4me1 of COPEs, DOPEs, DOPEs marked in adult tissues, and other constitutive elements throughout development (right).
Fig. 6
Fig. 6. Chromatin architecture classification and developmental specialization of Pol II gene promoters.
a, Heat map of chromatin accessibility profiles aligned to dominant TSS per promoter at the Prim-5 stage. Nucleosome-free regions (red) are superimposed with nucleosome positioning (blue). Stack height reflects number of promoters. Above each heat map, combined histograms of CAGE expression are shown. Black, forward TSSs; red, reverse orientation TSSs (the scale is amplified ×10 in relation to forward transcription). Nucleosome positioning is symbolized above alignments and black arrows indicate transcription direction; size indicates relative strength. Promoter configuration classes are color-coded consistently in all panels (including Supplementary Fig. 6) b, Aggregated H3K4me1, H3K4me3 (MNase-digested), H3K27ac ChIP–seq signals for classes as in a are aligned to dominant TSS. c, UMAP profiles of promoter classes at the Prim-5 stage. UMAPs are cropped to highlight promoter PADREs. d, Flow diagram indicates the relationship between promoter configuration class at the Dome stage (left edge, Supplementary Fig. 6) and the Prim-5 stage (right edge). Band width represents the number of promoters. e, Violin plot of phastCons vertebrate conservation distribution of promoters. Each class is aligned to a. f, Classification of promoter expression during development with SOMs. On the top right, 5 × 5 diagrams contain violin plots with stage-by-stage expression levels. Blue to red spectrum indicates maternal to zygotic expression dynamics of promoter clusters. Surface areas of gray circles indicate the number of promoters per cluster. Stages of development are symbolized below the SOM array. On the left, mustard: positive and green: negative color spectrum in SOMs indicates the enrichment in promoter overlap between promoter expression classes (SOMs) in each chromatin architecture class a. g, Enriched GO categories for each promoter architecture class.
Fig. 7
Fig. 7. Dynamics and function of open chromatin and H3K27ac topology organization on early embryo development.
a, Schematic representation of GRBs. Basic components of a GRB. GRB enhancers (green) regulating the target genes span the entire length of the GRB (middle). Typical density pattern of conserved noncoding elements in a GRB, most of which overlap enhancers (top). Hi-C contact matrix within a GRB (bottom). b, Chromatin opening profiles through developmental stages along TADs. c, Genome browser view of a GRB TAD showing H3K27ac signals in the Dome and the Prim-5 stages, H3K27ac ensembles (black bar), CAGE promoters (black blocs) and nonpromoter PADREs (blue active in the Dome stage, red active in the Prim-5 stage and purple PADREs active in both stages). A zoomed-in genome browser view of an H3K27ac ensemble (top, left). d, Aggregate contact enrichment centered on ensembles at stages as indicated. e, TAD compartment score distribution. Positive scores represent A compartments, while negative ones represent B compartments. The comparison was done using two-sided two-sample unpaired Wilcoxon test. g, Heat maps of H3K27ac signal across GRB TADs containing ensembles through developmental stages. TADs are ordered by their width in descending order and fixed on the TAD center. h, CAGE expression patterns of selected gene classes separated by SOM, with the highest and lowest ratios in ensemble-associated genes. Bar plot on the right shows the proportion of ensemble-associated genes in each class. BGT and GST classes are marked on the heat map i, Gene expression pattern of GRB target and bystander genes. The left side bar shows an ensemble association for each gene. The right side bar shows the target or bystander assignment for each gene. Genes in TADs with and without ensembles are separated by a green line. BST and GST classes are indicated on the side. j, Graph showing mean expression and standard error of GRB target genes associated and not associated with early H3K27ac ensembles. k, A model describing the influence of an H3K27ac ensemble on expression of GRB target genes. If the H3K27ac ensemble is in contact with the target gene, it can be expressed early on.
Fig. 8
Fig. 8. Synteny projections reveal conservation of epigenetic features between zebrafish and mouse.
a, Cross-species comparison of the irx3/5(a) TAD between zebrafish and mouse and a zoom-in on the locus around irx3(a). Connecting lines represent projections of bin centers from zebrafish to mouse. b, Distribution of distances from the bin centers (n = 528,830) to their closest anchors in zebrafish (blue), and from their projections to their closest anchors in mouse (red), using the direct and the multispecies projection approach. c, Epigenetic comparison of the irx3/5(a) TAD. H3K27me3 overlap in mapped regions is indicated as colored bars (yellow, mutually enriched; blue, zebrafish specific; red, mouse specific; Methods). Opacity reflects signal amplitude and is proportional to the maximum H3K27me3 signal in both species. d, H3K27me3 overlap profiles for four selected GRB TADs. TAD boundaries are indicated with square brackets. e, H3K27me3 overlap profiles of all GRB TADs. TADs are ordered by their relative amount of shared signal. Bins are ordered by the amount of shared signal: bins with shared signal appear in the middle, bins with zebrafish- and mouse-specific signals are left and right, respectively. A view of the TADs with their genomic bin order is given in Extended Data Fig. 10d,f. Classification of zebrafish ATAC-seq peaks in the irx3a locus into DC, IC and NC on the basis of overlaps with direct anchors, multispecies anchors and mouse DNase-seq peak projections (Methods). g, Distribution of DNase-seq signal in the mouse genome around the projected regions of the zebrafish ATAC-seq peaks (n = 140,633). Asterisks above the bars indicate the effect size category based on Cohen’s d: very small (not indicated), small (*), medium (**), large (***), very large (****). h, Cross-species comparison of ChromHMM functional states. i, Cumulative distribution of shared motifs in mouse DNase-seq peaks overlapping zebrafish ATAC-seq peaks. j, H3K27ac enrichment (signal ≥80th percentile) within (n = 11,083) and outside (n = 93,020) of enhancer ensembles (P < 2.2 × 10−16, Fisher’s exact test). k, Cross-species comparison of H3K27ac profile around an H3K27ac ensemble neighboring the zebrafish aktip gene.
Extended Data Fig. 1
Extended Data Fig. 1. Data increase in the DANIO-CODE Data Coordination Center.
a, Tracks of representative examples of unpublished datasets in a UCSC Genome Browser session including CAGE, ATAC, and ChIP datasets generated by DANIO-CODE laboratories. Promoter region of developmental regulator shha gene is shown. b, DCC Data availability summary for ChIP with antibodies against Pol II, CTCF and transcription factors as indicated. Stages and stage ranges are indicated on the X axis, the transcription factor occupancy detected is listed on the Y axis. c, Data producers and data types matrix indicating the data producer lab (Y axis) and the type of data (X axis). d, Data acquisition evolution in the DCC.
Extended Data Fig. 2
Extended Data Fig. 2. Validation of annotated transcripts.
a, b, Aggregation plots and heatmaps of open chromatin and epigenetic features of annotated transcripts and CAGE-seq validation of TSSs (bars on the right of each panel) are shown for the Dome (a) and Prim-5 (b) stages. Top panels show protein coding genes (n=14,471, of which 12,031 are supported by CAGE for the Dome stage; n=16,478, of which 13,769 are supported by CAGE for the Prim-5 stage) and bottom panels show lncRNA (n=1,780, of which 302 are supported by CAGE for the Dome stage; n=1,551, of which 220 are supported by CAGE for prim-5) and TUCP (n=336, of which 97 are supported by CAGE for the Dome stage; n=329, of which 112 are supported by CAGE for the Prim-5 stage) genes c, Example screenshot of novel lncRNA(top), and novel TUCP (bottom) transcripts and associated epigenomic features.
Extended Data Fig. 3
Extended Data Fig. 3. Characterisation of promoter-calling precision and alternative promoter usage in annotated transcripts.
a, Frequency distribution of Ensemble transcripts 5’ ends binned according to distance (bp) from CAGE dominant peak as indicated on X axis. Cumulative frequency depicted by line. Developmental stages are indicated by embryo symbols. b, Box plot shows the expression levels of canonical and alternative promoters across 16 developmental stages. P-values denote the significant difference in expression levels between canonical and alternative promoters during two stages at fertilized-egg (P=3.0E-33; t-test two-sided) and long pec (P=4.7E-18; t-test two-sided). c, A UCSC browser screenshot of the gene dag1 shows the alternative promoter (highlighted in cyan) is upstream of the start codon (pointed by arrow), thus altering only 5’UTR but not protein. The numbers on the y-axis represent the normalized tags per million (TPM) of CAGE tags. The Uniprot domain track denotes the annotated protein domain in the Uniprot database. d, A UCSC browser screenshot of the gene bmp6 shows the alternative promoter (highlighted in cyan) is downstream of the start codon (pointed by arrow) and alters the N terminal of the protein. e, Bar plots show the fraction of multi-promoter genes relative to the total expressed genes in zebrafish and mouse embryonic stages. The numbers on top of bar plot represent the actual number of multi-promoter genes. E11 represents embryonic day 11 and so on for E12, E13 and E14.
Extended Data Fig. 4
Extended Data Fig. 4. Motif activity analysis.
MARA predicts up-regulation of Tead3’s activity from gastrulation onwards (Fig. 2). For each potential target promoter with Tead3 binding site, MARA quantifies the extent the Tead3 motif activity explains the target’s expression dynamics (log-likelihood score). For each GO category the sum of log-likelihoods for all genes in the category was calculated. Supplementary Table 13 shows the GO biological process categories with the highest total log-likelihoods. Top categories correspond to processes in which Hippo signalling during early development in zebrafish has been implicated. a,b, The tgif1 promoters are transiently upregulated during gastrulation (a) while the targets of Tgif1 are transiently down-regulated (b), supporting Tgif1 as a repressor. Posterior means and standard deviations (depicted as error bars) are based on analysis of the expression levels of all n= 27781 promoters for each sample. c, Scatterplot of TGIF1_MEIS1a_MEIS2a motif activity (horizontal axis) against total tgif1 mRNA expression (vertical axis) shows motif activity and TF expression are highly anti-correlated (Pearson correlation -0.92). d, Scatterplot of the FOS/NF-Y motif activity (horizontal axis) against expression of the nfyal gene shows positive correlation (Pearson correlation coefficient 0.86). e, Scatterplot of the FOS/NF-Y motif activity (horizontal axis) against expression of the nfya gene shows negative correlation (Pearson correlation -0.77). As shown in Fig. 3d, MARA predicts that targets of NF-Y are down-regulated from the sphere stage onwards, thus as the NF-Y motif activity decreases during development. The expression of nfya is up whereas nfyal is down-regulated, suggesting that Nfya may replace Nfyal in the NF-Y complex. f, STRING database network picture of the predicted target genes of the NF-Y motif. The black oval indicates a set of target genes involved in mitosis and G2/M transition, consistent with the documented role of NF-Y.
Extended Data Fig. 5
Extended Data Fig. 5. PADREs validation.
a, Left: Number of PADREs assigned to each chromatin state for every developmental stage. Right: Proportion of ChromHMM states present in PADREs for each stage. b, Number of annotated PADREs overlapping Mexican cavefish (left) and human (right) CNEs for each stage. c, Number of annotated PADREs overlapping transgenically validated enhancers for each stage. d, Number of annotated PADREs overlapping CAGE-defined eRNAs for each stage. e, phastCons scores distribution of annotated PADREs for each stage. f, Methylation profile throughout the development of annotated PADREs at the Prim-5 stage.
Extended Data Fig. 6
Extended Data Fig. 6. UMAP visualisation of regulatory elements.
a-c, Schematic representation of UMAP visualization of PADREs (for details, see Methods). R1-13 represent bins used to make the model. d, UMAP plot of annotated PADREs for each developmental stage analysed.
Extended Data Fig. 7
Extended Data Fig. 7. Cell-type and developmental classification of PADREs.
Cell-type specificity assignment and developmental dynamics of PADREs a, An example genomic region shows cell-type assignment of PADREs derived from single-cell ATAC-seq data (bottom track) and the gene model (top track). The name of PADREs contains their cell-type assignment. PADREs in this track are color-coded by their cell-type assignment as well, each colour representing a different cell-type. The state number in the name corresponds to those defined in McGarvey et al.. b, Overlap of matches between the cell-type assignment and activity tissue determined by transgenic assay. Of 155 transgenically validated enhancers active at the Prim-5 stage, 117 have a cell-type specificity assignment. For details of anatomical terms and statistics see Supplementary Table 11. In 72 (62%) assigned transgenic enhancers the scATAC-seq derived anatomical annotation matches at least one of the activity domains of the transgenic reporter (left-hand side of the bar chart). Partial overlap indicates transgene activity in a related tissue, but without no identifiable direct overlap with that of the cell type assignment. Not assigned elements were not registered for cell type specificity by McGarvey et al.. Undetermined elements were not possible to directly compare due to ambiguity of anatomical terms. The functional annotation of transgenically validated PADREs (right column) shows that most transgenic elements have an enhancer relevant ChromHMM registration at the Prim-5 stage. Waterfall plot between the left and right columns indicate overlap between cell type assignment and cis regulatory element category. c, Openness of distal (non-promoter) cPADREs throughout development at stages indicated on the x-axis in the defined SOM classes. Numbers in brackets indicate the number of elements in each class.
Extended Data Fig. 8
Extended Data Fig. 8. Developmental dynamics of topologically associated domains and H3K27ac ensemble definition.
a, ATAC-seq signals in GRB (top) and non-GRB (bottom) TADs throughout development. TADs are ordered in a descending order from the top of the heatmap. b, Directionality index in GRB TADs throughout development. c, Distance distribution of enhancer-associated PADREs to the closest promoter within GRB TADs. Bars represents inter-quartile range. d, Enhancer-associated ChromHMM segments in GRB TADs throughout development. TADs are ordered in a descending order from the top of the heatmap. Segments are coloured based on the logarithm of their length. Early stages are dominated by fewer large blocks, which start to be enriched within TADs only at 75%-Epiboly. In late stages, short segments are distributed uniformly throughout the entire TAD length. e, Width distribution of concatenated enhancer-associated ChromHMM segments. Singletons shorter than two bins (400 bp) were excluded. The number of segments is shown above each violin plot. f, Ratio of GRB and non-GRB tads containing H3K27ac ensembles. g, the density of CAGE promoters on ensemble boundaries. h, the number of non-promoter PADREs per 100 kb in TADs containing ensembles. The x-axis shows the developmental stage in which the PADRE is H3K27ac marked (early, late, or both). The location of promoters in respect to the ensemble is shown in different colours. The numbers were compared using two-sided two-sample unpaired Wilcoxon test.
Extended Data Fig. 9
Extended Data Fig. 9. H3K27ac ensemble contact enrichment and CAGE expression patterns of gene classes separated by SOM.
a, Controls for contact enrichment around H3K27ac ensembles. All regions were downsampled to n=56 to match the number of 50 kb - 150 kb size ensembles. Labels are as in Fig. 7g. The controls included random positions within the same TAD (a), random positions within TADs without ensembles, and 10MB shifted positions, for GRB TADs (top row) and non-GRB TADs (bottom row). The controls include published data for the Prim-5 stage, as well as new, unpublished data with higher resolution (Prim 5). b, CAGE expression patterns of gene classes separated by SOM. Bar plots in the middle show the proportion of ensemble-associated and GRB genes in each class respectively.
Extended Data Fig. 10
Extended Data Fig. 10. Epigenetic domains comparison between zebrafish and mouse.
a, Comparison of sizes of genomic sequences covering orthologous GRB-containing TADs. TADs are ranked by size, largest on top. b, Schematic illustration of the projection of an example genomic location X between zebrafish and mouse by interpolation using the direct alignments (grey rectangles) and the alignments via a bridging species (blue and red rectangles, Xenopus in this example). projections are indicated as a black X in the respective species). Dashed lines connect pairwise sequence alignments. The projected locations of X in mouse are indicated in grey (direct alignments) and black (via bridging species). c, Example graph comprising 15 species (nodes). For any genomic location, the shortest path through the species graph yields the combination of species which maximizes projection accuracy. d, H3K27me3 overlap profiles of all GRB TADs. TADs are ordered by their relative amount of shared signal. Bins are in the original genomic order. e, Fractions of bins with shared or species-specific H3K27me3 enrichment. Bins are classified as alignable (n=22,403) if they overlap a direct sequence alignment between zebrafish and mouse and as non-alignable otherwise (n=97,767). P-values are obtained by Fisher’s exact test.

Comment in

  • Decoding the zebrafish genome.
    Lawson ND. Lawson ND. Nat Genet. 2022 Jul;54(7):917-919. doi: 10.1038/s41588-022-01080-5. Nat Genet. 2022. PMID: 35789322 No abstract available.

Similar articles

Cited by

References

    1. Patton EE, Tobin DM. Spotlight on zebrafish: the next wave of translational research. Dis. Models Mechanisms. 2019;12:dmm039370. - PMC - PubMed
    1. Howe DG, et al. The zebrafish model organism database: new support for human disease models, mutation details, gene expression phenotypes and searching. Nucleic Acids Res. 2017;45:D758–D768. - PMC - PubMed
    1. Howe K, et al. The zebrafish reference genome sequence and its relationship to the human genome. Nature. 2013;496:498–503. - PMC - PubMed
    1. Bogdanovic O, et al. Dynamics of enhancer chromatin signatures mark the transition from pluripotency to cell specification during embryogenesis. Genome Res. 2012;22:2043–2053. - PMC - PubMed
    1. Murphy PJ, Wu SF, James CR, Wike CL, Cairns BR. Placeholder nucleosomes underlie germline-to-embryo DNA methylation reprogramming. Cell. 2018;172:993–1006.e13. - PubMed

Publication types