

Developing and Validating Multi-Modal Models for Mortality Prediction in COVID-19 Patients: a Multi-center Retrospective Study
- PMID: 35789446
- PMCID: PMC9255527
- DOI: 10.1007/s10278-022-00674-z
Developing and Validating Multi-Modal Models for Mortality Prediction in COVID-19 Patients: a Multi-center Retrospective Study
Abstract
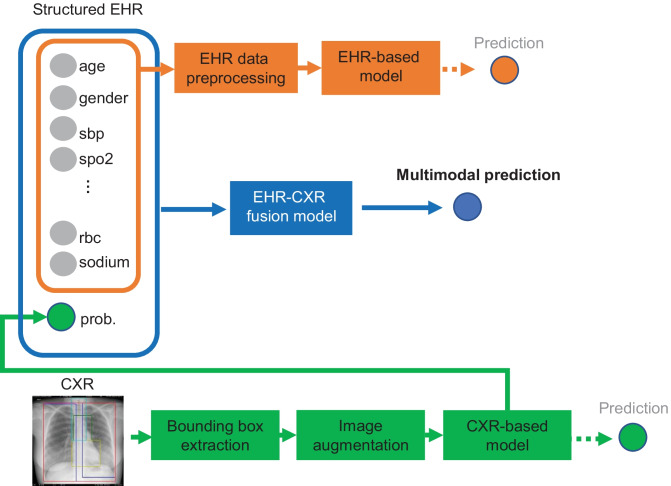
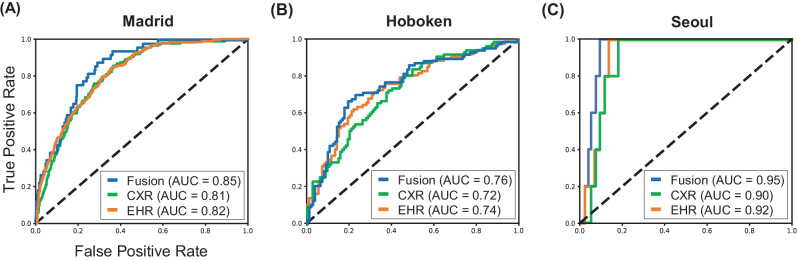
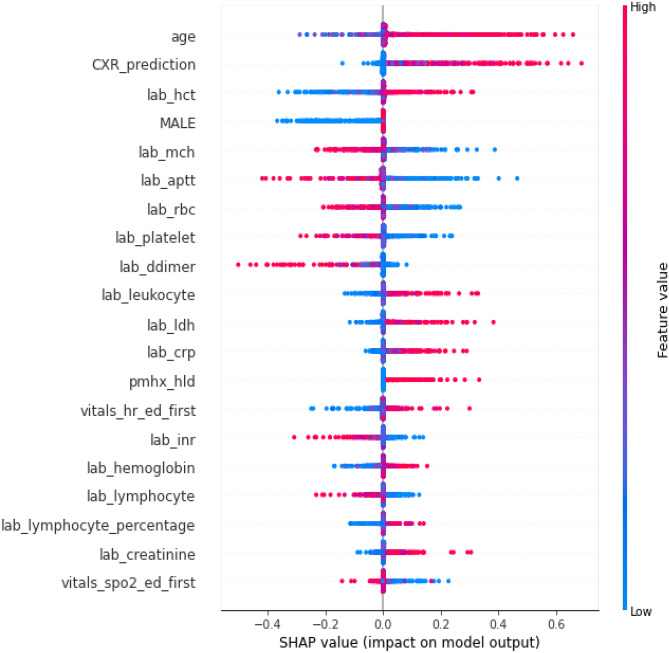
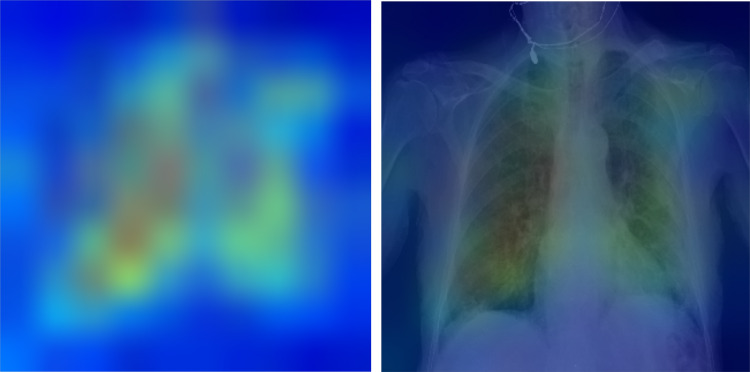
The unprecedented global crisis brought about by the COVID-19 pandemic has sparked numerous efforts to create predictive models for the detection and prognostication of SARS-CoV-2 infections with the goal of helping health systems allocate resources. Machine learning models, in particular, hold promise for their ability to leverage patient clinical information and medical images for prediction. However, most of the published COVID-19 prediction models thus far have little clinical utility due to methodological flaws and lack of appropriate validation. In this paper, we describe our methodology to develop and validate multi-modal models for COVID-19 mortality prediction using multi-center patient data. The models for COVID-19 mortality prediction were developed using retrospective data from Madrid, Spain (N = 2547) and were externally validated in patient cohorts from a community hospital in New Jersey, USA (N = 242) and an academic center in Seoul, Republic of Korea (N = 336). The models we developed performed differently across various clinical settings, underscoring the need for a guided strategy when employing machine learning for clinical decision-making. We demonstrated that using features from both the structured electronic health records and chest X-ray imaging data resulted in better 30-day mortality prediction performance across all three datasets (areas under the receiver operating characteristic curves: 0.85 (95% confidence interval: 0.83-0.87), 0.76 (0.70-0.82), and 0.95 (0.92-0.98)). We discuss the rationale for the decisions made at every step in developing the models and have made our code available to the research community. We employed the best machine learning practices for clinical model development. Our goal is to create a toolkit that would assist investigators and organizations in building multi-modal models for prediction, classification, and/or optimization.
Keywords: COVID-19; Mortality prediction; Multi-center; Multi-modal.
© 2022. The Author(s).
Conflict of interest statement
The authors declare no competing interests.
Figures
References
-
- M. Xu et al., “Accurately Differentiating COVID-19, Other Viral Infection, and Healthy Individuals Using Multimodal Features via Late Fusion Learning,” medRxiv, p. 2020.08.18.20176776, Aug. 2020, 10.1101/2020.08.18.20176776.
-
- G. Chassagnon and N. Paragios, “Holistic AI-Driven Quantification, Staging and Prognosis of COVID-19 Pneumonia,” medRxiv, p. 2020.04.17.20069187, Jul. 2020, 10.1101/2020.04.17.20069187.
-
- X. Wang et al., “Multicenter Study of Temporal Changes and Prognostic Value of a CT Visual Severity Score in Hospitalized Patients With Coronavirus Disease (COVID-19),” Am. J. Roentgenol., pp. 1–10, Sep. 2020, 10.2214/AJR.20.24044. - PubMed
-
- N. Lassau et al., “Integration of clinical characteristics, lab tests and a deep learning CT scan analysis to predict severity of hospitalized COVID-19 patients,” medRxiv, p. 2020.05.14.20101972, Oct. 2020, 10.1101/2020.05.14.20101972.
Publication types
MeSH terms
Grants and funding
LinkOut - more resources
Full Text Sources
Medical
Miscellaneous
