. 2022 May 30;25(7):104475.
doi: 10.1016/j.isci.2022.104475. eCollection 2022 Jul 15.

When function is biological: Discerning how silver nanoparticle structure dictates antimicrobial activity

Affiliations

When function is biological: Discerning how silver nanoparticle structure dictates antimicrobial activity

Qingbo Zhang et al. iScience. .

Abstract

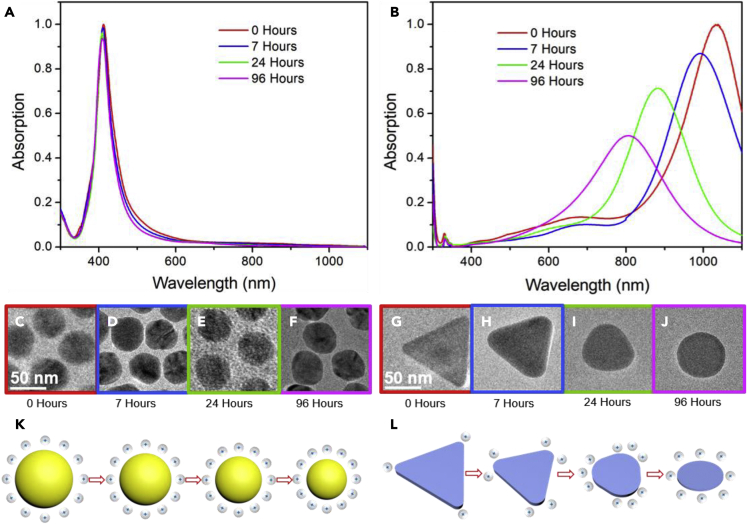
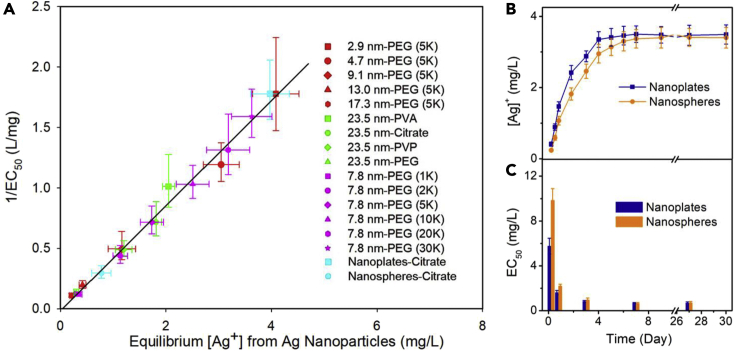
Silver nanomaterials have potent antibacterial properties that are the foundation for their wide commercial use as well as for concerns about their unintended environmental impact. The nanoparticles themselves are relatively biologically inert but they can undergo oxidative dissolution yielding toxic silver ions. A quantitative relationship between silver material structure and dissolution, and thus antimicrobial activity, has yet to be established. Here, this dissolution process and associated biological activity is characterized using uniform nanoparticles with variable dimension, shape, and surface chemistry. From this, a phenomenological model emerges that quantitatively relates material structure to both silver dissolution and microbial toxicity. Shape has the most profound influence on antibacterial activity, and surprisingly, surface coatings the least. These results illustrate how material structure may be optimized for antimicrobial properties and suggest strategies for minimizing silver nanoparticle effects on microbes.

Keywords: Microbiology; Nanomaterials; Nanoparticles; Nanotoxicology.


Conflict of interest statement

The authors declare no competing interests.

Figures

None
Graphical abstract
Figure 1
Figure 1
Silver nanoparticles with different sizes and shapes (A–E) TEM micrographs of silver nanoparticles of 2.9 ± 0.3 nm, 4.7 ± 0.2 nm, 9.1 ± 0.5 nm, 13.0 ± 0.6 nm, and 17.3 ± 1.0 nm, respectively. (F) Size distribution of silver nanoparticles with different diameters corresponding to the different panels. The plots are the Gaussian fits to the histograms of nanoparticle diameters found by counting over 1,500 particles in TEM micrographs. (G) Schematic illustration of the procedure to synthesize silver nanoplates and nanospheres with identical surface coating and similar volume. The silver nanoplates and nanospheres were prepared using a two-step seeded growth method, which allows independent control of particle shape and size; (H) Photographs of aqueous solutions of silver nanospheres and nanoplates. (I) Absorption spectra of silver nanospheres and nanoplates that were scaled to an optical density of one. (J) TEM micrograph of silver nanospheres showing the diameter of 45.4 ± 5.4 nm. (K) TEM micrograph of silver nanoplates showing the side length of 109 ± 11 nm. Nanoplates standing vertically upon their lateral faces (inset of (K)) showing the thickness of 9.7 ± 1.3 nm. The volumes of nanoplates and nanospheres are 49,901 nm3 and 48,972 nm3, respectively. See also Figures S1–S3.
Figure 2
Figure 2
Silver nanoparticles coated with poly(ethylene glycol) thiol (PEG-SH) of different molecular weights (A) Hydrodynamic diameters and grafting densities of silver nanoparticles as a function of the molecular weight of the polymer coating. (B) The schematic illustration of silver nanoparticles coated with PEG-SH of different length showing that change of surface conformation from a linear brush to mushroom with the increase of PEG-SH chain length. Silver nanoparticles coated with PEG-SH of 1,000, 2,000, 5,000, 10,000, 20,000, and 30,000 Da were prepared through ligand exchange from the same batch of silver nanoparticles. The initial silver nanoparticles, which were synthesized through organic reaction, were originally coated with oleic acid and have a diameter of 7.8 ± 0.6 nm. See also Figures S4 and S5.
Figure 3
Figure 3
Dissolution of silver nanoparticles (A) Silver nanoparticle dissolution is an equilibrium process. The silver nanoparticles (d = 23.5 ± 2.6 nm) were coated with poly(vinyl alcohol) (PVA, 9,000–10,000) for these experiments. The concentration of silver ions in the solution increases with time due to the oxidative dissolution of silver nanoparticles and becomes constant after a period of time (∼5 days). The silver nanoparticles were isolated from the solution by centrifugal filter and redispersed in water after nine days. The dissolution restarts following similar profile until the concentration of silver ions becomes constant again. These observations show that the dissolution of silver nanoparticles is an equilibrium process. (B) Schematic illustration of oxidative dissolution of silver nanoparticles. A layer of oxidized silver will be formed once silver nanoparticles are exposed to dissolved oxygen in water. There exists an equilibrium between oxidized silver on particle surfaces and dissolved silver in solution. (C) Dissolution properties of silver nanoparticles with different diameters. The silver nanoparticles were coated with poly(ethylene glycol) thiol (PEG-SH, 5,000). The error bars shown here, and in D-F, are the standard deviation of triplicate measurements. (D) Dissolution properties of silver nanoparticles (23.5 ± 2.6 nm) with different surface coatings; (E) Dissolution properties of silver nanoparticles (7.8 ± 0.6 nm) coated with PEG-SH of different molecular weights. (F) Dissolution properties of citrate-coated silver nanoparticles with different shapes. In all cases, symbols are the concentration of silver ion as measured with an ion-selective electrode; the lines represent fits to the data using the first-order reaction model described in the supplemental information. The initial concentration of silver nanoparticles is 12. mg/L for all samples. See also Figures S6–S8, and Table S1.
Figure 4
Figure 4
Dissolution process of silver nanospheres and nanoplates (A) Absorption spectra of silver nanospheres at different stages of dissolution. (B) Absorption spectra of silver nanoplates at different stages of dissolution. (C–F) TEM micrographs of silver nanospheres at different stages of dissolution. (G–J) TEM micrographs of silver nanoplates at different stages of dissolution. (K) The schematic illustration of the dissolution process of silver nanospheres. (L) The schematic illustration of the dissolution process of silver nanoplates. Both the spectroscopic and microscopic data illustrated how silver nanospheres dissolve uniformly and retain their shape; in converse, the sharp tips of the nanoplates are more prone to dissolution giving rise to a pronounced shape evolution as dissolution proceeds.
Figure 5
Figure 5
How nanoparticle structure affects the extent and the kinetics of particle dissolution (A) Equilibrium concentrations of silver ions were obtained from fits to the pseudo-first order reaction rate model described in the supplemental experimental text. Error bars shown in these data are the standard deviation of fits taken from replicate time-dependent dissolution datasets. (B) The half-lives found from the dissolution kinetics show distinctive trends with respect to the particle structure; the reaction rate constant, k, in this analysis is inversely proportional to 1/t1/2. (C) The relationship between the reaction rate constant and equilibrium concentrations of silver ions. The data show that nanoparticles that dissolve to a greater extent also dissolve faster with two notable exceptions. The first are non-spherical particles. The second are particles with very long or dense surface coatings such as nanoparticles coated with PEG-SH larger than 10 kDa. The samples studied include poly(ethylene glycol) thiol (PEG-SH, 5,000)-coated silver nanoparticles of different diameters (2.9 ± 0.3 nm, 4.7 ± 0.2 nm, 9.1 ± 0.5 nm, 13.0 ± 0.6 nm, and 17.3 ± 1.0 nm); 23.5 ± 2.6 nm silver nanoparticles with different surface coatings (Poly(ethylene glycol) thiol, Poly(vinyl pyrrolidone), Poly(vinyl alcohol), and Citrate.); 7.8 ± 0.6 nm silver nanoparticles coated with PEG-SH of different molecular weight (1,000, 2000, 5000, 10,000, 20,000, and 30,000); citrate-coated silver nanoparticles with different shapes (nanospheres and nanoplates). The initial concentration of silver nanoparticles is 12. mg/L for all samples. See also Table S2.
Figure 6
Figure 6
The antimicrobial properties of silver nanoparticles can be directly correlated to the extent of nanoparticle dissolution as measured by the equilibrium silver ion concentration (A) For a wide range of silver nanoparticle types, the antibacterial potency of the materials is linearly proportional to the equilibrium concentrations of silver ions released. These samples include poly(ethylene glycol) thiol (PEG-SH, 5,000)-coated silver nanoparticles of different diameters (2.9 ± 0.3 nm, 4.7 ± 0.2 nm, 9.1 ± 0.5 nm, 13.0 ± 0.6 nm, and 17.3 ± 1.0 nm); 23.5 ± 2.6 nm silver nanoparticles with different surface coatings (Poly(ethylene glycol) thiol, Poly(vinyl pyrrolidone), Poly(vinyl alcohol), and Citrate.); 7.8 ± 0.6 nm silver nanoparticles coated with PEG-SH of different molecular weight (1,000, 2000, 5000, 10,000, 20,000, and 30,000); citrate-coated silver nanoparticles with different shapes (nanospheres and nanoplates). The dots represent the measured EC50 has defined in the text of the silver nanoparticles (y axis) and equilibrium concentration of silver ions released from the oxidative dissolution of silver nanoparticles (x axis). In two cases, the antimicrobial properties were measured prior to the samples achieving equilibrium and the line represents the linear fit to the measured data. (B and C). The nanospheres were coated with Poly(ethylene glycol) thiol (PEG-SH, 30,000) and have a diameter of 8.3 nm. The nanoplates were coated with citrate and have a side length of 120 nm. Panel B and C share the same x axis for easy comparison. The antimicrobial efficiency of each particle type tracks their release of soluble silver over time. See also Figure S9.
Figure 7
Figure 7
The effect of structural parameters and environmental conditions on the equilibrium concentration of silver ions The red symbols on the left of the figure show the effects of the structural parameters investigated in this work on the equilibrium concentration of silver ions. The symbols on the right of the figure show the effect of environmental conditions on the equilibrium concentration of silver ions. These data were extracted from references 29, 35, 38, 43, and 44. The structural parameters, the concentration of silver, and the dissolution conditions are summarized in Table S1 and Table S2. The data show that both the structural parameters and environmental conditions have significant influence on the equilibrium concentrations of silver ions.

Similar articles

Cited by

References

    1. Abbasi E., Milani M., Fekri Aval S., Kouhi M., Akbarzadeh A., Tayefi Nasrabadi H., Nikasa P., Joo S.W., Hanifehpour Y., Nejati-Koshki K., Samiei M. Silver nanoparticles: synthesis methods, bio-applications and properties. Crit. Rev. Microbiol. 2016;42:173–180. doi: 10.3109/1040841x.2014.912200. - DOI - PubMed
    1. Albalghiti E., Stabryla L.M., Gilbertson L.M., Zimmerman J.B. Towards resolution of antibacterial mechanisms in metal and metal oxide nanomaterials: a meta-analysis of the influence of study design on mechanistic conclusions. Environmental Science-Nano. 2021;8:37–66. doi: 10.1039/d0en00949k. - DOI
    1. Alexander J.W. History of the medical use of silver. Surg. Infect. 2009;10:289–292. doi: 10.1089/sur.2008.9941. - DOI - PubMed
    1. Axson J.L., Stark D.I., Bondy A.L., Capracotta S.S., Maynard A.D., Philbert M.A., Bergin I.L., Ault A.P. Rapid kinetics of size and pH-dependent dissolution and aggregation of silver nanoparticles in simulated gastric fluid. J. Phys. Chem. C. 2015;119:20632–20641. doi: 10.1021/acs.jpcc.5b03634. - DOI - PMC - PubMed
    1. Beer C., Foldbjerg R., Hayashi Y., Sutherland D.S., Autrup H. Toxicity of silver nanoparticles—nanoparticle or silver ion? Toxicol. Lett. 2012;208:286–292. doi: 10.1016/j.toxlet.2011.11.002. - DOI - PubMed

LinkOut - more resources