. 2022 Jun 11;25(7):104599.
doi: 10.1016/j.isci.2022.104599. eCollection 2022 Jul 15.

Y RNAs are conserved endogenous RIG-I ligands across RNA virus infection and are targeted by HIV-1

Affiliations

Y RNAs are conserved endogenous RIG-I ligands across RNA virus infection and are targeted by HIV-1

Nicolas Vabret et al. iScience. .

Abstract

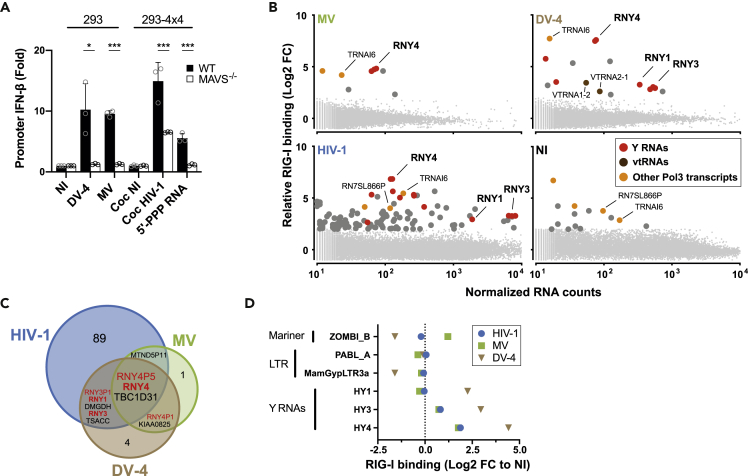
Pattern recognition receptors (PRRs) protect against microbial invasion by detecting specific molecular patterns found in pathogens and initiating an immune response. Although microbial-derived PRR ligands have been extensively characterized, the contribution and relevance of endogenous ligands to PRR activation remains overlooked. Here, we characterize the landscape of endogenous ligands that engage RIG-I-like receptors (RLRs) upon infection by different RNA viruses. In each infection, several RNAs transcribed by RNA polymerase III (Pol3) specifically engaged RLRs, particularly the family of Y RNAs. Sensing of Y RNAs was dependent on their mimicking of viral secondary structure and their 5'-triphosphate extremity. Further, we found that HIV-1 triggered a VPR-dependent downregulation of RNA triphosphatase DUSP11 in vitro and in vivo, inducing a transcriptome-wide change of cellular RNA 5'-triphosphorylation that licenses Y RNA immunogenicity. Overall, our work uncovers the contribution of endogenous RNAs to antiviral immunity and demonstrates the importance of this pathway in HIV-1 infection.

Keywords: Biological sciences; Immunology; Transcriptomics.


Conflict of interest statement

The authors declare no conflicting interests.

Figures

None
Graphical abstract
Figure 1
Figure 1
A differential affinity screen identifies Y RNAs and other POL3 RNAs as RIG-I ligands mobilizable during RNA virus infection (A) Promoter IFN-β-luciferase reporter activity in WT or MAVS−/− (left) 293 cells infected with measles virus (MV) or dengue virus 4 (DV-4) at MOI of 1 and 0.5, respectively, or (right) 293-4x4 co-cultivated with HIV-1-infected MT4C5 at a ratio of MT4C5:293-4x4 of 1:1. 5′-PPP is a short in vitro transcribed RNA RIG-I agonist transfected at a concentration of 10 ng/mL. (B) Twenty-four hours post-infection with MV, DV-4, after co-culture with HIV-1-infected MT4 or in noninfected (NI) control, sequencing reads were mapped to human genome Hg38. Differential analyses were performed between RIG-I/RNA and Cherry/RNA samples. Genes are represented following their normalized count in cellular RNA (x axis) and their fold enrichment (log2) to RIG-I compared with Cherry control (y axis) (average of three independent replicates). Genes that showed a log2(FC) > 2 and adj-pval<0.05 are represented with larger dot size. Among these, Y RNAs are labeled with red dots vtRNA in brown and other Pol3 transcripts are shown in orange. Canonical Y RNAs and Pol3 transcripts that show enrichment in more than two conditions (virus or NI) are specifically annotated. (C) Venn diagram representing individual transcripts specifically enriched to RIG-I compared with Cherry in any of MV, DV-4, or HIV-1-infected conditions but absent in NI condition. (D) Families of RNA repeats that show specific affinity to RIG-I compared with Cherry in at least one infected or NI condition, computed according to their relative enrichment compared with NI. The name of the repeat (e.g. Zombi_B) and the subfamily to which it belongs (e.g. Mariner) are indicated. (A) Data representative of n = 3 independent experiments. Bars show mean ± SEM of technical triplicates. Student’s t test; ∗p < 0.05; ∗∗∗p < 0.001. (B–D) Enrichment calculated from the mean of n = 3 infection/RLR-purification/sequencing experiments.
Figure 2
Figure 2
RNY4 RIG-I agonist activity is conferred by RNA 5′-PPP moieties and viral-mimicking specific secondary structure (A) Promoter ISRE-luciferase reporter activity in HAP1 cells control (CTL) or knockout (ko) for each individual RLR or downstream adaptor MAVS, transfected with 30 ng/mL of IVT Y RNA (RNY1, RNY3-5), 10 ng/mL poly(I:C) low- or high-molecular-weight (p(IC) LMW/HMW), 30 ng/mL of total eukaryotic RNA, or treated with 100 U/mL recombinant IFN-β. (B) Promoter ISRE-luciferase reporter activity in HAP1 cells CTL or RIG-I ko transfected with 30 ng/mL IVT RNY4 full length or lacking specific substructure (Figure S2C). RNY4 dephos: RNY4 was additionally pretreated with alkaline phosphatase to remove 5′- triphosphate extremity. (C) RNY1, RNY4, and IFN-β RNA levels were measured by qPCR after transfection of WT or MAVS−/− 293T with plasmids coding for RNY4 sequence and supplemented with a plasmid coding for RIG-I. U6-RNY4: p2RZ plasmid encoding full-length RNY4 downstream of Pol3 U6 promoter with a ribozyme sequence placed directly in 3’. CMV-RNY4: same plasmid with Pol2 CMV promoter instead of U6 (Table S7). NT: empty plasmid. (D) Probability of thermodynamically stable sequence folding along RNY4 secondary structure in the 5′ end of each transcript, for dataset of human Y RNA families, (+)ssRNA viruses genomes (Flaviviridae or non-Flaviviridae), or human noncoding RNA (ncRNA), mRNAs, and Pol3 transcripts, compared with average probability of the same sequences randomly scrambled. (A–B) Data representative of n = 3 independent experiments. Bars show mean ± SEM of technical duplicates. (C) Bars show mean ± SEM of n = 3 independent experiments. Student’s t test ∗p < 0.05.
Figure 3
Figure 3
HIV-1-dependent downregulation of DUSP11 licenses endogenous 5′-PPP RNAs immunogenicity in infected cells (A) Ratio of 5′-PPP and 5′-P-bearing RNY1 and RNY4 in Jurkat cells 48 h postinfection with HIV-GFP or in noninfected (NI) Jurkat cells. Relative 5′-PPP/5′-P RNA levels were determined through differential enzyme digestion followed by qPCR analysis relative to β-actin mRNA. RN7SL1 and U17b are 5′-PPP and 5′-P RNA controls, respectively. (B) DUSP11 protein levels measured at different times points after Jurkat T cell infection with HIV-GFP. (C) DUSP11 protein levels measured in NI or HIV-GFP-infected productively (GFP+) or nonproductively (GFP−) CD4 primary cells from five different donors 48 h postinfection. CD4 T cells were beads-sorted from total PBMC and activated with phytohemagglutinin-L (PHA) for 72 h prior to infection with HIV-GFP. Forty-eight hours postinfection, productively infected cells were FACS sorted according to GFP expression. DUSP11 protein levels are quantified relative to GAPDH (see also Figure S3C). (D and E) 5’-PPP RNA sequencing of Jurkat CTL or DUSP11−/− cells. Individual genes (D) and repeats (E) are plotted according to the average percentage of their 5′-PPP subsets in three Jurkat control clones (x axis) or DUSP11−/− clones (y axis). Positions of RN7SL1 and U17b genes are indicated, representing 5′-PPP and 5′-P RNA controls, respectively. (F) RNY4 RNA enrichment on RIG-I in DUSP11−/− cells. RNY4 RNA level were measured by qPCR from total RNA, RIG-I-bound, and Cherry-bound fractions in 293 expressing ST-RIG-I or ST-Cherry and either WT, deficient for DUSP11 or after infection with MV. RIG-I binding is computed by measuring the abundance of RNY4 bound to RIG-I compared with protein control Cherry, after normalization to the total cellular RNA abundance in cells overexpressing RIG-I or Cherry, relative to GAPDH mRNA levels. Data are represented in Log2 FC compared with WT NI condition. (G) Heatmap of qPCR values measuring expression level of a panel of IFN-I stimulated genes in Jurkat control, DUSP11−/−, or control treated overnight with recombinant IFN-β. Expression levels are normalized to β-actin mRNA levels and to Jurkat control. Genes with significant enrichments in DUSP11−/− cells compared with control are indicated with stars. (A) Bars show mean ± SEM of n = 3 independent experiments. Student’s t test; ∗p < 0.05. (B) Western blot representative of n = 3 independent experiments. (C) Bars show mean ± SEM of n = 5 donors. (F) Bars show mean ± SEM of n = 5 independent experiments. (G) Heatmap shows mean of three control and three DUSP11−/− Jurkat clones. (H) Bars show mean ± SEM of n = 3 experimental replicates. (G) Student’s paired t test; ∗p < 0.05, ∗∗p < 0.01.
Figure 4
Figure 4
HIV-1 VPR induces DUSP11 downregulation and subsequent increase of endogenous 5’-PPP RNAs (A) DUSP11 protein levels measured at 6 and 48 h after Jurkat T cell infection with WT NL4.3 HIV-1 or the same clone deleted for VPR protein. (B) DUSP11 protein levels in FACS-sorted Jurkat cells 72 h following transduction with lentiviruses coding for ovalbumin (OVA) used as a control, HIV-1 VPR WT, or an HIV-1 VPR(Q65R) defective mutant. UNG2 serves as control of a VPR target downregulated by Q65R mutant (Langevin et al., 2009). UNG1 is a product detected by the same antibody that is not targeted by VPR. (C) DUSP11 protein levels 48 h after HIV-1 infection in Jurkat cells treated with antiretroviral inhibitor or nontreated (NT). T-20: fusion inhibitor enfuvirtide (5 uM); AZT: reverse transcriptase inhibitor zidovudine (1 mM); Ral: integrase inhibitor raltegravir (10 uM). (D) 5’-PPP RNA sequencing of FACS-sorted Jurkat 48 h after infection with HIV-GFP WT or HIV-GFP ΔVPR. Repeats are plotted according to their increase in 5′ triphosphorylation between infected and noninfected cells. Repeats with significant changes in 5′-PPP status upon HIV WT infection are plotted together with corresponding values upon HIV-ΔVPR infection (average of three infection replicates each). (E) Promoter IFN-β-luciferase reporter activity in 293-4x4 after co-culture with HIV-GFPWT- or HIV-GFPdVPR-infected MT4C5. 293-4x4 without co-culture (NT) or co-cultured with noninfected (NI) MT4 serve as negative control, 293-4x4 transfected with 10 ng/ul of poly(I:C) low molecular weight (LMW) serve as positive control. The induction of IFN-β-luciferase is shown as fold change to NT control. (F) Relative quantification of DUSP11 protein level in CD4 T cells from HIV + patients prior to and after antiretroviral treatment. Paired t test; ∗p < 0.05. See also Figure S4C. (A and C) Numbers at the bottom indicate semi-quantification of relative DUSP11/GAPDH levels normalized to NI conditions. (A, B, and C) Western blot representative of n = 2 independent experiments. (E) Mean of three independent experiments.

References

    1. Barski A., Chepelev I., Liko D., Cuddapah S., Fleming A.B., Birch J., Cui K., White R.J., Zhao K. Pol II and its associated epigenetic marks are present at Pol III-transcribed noncoding RNA genes. Nat. Struct. Mol. Biol. 2010;17:629–634. doi: 10.1038/nsmb.1806. - DOI - PMC - PubMed
    1. Benjamini Y., Hochberg Y. Controlling the false discovery rate: a practical and powerful approach to multiple testing. J. Roy. Stat. Soc. B. 1995;57:289–300. doi: 10.1111/j.2517-6161.1995.tb02031.x. - DOI
    1. Brister J.R., Ako-Adjei D., Bao Y., Blinkova O. NCBI viral genomes resource. Nucleic Acids Res. 2015;43:D571–D577. doi: 10.1093/nar/gku1207. - DOI - PMC - PubMed
    1. Burke J.M., Kincaid R.P., Nottingham R.M., Lambowitz A.M., Sullivan C.S. DUSP11 activity on triphosphorylated transcripts promotes Argonaute association with noncanonical viral microRNAs and regulates steady-state levels of cellular noncoding RNAs. Genes Dev. 2016;30:2076–2092. doi: 10.1101/gad.282616.116. - DOI - PMC - PubMed
    1. Burke J.M., Sullivan C.S. DUSP11 - an RNA phosphatase that regulates host and viral non-coding RNAs in mammalian cells. RNA Biol. 2017;14:1457–1465. doi: 10.1080/15476286.2017.1306169. - DOI - PMC - PubMed