

Race- and gender-based under-representation of creative contributors: art, fashion, film, and music
- PMID: 35789925
- PMCID: PMC9244133
- DOI: 10.1057/s41599-022-01239-9
Race- and gender-based under-representation of creative contributors: art, fashion, film, and music
Abstract
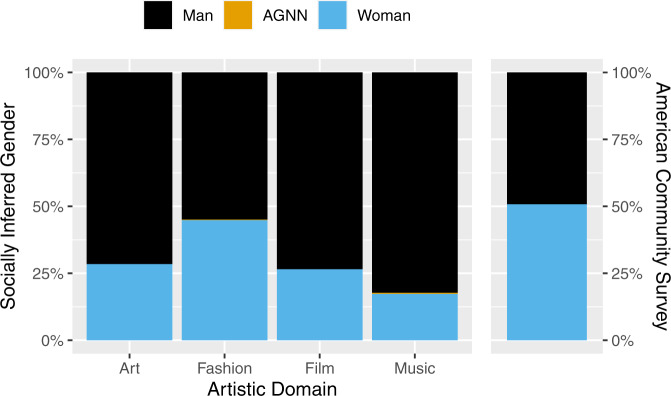
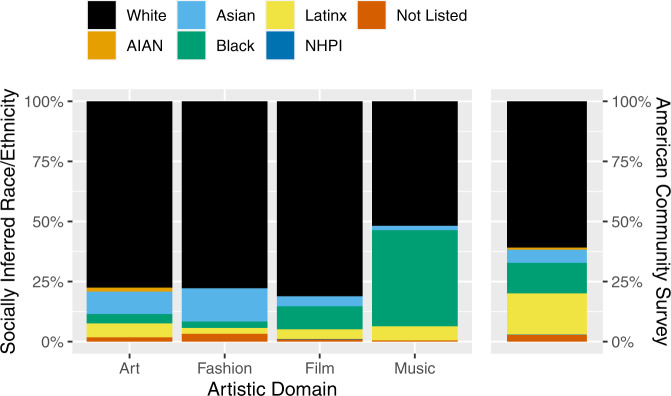
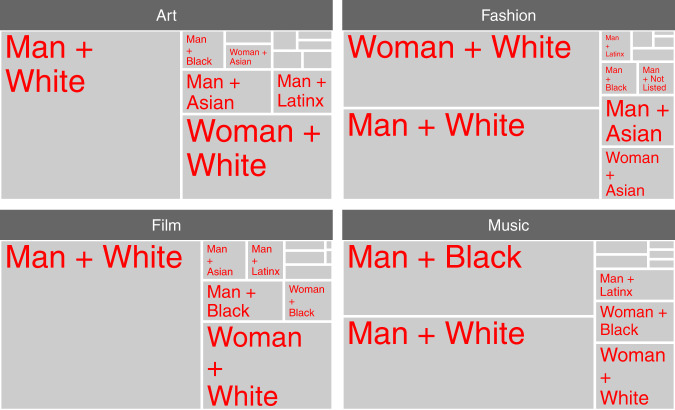
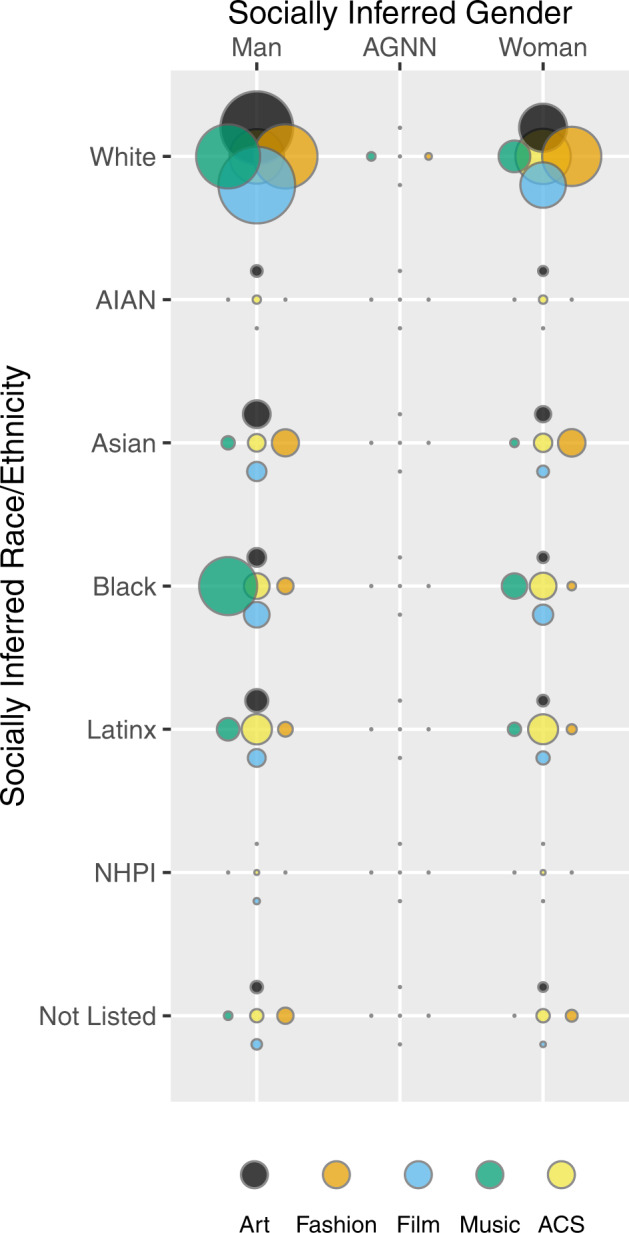
Motivated by the well-established benefits to society of artistic creation and of demographic diversity, we investigate the gender and racial/ethnic composition of influential contributors to four creative domains. Women make up 51% of the U.S. population but are underrepresented at influential levels of contemporary art (28%), high fashion (45%), box office film (27%), and popular music (17%). Marginalized racial/ethnic groups make up 39% of the U.S. population yet comprise approximately half that figure in contemporary art (22%), high fashion (22%), and box office film (19%). Black musical artists have higher representation (48%), though higher representation does not equate with equity and inclusion. As for intersecting identities, white men are overrepresented in all four domains by factors ranging from 1.4 to 2 as compared to the U.S. population, and most other gender-racial/ethnic groups are further minoritized. Our study is the first comprehensive, comparative, empirical look at intersecting identities across creative fields. The exclusion of marginalized individuals, including those who are women, American Indian/Alaska Native, Asian, Black, Latinx, and Native Hawaiian/Pacific Islander, is severe. The lack of self-expressed demographic data is a challenge, as is the erasure of certain identity groups from the American Community Survey, including agender, gender noncomforming, nonbinary, and transgender individuals. These are challenges that, if addressed, would enhance our collective understanding of diversity in creative fields.
Keywords: Cultural and media studies; Sociology.
© The Author(s) 2022.
Conflict of interest statement
Competing interestsData collection for this study was funded by Revolt, a UK-based consultancy, who themselves were contractors for LIFEWTR, a subsidiary of Pepsi. The funder participated in determining the scope of data collection, but played no role in data collection itself, nor in the analysis, interpretation, and reporting of our results.
Figures
References
-
- Adams RB, Kräussl R, Navone MA, et al. (2018) Is gender in the eye of the beholder? Identifying cultural attitudes with art auction prices. Center for Financial Studies. https://www.econstor.eu/bitstream/10419/182452/1/1031264264.pdf. Accessed 24 Mar 2021
-
- American Statistical Association, Committee on Professional Ethics (2018) Ethical guidelines for statistical practice. https://www.amstat.org/ASA/Your-Career/Ethical-Guidelines-for-Statistica.... Accessed 3 May 2020
-
- Arts Council England (2014) The value of arts and culture to people and society: an evidence review. https://www.artscouncil.org.uk/sites/default/files/download-file/Value_a.... Accessed 7 Jun 2021
-
- Arts Council England (2019) Creative case for diversity. https://www.artscouncil.org.uk/diversity/creative-case-diversity. Accessed 28 Dec 2021
LinkOut - more resources
Full Text Sources
Research Materials