. 2022 Jul;11(7):e12242.
doi: 10.1002/jev2.12242.

Homosalate boosts the release of tumour-derived extracellular vesicles with protection against anchorage-loss property

Affiliations

Homosalate boosts the release of tumour-derived extracellular vesicles with protection against anchorage-loss property

Eleonora Grisard et al. J Extracell Vesicles. 2022 Jul.

Abstract

Eukaryotic cells, including cancer cells, secrete highly heterogeneous populations of extracellular vesicles (EVs). EVs could have different subcellular origin, composition and functional properties, but tools to distinguish between EV subtypes are scarce. Here, we tagged CD63- or CD9-positive EVs secreted by triple negative breast cancer cells with Nanoluciferase enzyme, to set-up a miniaturized method to quantify secretion of these two EV subtypes directly in the supernatant of cells. We performed a cell-based high-content screening to identify clinically-approved drugs able to affect EV secretion. One of the identified hits is Homosalate, an anti-inflammatory drug found in sunscreens which robustly increased EVs' release. Comparing EVs induced by Homosalate with those induced by Bafilomycin A1, we demonstrate that: (1) the two drugs act on EVs generated in distinct subcellular compartments, and (2) EVs released by Homosalate-, but not by Bafilomycin A1-treated cells enhance resistance to anchorage loss in another recipient epithelial tumour cell line. In conclusion, we identified a new drug modifying EV release and demonstrated that under influence of different drugs, triple negative breast cancer cells release EV subpopulations from different subcellular origins harbouring distinct functional properties.


Conflict of interest statement

The authors declare no conflict of interest.

Figures
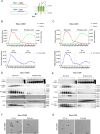
FIGURE 1
FIGURE 1
Nanoluciferase tagged CD63 and CD9 are secreted into EVs. (A) Left: scheme of Nluc‐CD63 and Nluc‐CD9 plasmid constructs. Nluc enzyme was cloned into CD63 or CD9 encoding plasmids at the N‐terminal position. Right: scheme of the topology of a tetraspanin (CD63 or CD9) with N‐terminal Nluc‐tag. (B) and (C) Measurement of total particle number (red line) by Nanoparticle Tracking Analysis (NTA), total protein in μg (green line) by BCA and total Nluc activity (blue line) in all single 500μl SEC fractions from F7 to F24 recovered from Nluc‐CD63 or Nluc‐CD9 supernatants. Shown data are from a single pilot experiment. (D) and (E) Western Blot analysis of SLC3A2/CD98, CD63, Syntenin, 14‐3‐3 and CD9 markers in SEC fractions from Nluc‐CD63 and Nluc‐CD9 cells. Arrows indicate chimeric (Nluc‐tagged) versus endogenous CD63 (D) or CD9 (E). (F) and (G) Representative TEM images showing CD63+ EVs (for Nluc‐CD63) or CD9+ EVs (for Nluc‐CD9) isolated from 7 × 106 cells in F7‐11 versus F12‐24. Scale bar 0.5 μm. Shown data are from a single pilot experiment. Arrowheads indicate EVs positive for CD63 staining (F) or CD9 staining (G)
FIGURE 2
FIGURE 2
Pipeline for high‐content screen to identify drugs modulating extracellular Nluc activity in Nluc‐CD63 and Nluc‐CD9 cells. (A) Representative scheme of the screening protocol. SFM = serum‐free medium. All drugs were used at 10 μM. (B) Representative example images of Hoechst nuclei staining for DMSO negative control (100% live cells), a high toxicity compound ( = compound 1: 37% live cells) or a low toxicity compound ( = compound 2: 100% live cells). Very round and bright nuclei are specific of dead cells. Total number of nuclei (i.e., total number of live + dead cells) and number of dead cell nuclei are counted, to calculate the actual number of live cells, in each condition as compared to the DMSO control. Green arrowheads: live cells; red arrowheads: dead cells. (C) Venn‐diagram summarizing the obtained screening results for two independent experiments. A total of 104 candidate compounds were identified. Among these, 53 only affected Nluc‐CD9, nine only affected Nluc‐CD63 and 42 affected both cell lines. For each group, the number of increasing or decreasing candidate compounds is reported. (D) Scheme of the decision‐tree for candidate compounds selection process. Compounds resulting in less than 80% viability and decreasing extracellular Nluc or less than 85% viability and increasing extracellular Nluc in the screening step were discarded. In the secondary selection step, compounds inducing the same trend of effect extracellularly and intracellularly were discarded
FIGURE 3
FIGURE 3
Identification of a drug increasing extracellular Nluc activity in Nluc‐CD63 and Nluc‐CD9 cells. (A) and (B) Selection of 25 compounds from the 104 total candidates in Nluc‐CD63 (A) and Nluc‐CD9 (B) following criteria described in Figure 2D. Blue graphs: for each compound, extracellular Nluc activity intensity measured in the screening is reported as robust Z‐score = [(compound value‐median of (Ref pop))/(MADnc X 1.4826)], MAD = [median (|Ref pop‐median (Ref pop)|)]. Increasing or decreasing hits were called according to the Threshold: |Robust Z score| > 2 or <−2. Red graphs: for each compound, intracellular Nluc activity intensity upon treatment with 10 μM of the candidate compounds was measured and reported as ratio on DMSO negative control. Data from two independent experiments are shown. Ordinary one‐way ANOVA, multiple comparisons test and Dunnett's test: *P < 0.05, **P < 0.01, ***P < 0.001, ****P < 0.0001. Arrows between blue and red show non‐selected compounds inducing the same trend of effect in cells and supernatants in both independent experiments, whereas green * symbols indicate compounds selected for further validation. (C) and (D) Validation of four of the identified candidates. For Nluc‐CD63 and Nluc‐CD9 cells, intracellular (red) versus supernatant (blue) Nluc activity was measured after treatment with Lyothyronine, Dipivefrin Hydrochloride, Metaraminol Bitartrate and Homosalate (10 μM each). Data are expressed as ratio on DMSO negative control and are from two independent experiments. Ordinary one‐way ANOVA, multiple comparisons test: *P < 0.05, **P < 0.01
FIGURE 4
FIGURE 4
Homosalate increases EV secretion enriching a population of SLC3A2/CD98‐positive EVs. (A) Quantification of cell viability after Homosalate (10 μM) treatment in MDA‐MB‐231 parental cells. DMSO or Homosalate treated cells were counted after collection of conditioned media, using Trypan Blue as a reporter of cell death. Cell viability is expressed in percentage. Data from five independent experiments are shown. (B) Quantification of EVs induced by treatment with Homosalate. Left panel: one representative graph showing particle concentration/cm3 versus particle size measured by NTA in inputs (total conditioned medium) and F7‐11 (EV‐rich SEC fractions) from 27 × 106 DMSO or Homosalate treated cells. Right panel: Graphs show total particle number secreted from 27 × 106cells measured by NTA in DMSO or Homosalate treated cells for inputs and SEC F7‐11, from five independent experiments. Paired parametric t‐test: **P < 0.01. (C) Representative TEM images showing (CD63+) or (CD9+) EVs in F7‐11 released by 2.7 × 106 DMSO or Homosalate treated cells. Arrowheads indicate EVs positive for CD63 staining (above) or CD9 staining (below). Graphs show quantification of the number ( = nb) of (CD63+EVs) + (CD9+ EVs) per μm2. Scale bar 0.5 μm. Data from two independent experiments are shown, each dot represents EVs counted in one field (DMSO: 20 dots for replicate 1, 18 dots for replicate 2; Homosalate: 20 dots for replicate 1, 18 dots for replicate 2). Mann‐Whitney test: **P < 0.01. (D) Western Blot analysis of markers SLC3A2/CD98, CD63, Syntenin, CD81 and CD9 in EVs released by cells treated with DMSO or Homosalate. Gels were loaded with EVs from the same number of secreting cells. Gapdh was used as normalizer for cell lysates (CL). CL from the equivalent of 200,000 cells were loaded, F7‐11 from the equivalent of 2.7 × 106 secreting cells were loaded. Graphs show protein signal quantifications normalized first on Gapdh and then on DMSO for CL or normalized on DMSO for F7‐11. Data from three independent experiments are shown. (E) Western Blot analysis of markers SLC3A2/CD98, CD63, Syntenin, CD81 and CD9 in EVs released by cells treated with DMSO or Homosalate, after gel loading with same numbers of particles. Gapdh was used as normalizer for CL. CL from the equivalent of 200,000 cells or an amount corresponding to 4 × 108 particles for F7‐11 were loaded. Graphs show protein signal quantifications normalized first on Gapdh and then on DMSO for CL or normalized on DMSO for F7‐11. Data from three independent experiments are shown. (F) Scheme of the multiplexed analysis strategy, and use on 1.7 × 109 EVs from DMSO‐treated MDA‐MB‐231 cells. Out of the 37 antibody‐coated beads, only 17 leading to specific MFI ( = MFI (beads+EVs) > MFI (beads‐no EVs)) after staining with mixed anti‐CD9/CD63/CD81 (top panel) or SLC3A2/CD98 are shown (bottom panel). Results obtained from four independent EV preparations are shown as individual dots. Kruskal‐Wallis followed by Dunn's post‐test comparing each capture bead with its correspondent isotype control. CD41b, CD81, CD105, HLA‐ABC, SSEA‐4 were compared to REA control and the rest were compared to IgG control: *P < 0.05, **P < 0.01, ***P < 0.001, ****P < 0.0001, #P = 0.07. (G) The same multiplexed analysis was performed on 1.7 × 109 EVs from Homosalate‐treated MDA‐MB‐231. Ratio of specific MFI of Homosalate‐EVs/DMSO‐EVs after staining with anti‐tetraspanins (tsp, top) or anti‐SLC3A2/CD98. Results obtained from four independent EV preparations are shown as individual dots. Two‐way ANOVA followed by Sidak's post‐test comparing DMSO with Homosalate: **P < 0.01, ****P < 0.0001
FIGURE 5
FIGURE 5
Homosalate increases the secretion of plasma membrane derived EVs. (A) Quantification of cell viability after Homosalate (10 μM) and Bafilomycin A1 (100 nM) treatment in MDA‐MB‐231 parental cells. DMSO, Homosalate or Bafilomycin A1 treated cells were counted after conditioned media collection, using Trypan Blue as a reporter of cell death. Cell viability is expressed in percentage. Data from five independent experiments are shown. (B) Quantification of EVs induced by treatment with Homosalate and Bafilomycin A1 in MDA‐MB‐231 parental cells. Left panel: Graphs show particle concentration/cm3 versus particle size measured by NTA in F7‐11 (EV‐rich SEC fractions) from 50 × 106 DMSO, Homosalate or Bafilomycin A1 treated cells. Right panel: Graphs show total particle number secreted from 50 × 106 cells measured by NTA in DMSO, Homosalate or Bafilomycin A1 treated cells for SEC F7‐11. Data from five independent experiments are shown. Paired parametric t‐test P = 0.04; P = 0.002. (C) Western Blot analysis of EV markers SLC3A2/CD98, CD9, CD81, Syntenin, CD63 and Lamp‐1 released after treatment with DMSO, Homosalate or Bafilomycin A1 after gel loading with same number of particles. CL from the equivalent of 200,000 cells or an amount corresponding to 4 × 108 particles from F7‐11 were loaded. Graphs show protein signal quantifications normalized to DMSO for F7‐11 after treatment with Homosalate (above) or Bafilomycin A1 (below). Data from five independent experiments are shown. Unpaired, multiple t‐test: #P = 0.08 (SLC3A2/CD98 in protein signal quantification after Homosalate treatment, top), #P = 0.09 (CD63 in protein signal quantification after Bafilomycin A1 treatment, bottom), **P < 0.01). (D) Immunofluorescence of SLC3A2/CD98, CD63 and CD9 in MDA‐MB‐231 treated with DMSO, Homosalate or Bafilomycin A1. Scale bar: 10 μm. (E) Graphs show Mander's correlation coefficients for CD98‐CD9, CD63‐CD9 or CD63‐CD98 co‐localization expressed as percentage. Ordinary one way Anova, multiple comparison test: **P < 0.01, ***P < 0.001. Data from three independent experiments are shown, each dot represents one counted cell (DMSO: 25 dots for replicate 1, 10 dots for replicate 2, 19 dots for replicate 3; Homosalate: 25 dots for replicate 1, 12 dots for replicate 2, 21 dots for replicate 3; Bafilomycin A1: 21 dots for replicate 1, 16 dots for replicate 2, 22 dots for replicate 3). (F) The same multiplexed analysis as in Figure 4(F‐G) was performed on 0.85‐1.7 × 109 EVs from DMSO‐ or Bafilomycin A1‐treated MDA‐MB‐231. Ratio of specific MFI of BafA1‐EVs/DMSO‐EVs after staining with anti‐tetraspanins (tsp, top) or anti‐SLC3A2/CD98 (CD98, bottom). Results obtained from three independent EV preparations are shown as individual dots. Two‐way ANOVA followed by Sidak's post‐test comparing DMSO with BafA1: *P < 0.05, **P < 0.01, ***P < 0.001, ****P < 0.0001
FIGURE 6
FIGURE 6
Homosalate‐, but not Bafilomycin A1‐derived EVs induce resistance to anchorage‐loss and increase migration. (A) Left panel: Representative scheme of EV treatment experiments in MCF7 cells. Middle panel: Representative graph of MCF7 real time adhesion and proliferation 1 h after treatment with EVs from DMSO, Homosalate (10 μM) or Bafilomycin A1 (100 nM) treated MDA‐MB‐231. Measurements were programmed every 30 min for a total time of 50 h in XCELLigence device. Right panel: graph showing quantification of slopes in the range 10–40 h. Data are expressed as ratio on DMSO negative control and are obtained from four independent experiments. Ordinary one‐way Anova test non‐significant (ns). (B) Left panel: Representative scheme of EV uptake followed by anoikis/resistance to anchorage‐loss assay in MCF7 cells. Middle panel: Representative graph of MCF7 real time adhesion and proliferation 1 h after uptake of EVs from DMSO, Homosalate or Bafilomycin A1 treated MDA‐MB‐231 and 24 h of anoikis assay. Measurements were programmed every 30 min for a total time of 50 h in XCELLigence device. Right panel: graph showing quantification of slopes in the range 10—40 h. Data are expressed as ratio on DMSO negative control and are obtained from four independent experiments. Ordinary one‐way ANOVA test: *P < 0.05. (C) Quantification of cell survival (fluorescence, left panel) and apoptosis (Caspase3/7 luminescence, right panel) in EV‐treated MCF7, after exposure for, respectively, 24 h and 6 h, to, respectively, 33.3 nM and 1 μM staurosporine. (D) Wound Healing assay: representative micrographs (left) and quantification of wound closure (right) by MCF7 cells pre‐treated with EVs from DMSO, Homosalate‐ or Bafilomycin A1‐treated MDA‐MB‐231 cells. Ordinary one‐way ANOVA test: #P = 0.07

References

    1. Alamer, M. , & Darbre, P. D. (2018). Effects of exposure to six chemical ultraviolet filters commonly used in personal care products on motility of MCF‐7 and MDA‐MB‐231 human breast cancer cells in vitro. Journal of Applied Toxicology, 38(2), 148–159. 10.1002/jat.3525 - DOI - PubMed
    1. Auld, D. S. , & Inglese, J. (2016). Interferences with Luciferase Reporter Enzymes. In S. Markossian (Eds.) et. al., Assay Guidance Manual Eli Lilly & Company and the National Center for Advancing Translational Sciences, 1(Md), 1–13. Available: http://www.ncbi.nlm.nih.gov/pubmed/27478246 - PubMed
    1. Auld, D. S. , Narahari, J. , Ho, P.‐I. , Casalena, D. , Nguyen, V. , Cirbaite, E. , Hughes, D. , Daly, J. , & Webb, B. (2018). Characterization and use of turboluc luciferase as a reporter for high‐throughput assays. Biochemistry, 57(31), 4700–4706. 10.1021/acs.biochem.8b00290 - DOI - PubMed
    1. Bebelman, M. P. , Bun, P. , Huveneers, S. , van Niel, G. , Pegtel, D. M. , & Verweij, F. J. (2020). Real‐time imaging of multivesicular body–plasma membrane fusion to quantify exosome release from single cells. Nature Protocols, 15(1), 102–121. 10.1038/s41596-019-0245-4 - DOI - PubMed
    1. Birmingham, A. , Selfors, L. M. , Forster, T. , Wrobel, D. , Kennedy, C. J. , Shanks, E. , Santoyo‐Lopez, J. , Dunican, D. J. , Long, A. , Kelleher, D. , Smith, Q. , Beijersbergen, R. L. , Ghazal, P. , & Shamu, C. E. (2009). Statistical methods for analysis of high‐throughput RNA interference screens. Nature Methods, 6(8), 569–575. 10.1038/nmeth.1351 - DOI - PMC - PubMed

Publication types