. 2022 Aug;608(7923):603-608.
doi: 10.1038/s41586-022-05053-w. Epub 2022 Jul 5.

Antibody evasion by SARS-CoV-2 Omicron subvariants BA.2.12.1, BA.4 and BA.5

Affiliations

Antibody evasion by SARS-CoV-2 Omicron subvariants BA.2.12.1, BA.4 and BA.5

Qian Wang et al. Nature. 2022 Aug.

Abstract

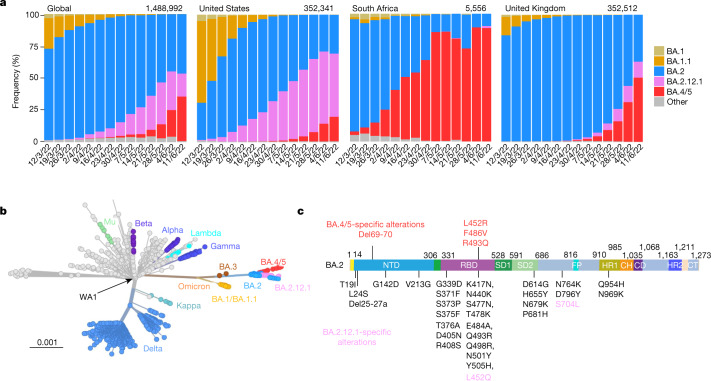
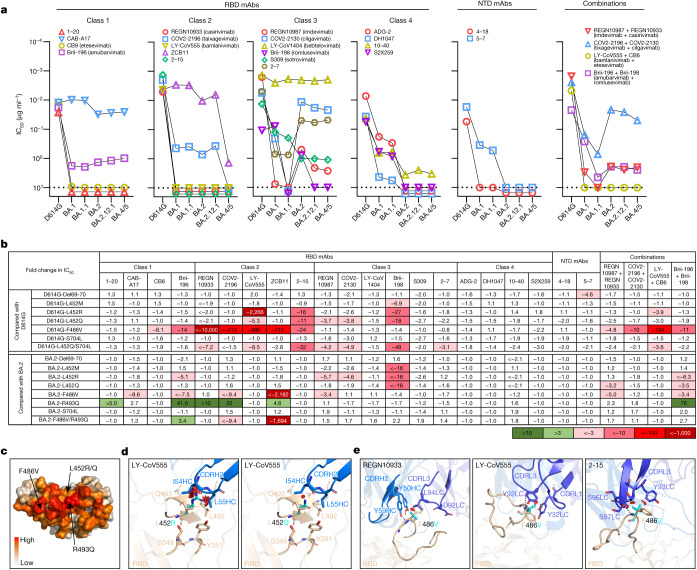
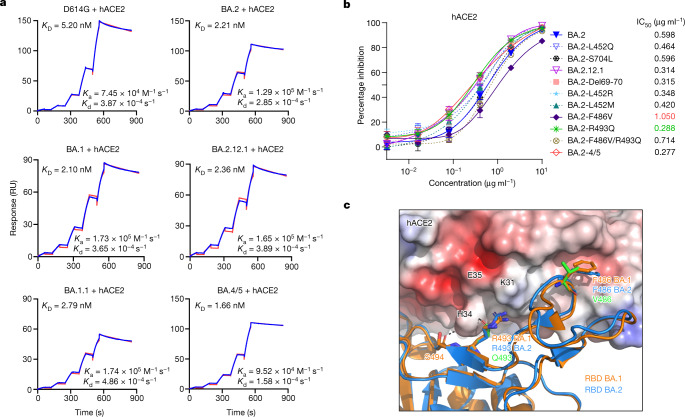
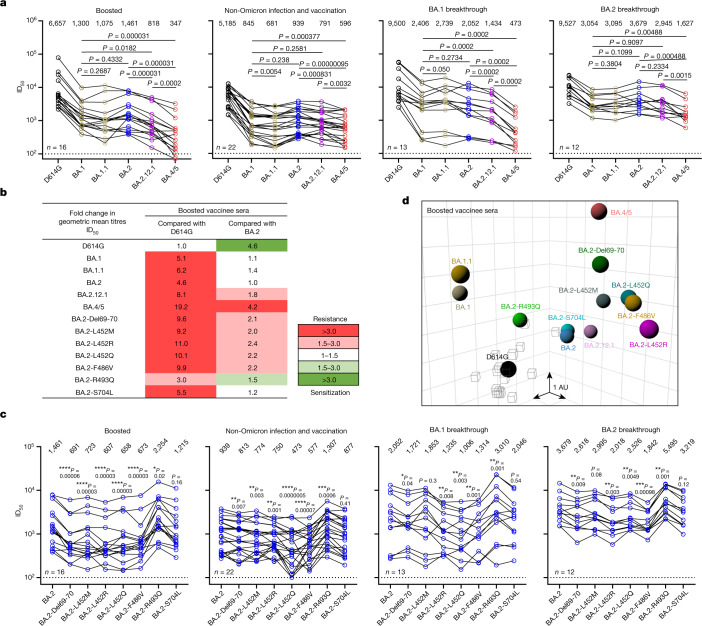
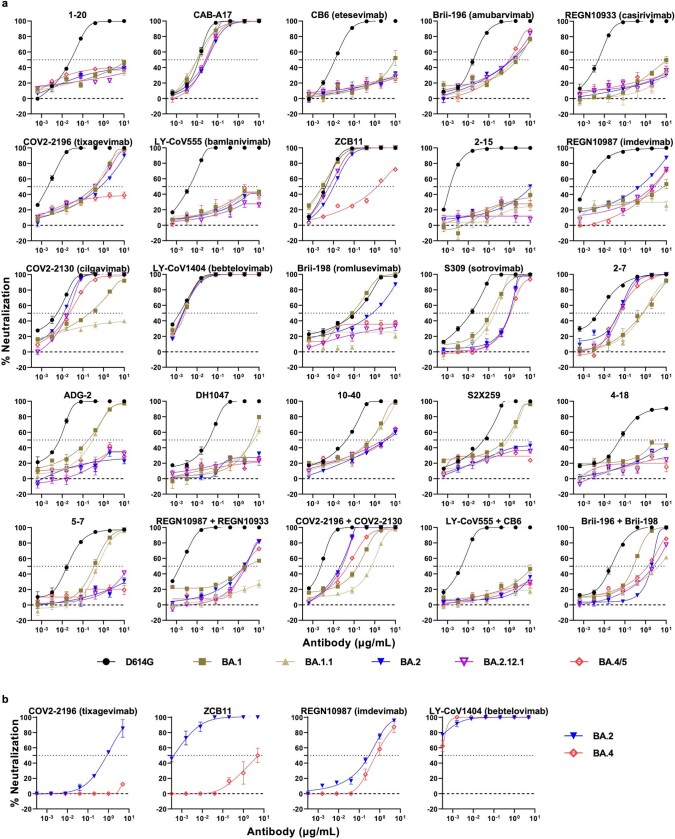
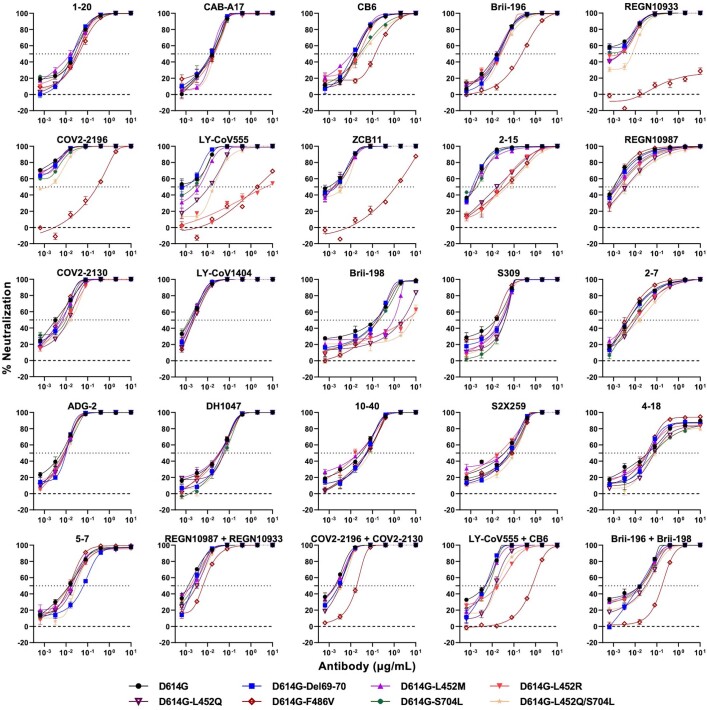
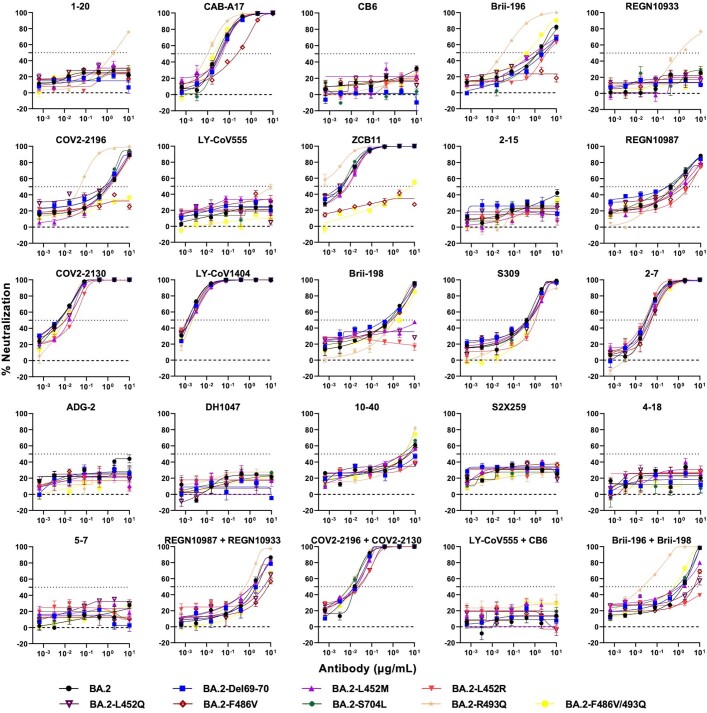
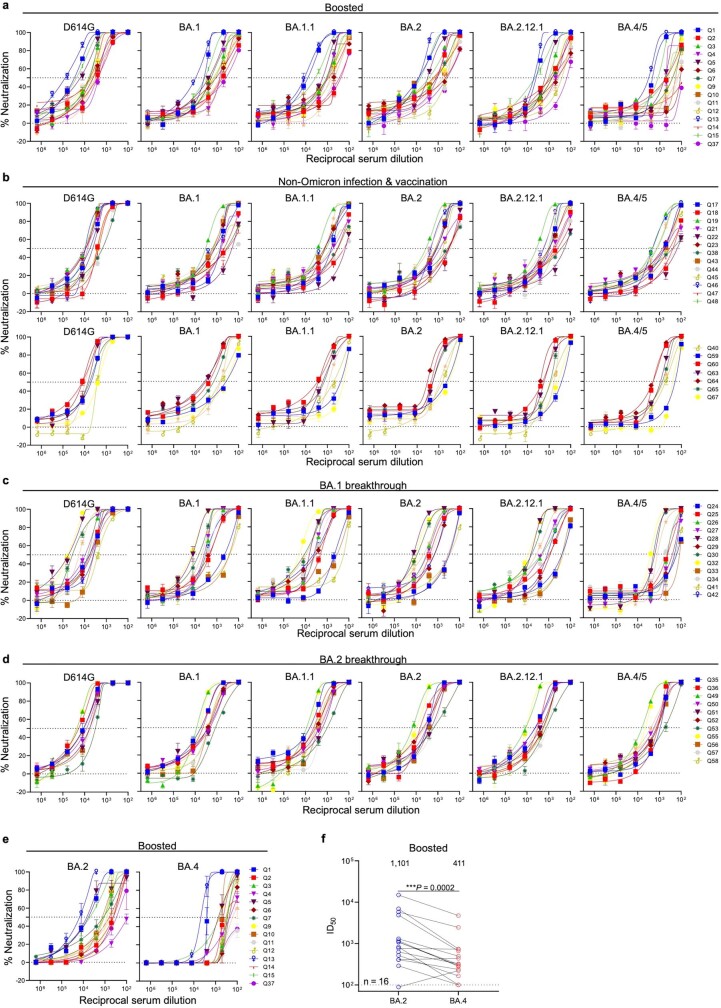
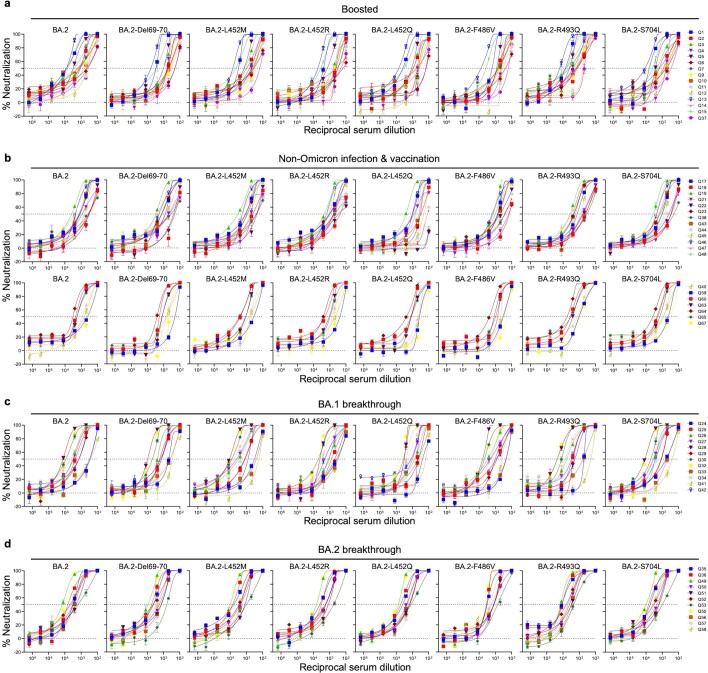
SARS-CoV-2 Omicron subvariants BA.2.12.1 and BA.4/5 have surged notably to become dominant in the United States and South Africa, respectively1,2. These new subvariants carrying further mutations in their spike proteins raise concerns that they may further evade neutralizing antibodies, thereby further compromising the efficacy of COVID-19 vaccines and therapeutic monoclonals. We now report findings from a systematic antigenic analysis of these surging Omicron subvariants. BA.2.12.1 is only modestly (1.8-fold) more resistant to sera from vaccinated and boosted individuals than BA.2. However, BA.4/5 is substantially (4.2-fold) more resistant and thus more likely to lead to vaccine breakthrough infections. Mutation at spike residue L452 found in both BA.2.12.1 and BA.4/5 facilitates escape from some antibodies directed to the so-called class 2 and 3 regions of the receptor-binding domain3. The F486V mutation found in BA.4/5 facilitates escape from certain class 1 and 2 antibodies but compromises the spike affinity for the viral receptor. The R493Q reversion mutation, however, restores receptor affinity and consequently the fitness of BA.4/5. Among therapeutic antibodies authorized for clinical use, only bebtelovimab retains full potency against both BA.2.12.1 and BA.4/5. The Omicron lineage of SARS-CoV-2 continues to evolve, successively yielding subvariants that are not only more transmissible but also more evasive to antibodies.


Conflict of interest statement

S.I, J.Y., Y.H., L.L. and D.D.H. are inventors on patent applications (WO2021236998) or provisional patent applications (63/271,627) filed by Columbia University for several SARS-CoV-2 neutralizing antibodies described in this paper. Both sets of applications are under review. D.D.H. is a cofounder of TaiMed Biologics and RenBio, consultant to WuXi Biologics and Brii Biosciences and board director for Vicarious Surgical.

Figures

Fig. 1
Fig. 1. Prevalence of SARS-CoV-2 Omicron subvariants.
a, Frequencies of BA.1, BA.1.1, BA.2, BA.2.12.1 and BA.4/5 deposited in GISAID. The value in the upper right corner of each box denotes the cumulative number of sequences for all circulating viruses in the denoted time period. b, Unrooted phylogenetic tree of Omicron and its subvariants along with other main SARS-CoV-2 variants. The scale bar indicates the genetic distance. c, Key spike mutations found in BA.2, BA.2.12.1, BA.4 and BA.5. Del, deletion.
Fig. 2
Fig. 2. Resistance of Omicron subvariants to neutralization by monoclonal antibodies.
a, Neutralization of D614G and Omicron subvariants by RBD- and NTD-directed mAbs. Values above the limit of detection of 10 μg ml−1 (dotted line) are arbitrarily plotted to allow for visualization of each sample. b, Fold change in IC50 values of point mutants relative to D614G or BA.2, with resistance coloured red and sensitization coloured green. c, Location of F486V, L452R/Q and R493Q on D614G RBD, with the colour indicating the per residue frequency recognized by SARS-CoV-2 neutralizing antibodies. d,e, Modelling of L452R/Q (d) and F486V (e) affect class 2 mAb neutralization. The clashes are shown with red plates; the hydrogen bonds are shown with dark dashed lines. The results shown in a and b are representative of those obtained in two independent experiments.
Fig. 3
Fig. 3. Affinity of the spike proteins of SARS-CoV-2 Omicron subvariants to hACE2.
a, Binding affinities of Omicron subvariant S2P spike proteins to hACE2 as measured by SPR. b, Sensitivity of pseudotyped Omicron subvariants and the individual mutations in the background of BA.2 to hACE2 inhibition. The hACE2 concentrations resulting in 50% inhibition of infectivity (IC50) are presented. Data are shown as mean ± standard error of mean (s.e.m.) for three technical replicates. c, In silico analysis for how R493Q and F486V affect hACE2 binding. The hACE2 surface is shown with charge potential, with red and blue representing negative and positive charges, respectively. Omicron BA.1 RBD in complex with hACE2 was downloaded from PDB 7U0N, and the ligand-free BA.2 RBD was downloaded from PDB 7UB0. The results shown in a and b are representative of those obtained in two independent experiments.
Fig. 4
Fig. 4. BA.2.12.1 and BA.4/5 exhibit greater serum neutralization resistance profiles relative to BA.2.
a, Neutralization of pseudotyped D614G and Omicron subvariants by sera from four different clinical cohorts. b, Fold change in geometric mean ID50 titres of boosted vaccinee sera relative to D614G and BA.2, with resistance coloured red and sensitization coloured green. c, Serum neutralization of BA.2 pseudoviruses containing single mutations found within BA.2.12.1 and BA.4/5. d, Antigenic map based on the neutralization data of boosted vaccinee sera. SARS-CoV-2 variants are shown as coloured circles and sera are shown as grey squares. The x, y and z axis represent antigenic units (AU) with one grid corresponding to a two-old serum dilution of the neutralization titre. An interactive map is available online (https://figshare.com/articles/media/OmicronAntigenicMap/19854046). The map orientation in the x, y and z axis is free to rotate. For all the panels in a and c, values above the symbols denote the geometric mean ID50 values and values on the lower left show the sample size (n) for each group. P values were determined by using two-tailed Wilcoxon matched-pairs signed-rank tests. The results shown are representative of those obtained in two independent experiments.
Extended Data Fig. 1
Extended Data Fig. 1. Pseudovirus (a) and authentic virus (b) neutralization curves of D614G and Omicron subvariants by monoclonal antibodies.
Data are shown as mean ± SEM from three technical replicates and representative of those obtained in two independent experiments.
Extended Data Fig. 2
Extended Data Fig. 2. Pseudovirus neutralization curves for monoclonal antibodies against individual SARS-CoV-2 mutations in the background of D614G.
Data are shown as mean ± SEM from three technical replicates and representative of those obtained in two independent experiments.
Extended Data Fig. 3
Extended Data Fig. 3. Pseudovirus neutralization curves for monoclonal antibodies against individual SARS-CoV-2 mutations in the background of BA.2.
Data are shown as mean ± SEM from three technical replicates and representative of those obtained in two independent experiments.
Extended Data Fig. 4
Extended Data Fig. 4. Neutralization curves of serum against D614G and Omicron subvariants.
Neutralization by a, boosted vaccinee sera on pseudoviruses. b, non-Omicron infection & vaccination sera on pseudoviruses. c, BA.1 breakthrough sera on pseudoviruses. d, BA.2 breakthrough sera on pseudoviruses. e, boosted vaccinee sera on authentic viruses. f, Neutralization ID50 titers of authentic BA.2 and BA.4 by boosted vaccinee sera. Values above the symbols denote the geometric mean ID50 values and values on the lower left show the sample size (n). P values were determined by using two-tailed Wilcoxon matched-pairs signed-rank tests. Error bars in a, b, c, d, and e denote mean ± SEM for three technical replicates. All data are representative of those obtained in two independent experiments.
Extended Data Fig. 5
Extended Data Fig. 5. Pseudovirus neutralization curves of serum against BA.2 and BA.2 pseudovirus carrying individual mutations.
Neutralization by a, boosted vaccinee sera. b, non-Omicron infection & vaccination sera. c, BA.1 breakthrough sera. d, BA.2 breakthrough sera. Error bars denote mean ± SEM for three technical replicates. Data are representative of those obtained in two independent experiments.

References

    1. Khan, K. et al. Omicron sub-lineages BA.4/BA.5 escape BA.1 infection elicited neutralizing immunity. Preprint at medRxiv10.1101/2022.04.29.22274477 (2022).
    1. Centers for Disease Control and Prevention. COVID Data Trackerhttps://covid.cdc.gov/covid-data-tracker/#variant-proportions (CDC, 2022).
    1. Barnes CO, et al. SARS-CoV-2 neutralizing antibody structures inform therapeutic strategies. Nature. 2020;588:682–687. doi: 10.1038/s41586-020-2852-1. - DOI - PMC - PubMed
    1. Shu Y, McCauley J. GISAID: global initiative on sharing all influenza data—from vision to reality. Euro. Surveill. 2017;22:30494. doi: 10.2807/1560-7917.ES.2017.22.13.30494. - DOI - PMC - PubMed
    1. Hansen J, et al. Studies in humanized mice and convalescent humans yield a SARS-CoV-2 antibody cocktail. Science. 2020;369:1010–1014. doi: 10.1126/science.abd0827. - DOI - PMC - PubMed

MeSH terms