. 2022 Jul 5;13(1):3856.
doi: 10.1038/s41467-022-31190-x.

Spatial regulation of AMPK signaling revealed by a sensitive kinase activity reporter

Affiliations

Spatial regulation of AMPK signaling revealed by a sensitive kinase activity reporter

Danielle L Schmitt et al. Nat Commun. .

Abstract

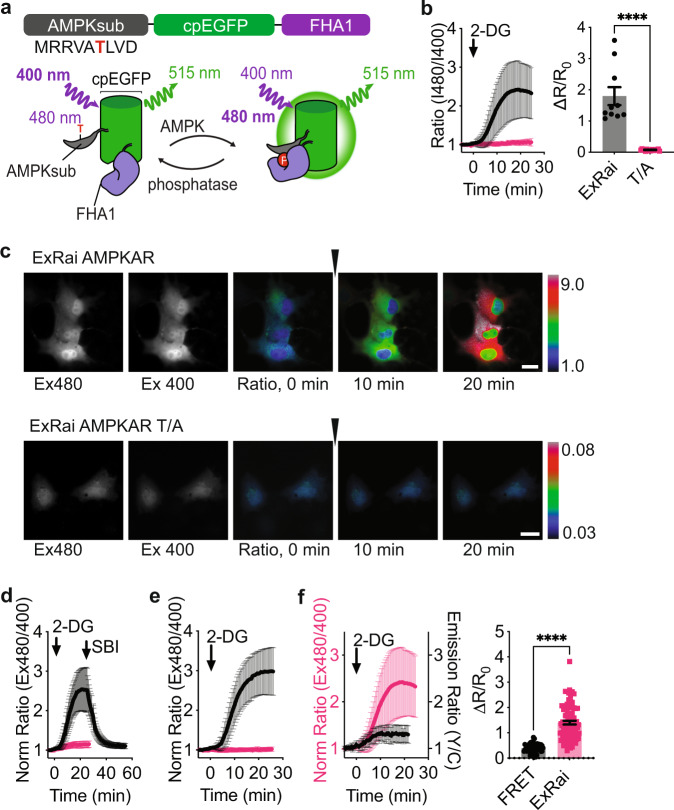
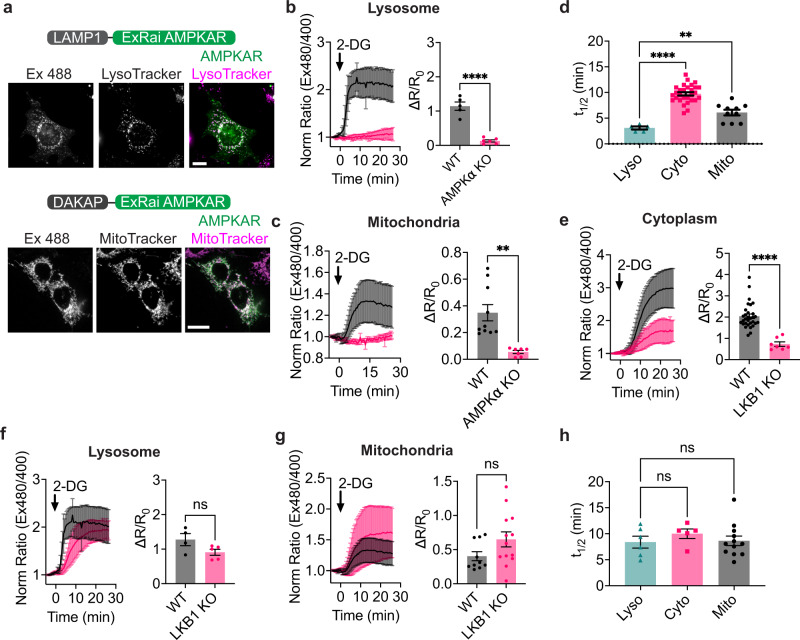
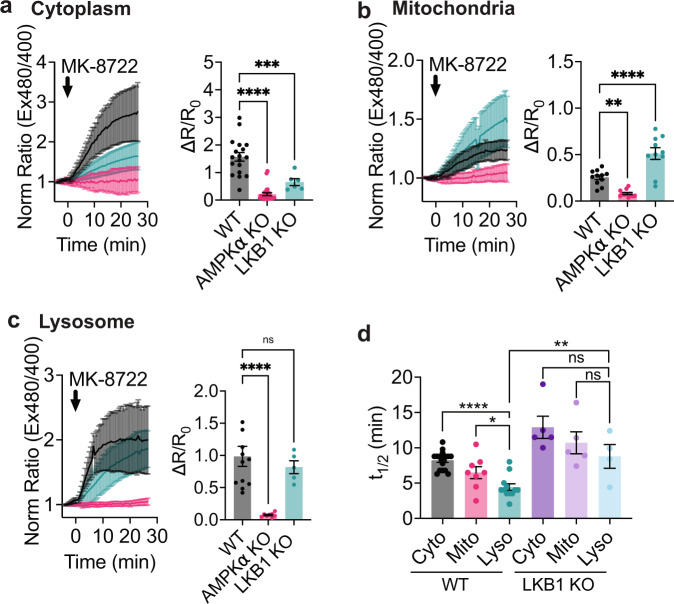
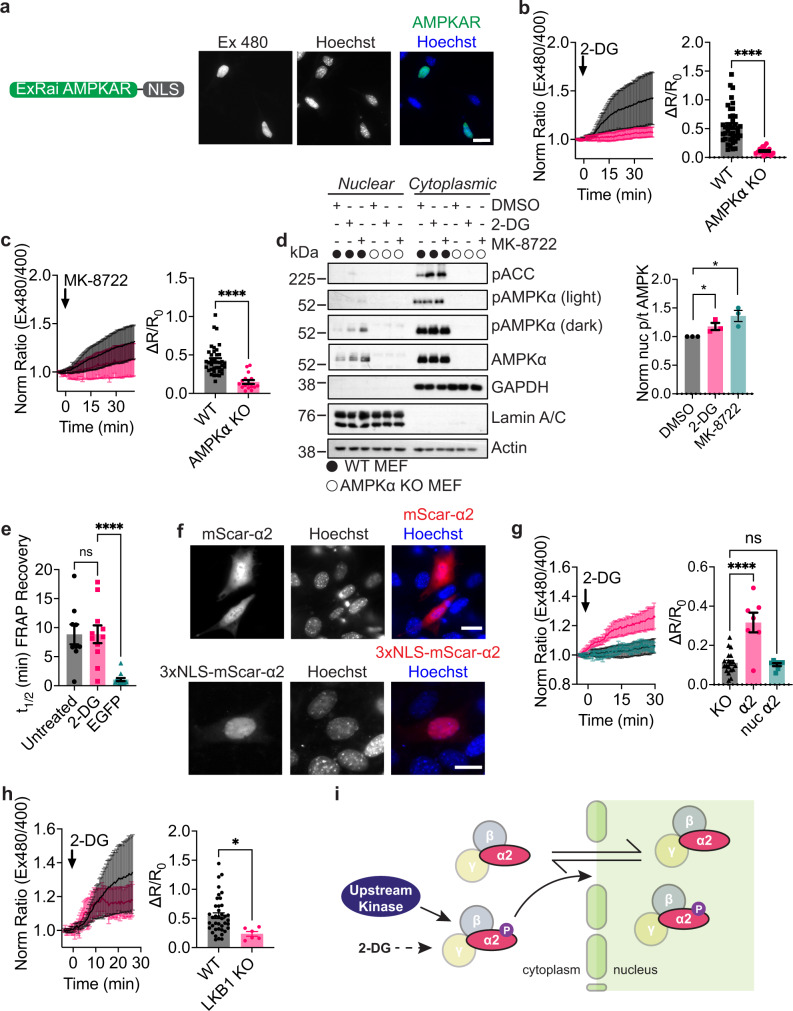
AMP-activated protein kinase (AMPK) is a master regulator of cellular energetics which coordinates metabolism by phosphorylating a plethora of substrates throughout the cell. But how AMPK activity is regulated at different subcellular locations for precise spatiotemporal control over metabolism is unclear. Here we present a sensitive, single-fluorophore AMPK activity reporter (ExRai AMPKAR), which reveals distinct kinetic profiles of AMPK activity at the mitochondria, lysosome, and cytoplasm. Genetic deletion of the canonical upstream kinase liver kinase B1 (LKB1) results in slower AMPK activity at lysosomes but does not affect the response amplitude at lysosomes or mitochondria, in sharp contrast to the necessity of LKB1 for maximal cytoplasmic AMPK activity. We further identify a mechanism for AMPK activity in the nucleus, which results from cytoplasmic to nuclear shuttling of AMPK. Thus, ExRai AMPKAR enables illumination of the complex subcellular regulation of AMPK signaling.


Conflict of interest statement

The authors declare no competing interests.

Figures

Fig. 1
Fig. 1. Development and characterization of ExRai AMPKAR.
a Design and domain structure of ExRai AMPKAR. Threonine phosphorylated by AMPK denoted in red. b Average response of ExRai AMPKAR (black, n = 10 cells from three experiments), and ExRai AMPKAR T/A (pink, n = 17 cells from three experiments) to 2-DG (40 mM) stimulation in Cos7 cells along with maximum ratio change (****p = 3.05 × 10−8, unpaired t-test, two-tailed). c Representative images of ExRai AMPKAR (top) and ExRai AMPKAR T/A (bottom) in Cos7 cells treated with 2-DG (40 mM) at the indicated time. d Average response of ExRai AMPKAR to AMPK stimulation by 2-DG (40 mM) followed by SBI-0206965 (SBI, 30 µM, black, n = 35 cells from three experiments) or after pretreatment with SBI-0206965 in HEK293T cells (pink, n = 43 cells from four experiments). e Average response of ExRai AMPKAR in WT MEFs (black, n = 31 cells from four experiments) and AMPKα KO MEFs (pink, n = 23 cells from four experiments) treated with 2-DG (40 mM). f Response of ExRai AMPKAR (pink, n = 90 cells from five experiments) and FRET-based AMPK reporter ABKAR (black trace, n = 25 cells from two experiments) in HEK293T cells treated with 2-DG (40 mM), along with maximum ratio change (****p = 4.31 × 10−19, unpaired t-test, two-tailed). For all figures, time courses show the mean ± SD, dot plots show the mean ± SEM. Scale bars, 20 µm.
Fig. 2
Fig. 2. Lysosomal AMPK activity is rapidly induced in an LKB1-dependent manner.
a (Top) Domain layout and representative image of lyso-ExRai AMPKAR in MEFs stained with the lysosomal marker LysoTracker Red. (Bottom) Domain layout and representative image of mito-ExRai AMPKAR in MEFs stained with the mitochondrial marker MitoTracker Red. b Average response of lyso-ExRai AMPKAR in WT (black, n = 5 cells from two experiments) and AMPKα KO MEFs (pink, n = 6 cells from two experiments) to 2-DG (40 mM) stimulation, along with maximum ratio change (p = 9.66 × 10−6, unpaired t-test, two-tailed). c Average response of mito-ExRai AMPKAR in WT (black, n = 10 cells from five experiments and AMPKα KO MEFs (pink, n = 7 cells from three experiments) treated with 2-DG (40 mM) along with maximum ratio change (**p = 0.0012, unpaired t-test, two-tailed). d Time to half-maximal response (t1/2) of lyso-ExRai AMPKAR (teal), cytoplasmic ExRai AMPKAR (pink), and mito-ExRai AMPKAR (black) following treatment with 2-DG (**p = 0.0033; ****p = 4.43 × 10−10, one-way ANOVA with Dunnett’s multiple comparisons test). e Average response to 2-DG (40 mM) stimulation of cytoplasmic ExRai AMPKAR in WT (black, reproduced from Fig. 1e) and LKB1 KO MEFs (pink, n = 7 cells from four experiments), along with maximum ratio changes (****p = 1.57 × 10−6, unpaired t-test, two-tailed). f Average response to 2-DG (40 mM) stimulation of lyso-ExRai AMPKAR in WT (black, reproduced from b) and LKB1 KO MEFs (pink, n = 5 cells from four experiments), along with maximum ratio changes (ns p = 0.084, unpaired t-test, two-tailed). g Average response to 2-DG (40 mM) stimulation of mito-ExRai AMPKAR in WT (black, reproduced from c) and LKB1 KO MEFs (pink, n = 13 cells from five experiments), along with maximum ratio changes (ns p = 0.09, unpaired t-test, two-tailed). h t1/2 of lyso-ExRai AMPKAR (teal, n = 6 cells from four experiments), cytoplasmic ExRai AMPKAR (pink, n = 5 cells from four experiments), and mito-ExRai AMPKAR (black, n = 10 cells from five experiments) following treatment with 2-DG in LKB1 KO MEFs (ns p ≥ 0.55, one-way ANOVA with Dunnett’s multiple comparisons test). For all figures, time courses show the mean ± SD, dot plots show the mean ± SEM. Scale bars, 20 µm.
Fig. 3
Fig. 3. AMPK activity induced by MK-8722 exhibits distinct spatiotemporal dynamics.
a Average response of ExRai AMPKAR in WT (black, n = 18 cells from three experiments), AMPKα KO (pink, n = 25 cells from three experiments), and LKB1 KO MEFs (teal, n = 6 cells from four experiments) treated with MK-8722 (500 nM) along with maximum ratio change (***p = 0.002, ****p < 1 × 10−10, one-way ANOVA with Dunnett’s multiple comparisons test). b Average response of mito-ExRai AMPKAR in WT (black, n = 11 cells from four experiments), AMPKα KO (pink, n = 11 cells from three experiments), and LKB1 KO MEFs (teal, n = 10 cells from five experiments) treated with MK-8722 (500 nM) along with maximum ratio change (**p = 0.0048, ****p = 9.76 × 10−5, one-way ANOVA with Dunnett’s multiple comparisons test). c Average response of lyso-ExRai AMPKAR in WT (black, n = 12 cells from three experiments), AMPKα KO (pink, n = 8 cells from three experiments) and LKB1 KO MEFs (teal, n = 5 cells from four experiments) to MK-8722 (500 nM) stimulation, along with maximum ratio change (ns = 0.66, ***p < 0.0001, one-way ANOVA with Dunnett’s multiple comparisons test). d t1/2 of cytoplasmic ExRai AMPKAR (black, n = 19 cells from three experiments), mito-ExRai AMPKAR (pink, n = 11 cells from four experiments), and lyso-ExRai AMPKAR (teal, n = 12 cells from three experiments) expressed in WT MEFs, and cytoplasmic ExRai AMPKAR (dark purple, n = 5 cells from four experiments), mito-ExRai AMPKAR (light purple, n = 5 cells from five experiments), and lyso-ExRai AMPKAR (light blue, n = 5 cells from four experiments) expressed in LKB1 KO MEFs following treatment with MK-8722 (*p = 0.0203; ****p = 1.47 × 10−6, ns ≥0.18, one-way ANOVA with Dunnett’s multiple comparisons test, **p = 0.0031, unpaired t-test, two-tailed). For all figures, time courses show the mean ± SD, dot plots show the mean ± SEM.
Fig. 4
Fig. 4. Nuclear AMPK activity measured using ExRai AMPKAR.
a Domain layout and representative image of ExRai AMPKAR-NLS expressed in MEFs stained with Hoechst nuclear marker. b Average response of ExRai AMPKAR-NLS in either WT (black, n = 46 cells from five experiments) or AMPKα KO MEFs (pink, n = 19 cells from four experiments) treated with 2-DG (40 mM), along with maximum ratio change (****p = 1.51 × 10−7, unpaired t-test, two-tailed). c Average response of ExRai AMPKAR-NLS in either WT (black, n = 38 cells from nine experiments) or AMPKα KO MEFs (pink, n = 16 cells from two experiments) treated with MK-8722 (500 nM), along with maximum ratio change (****p = 6.35 × 10−7, unpaired t-test, two-tailed). d Western blot of nuclear-fractionated MEFs treated with DMSO, 2-DG (40 mM), or MK-8722 (500 nM) for 60 min. Quantification from three independent trials (*p = 0.047 DMSO vs. 2-DG; 0.020 DMSO vs. MK-8722, unpaired t-test, two-tailed). Full blots are shown in Source Data. e Half-time of FRAP recovery (min) for nuclear EGFP-AMPKα2 in AMPKα KO MEFs either without (n = 9 cells from three experiments) or with 2-DG stimulation (40 mM, n = 11 cells from three experiments) immediately before FRAP experiment began, or for EGFP alone (n = 13 cells from two experiments; ns p = 0.999; ****p < 0.0001, one-way ANOVA with Dunnett’s multiple comparisons test). f Representative images of mScarlet-AMPKα2 or 3xNLS-mScarlet-AMPKα2 in MEFs stained with Hoechst nuclear marker. g Average 2-DG (40 mM)-stimulated response of AMPKα KO MEFs expressing ExRai AMPKAR-NLS alone (black, reproduced from b) or co-expressing mScarlet-AMPKα2 (pink, n = 7 cells from two experiments) or 3xNLS-mScarlet-AMPKα2 (teal, n = 8 cells from four experiments), along with maximum ratio change (ns p = 0.96; ****p = 8.67 × 10−7, one-way ANOVA with Dunnett’s multiple comparisons test). h Average response of ExRai AMPKAR-NLS in either WT (black, reproduced from b) or LKB1 KO MEFs (pink, n = 6 cells from four experiments) treated with 2-DG (40 mM), along with maximum ratio change (*p = 0.021, unpaired t-test, two-tailed). i Mechanism of 2-DG-induced nuclear AMPK activity where nuclear AMPK activity in response to 2-DG is initiated in the cytoplasm dependent on upstream kinases, after which AMPK then translocates into the nucleus to phosphorylate nuclear targets. For all figures, time courses show the mean ± SD, dot plots show the mean ± SEM. Scale bars, 20 µm.

References

    1. Herzig S, Shaw RJ. AMPK: guardian of metabolism and mitochondrial homeostasis. Nat. Rev. Mol. Cell Biol. 2018;19:121–135. doi: 10.1038/nrm.2017.95. - DOI - PMC - PubMed
    1. Xiao B, et al. Structure of mammalian AMPK and its regulation by ADP. Nature. 2011;472:230–233. doi: 10.1038/nature09932. - DOI - PMC - PubMed
    1. Xiao B, et al. Structural basis of AMPK regulation by small molecule activators. Nat. Commun. 2013;4:3017. doi: 10.1038/ncomms4017. - DOI - PMC - PubMed
    1. Woods A, et al. LKB1 is the upstream kinase in the AMP-activated protein kinase cascade. Curr. Biol. 2003;13:2004–2008. doi: 10.1016/j.cub.2003.10.031. - DOI - PubMed
    1. Shaw RJ, et al. The tumor suppressor LKB1 kinase directly activates AMP-activated kinase and regulates apoptosis in response to energy stress. Proc. Natl Acad. Sci. USA. 2004;101:3329–3335. doi: 10.1073/pnas.0308061100. - DOI - PMC - PubMed

Publication types

MeSH terms

Substances