. 2022 Jul 5;13(7):582.
doi: 10.1038/s41419-022-05025-y.

Role of pericytes in blood-brain barrier preservation during ischemia through tunneling nanotubes

Affiliations

Role of pericytes in blood-brain barrier preservation during ischemia through tunneling nanotubes

Francesco Pisani et al. Cell Death Dis. .

Abstract

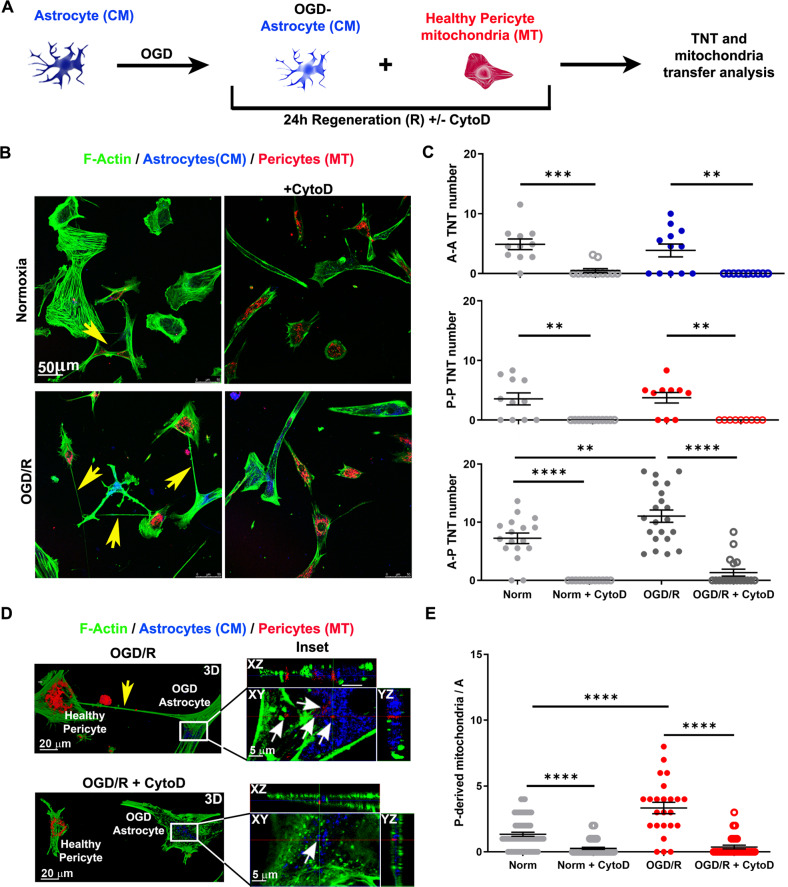
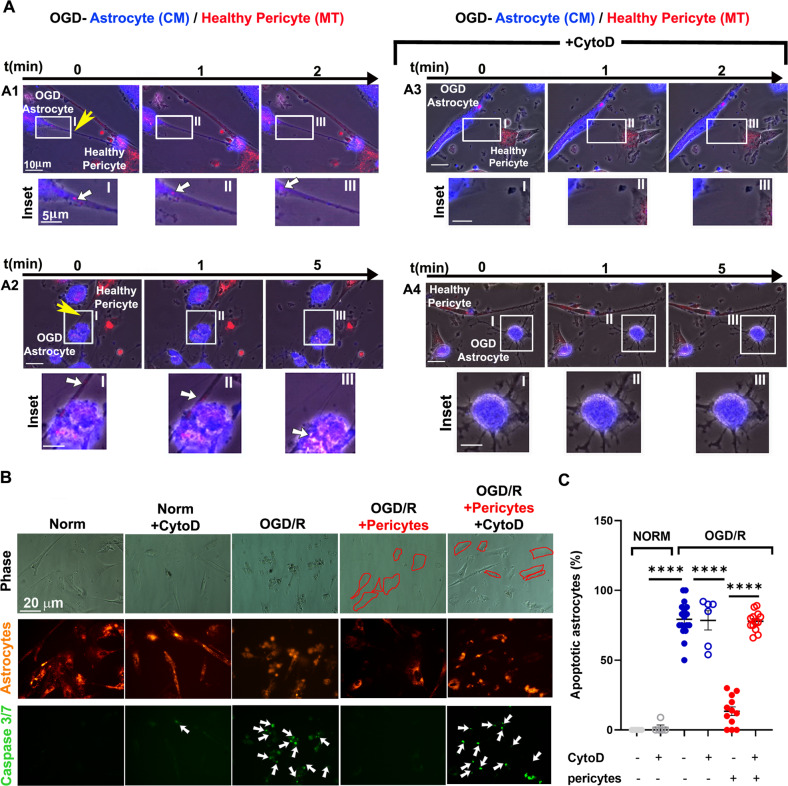
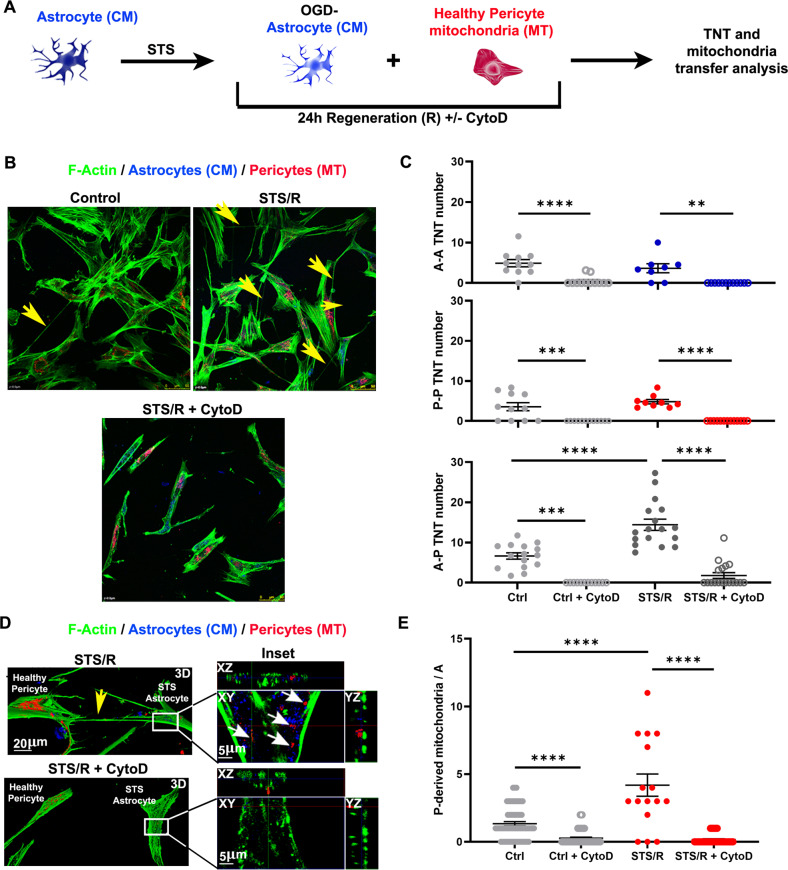
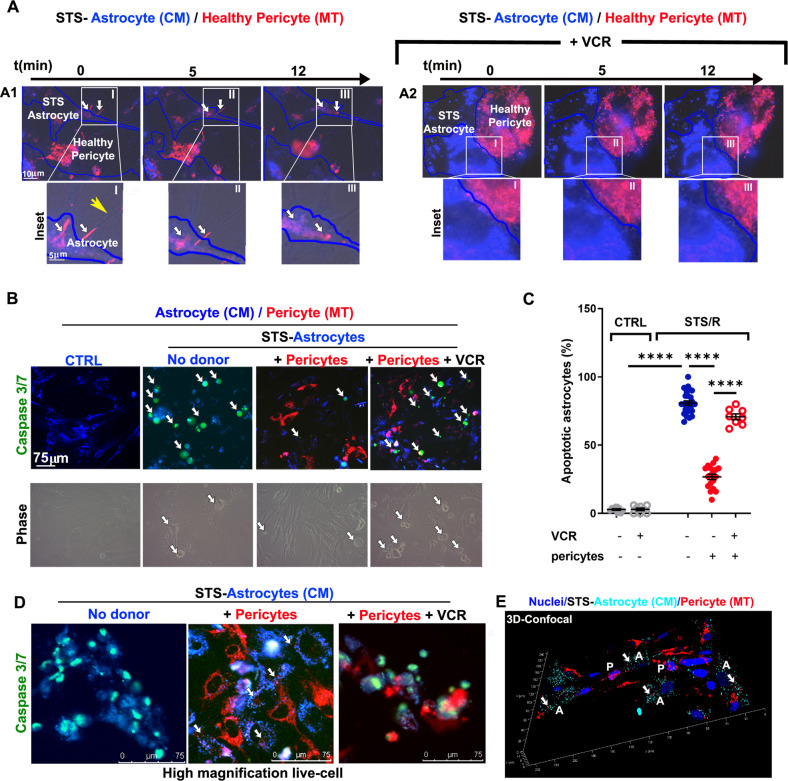
Crosstalk mechanisms between pericytes, endothelial cells, and astrocytes preserve integrity and function of the blood-brain-barrier (BBB) under physiological conditions. Long intercellular channels allowing the transfer of small molecules and organelles between distant cells called tunneling nanotubes (TNT) represent a potential substrate for energy and matter exchanges between the tripartite cellular compartments of the BBB. However, the role of TNT across BBB cells under physiological conditions and in the course of BBB dysfunction is unknown. In this work, we analyzed the TNT's role in the functional dialog between human brain endothelial cells, and brain pericytes co-cultured with human astrocytes under normal conditions or after exposure to ischemia/reperfusion, a condition in which BBB breakdown occurs, and pericytes participate in the BBB repair. Using live time-lapse fluorescence microscopy and laser-scanning confocal microscopy, we found that astrocytes form long TNT with pericytes and endothelial cells and receive functional mitochondria from both cell types through this mechanism. The mitochondrial transfer also occurred in multicellular assembloids of human BBB that reproduce the three-dimensional architecture of the BBB. Under conditions of ischemia/reperfusion, TNT formation is upregulated, and astrocytes exposed to oxygen-glucose deprivation were rescued from apoptosis by healthy pericytes through TNT-mediated transfer of functional mitochondria, an effect that was virtually abolished in the presence of TNT-destroying drugs. The results establish a functional role of TNT in the crosstalk between BBB cells and demonstrate that TNT-mediated mitochondrial transfer from pericytes rescues astrocytes from ischemia/reperfusion-induced apoptosis. Our data confirm that the pericytes might play a pivotal role in preserving the structural and functional integrity of BBB under physiological conditions and participate in BBB repair in brain diseases.


Conflict of interest statement

The authors declare no competing interests.

Figures

Fig. 1
Fig. 1. Pericytes transfer functional mitochondria to astrocytes via TNT.
Functional mitochondria of pericytes were stained with ΔΨ-dependent MitoTracker Deep Red (MT; red), while the plasma membrane of astrocytes was stained with CellMask Orange (CM; blue). Cells were co-cultured and analyzed for intercellular trafficking of mitochondria by time-lapse and confocal fluorescence microscopy. A Live time-lapse analysis of mitochondria trafficking. Immediately after seeding, MT-labeled mitochondria (red) from pericytes are actively transferred to astrocytes at direct contacts (panel A1; Suppl. Movie 1). After 1 h (panel A2; Suppl. Movie 2) and up to 24 h (panels A3, A4; Suppl. Movies 3–7), long plasma membrane intercellular bridges, a.k.a. TNT, are formed through which mitochondria are transferred from pericytes to astrocytes. After a few hours, the plasma membrane marker of astrocytes undergoes internalization in the form of intracellular vesicles (blue) due to the ongoing membrane turnover. Yellow arrows, TNT; white arrows, mitochondria. Representative images from N = 7 independent preparations, with > 10 sampled areas per experiment. B Widefield imaging of a long pericyte-astrocyte TNT. TNT (200 μm in length; yellow arrow) between a pericyte (red, left) and an astrocyte (blue, right) acquired by live widefield fluorescence microscopy. Note the presence of pericyte mitochondria (white arrows) inside the TNT. C Confocal imaging of pericyte-pericyte TNT. After 24 h of co-culture, cells were fixed and stained for F-actin using fluorescent phalloidin (green). 3D reconstruction of a long (> 200 μm) pericyte-pericyte TNT in which many mitochondria are visible. D 3D reconstruction of a long pericyte-astrocyte TNT. The long TNT stained for F-actin using fluorescent phalloidin (green) is detached from the glass surface and connects to an astrocyte along which mitochondria from the pericyte are visible (inset I; red). The lower inset (inset II) shows an intracellular XY plane of the CM-labeled astrocyte (blue intracellular vesicles) in which many mitochondria of pericyte origin are visible (red). Representative images from N = 3 independent experiments with > 10 sampled areas per experiment. E Quantification of homotypic-TNT (A-A or P-P) and heterotypic-TNT (A-P) number after 24 h of co-culture. A single dot represents the TNT number/field of 50 cells. N = 3 independent experiments with > 10 sampled areas per experiment. F Quantification of homotypic-TNT and heterotypic-TNT length after 24 h of co-culture. N = 3 independent experiments with > 10 sampled areas per experiment. G GFAP immunofluorescence analysis. 3D reconstruction, XY plane, and Z-projections by confocal microscopy show pericyte mitochondria inside GFAP-positive astrocytes. Representative images from N = 3 independent experiments with > 10 sampled areas per experiment. In E, F: N = 3 independent experiments with > 10 sampled areas per experiment. *p < 0.05, **p < 0.005; Kruskal–Wallis/Dunn’s tests.
Fig. 2
Fig. 2. Endothelial cells transfer functional mitochondria to astrocytes via TNT.
Functional mitochondria of endothelial cells were stained with MT (red), while astrocyte membranes were labeled with CM (blue). Live-stained cells were co-cultured and analyzed for intercellular mitochondria transport by time-lapse and confocal fluorescence microscopy. A Live-cell time-lapse analysis of mitochondrial trafficking. One hour after seeding, red-mitochondria (white arrows) from endothelial cells were actively transferred to astrocytes at cell-to-cell contacts (panel A1, Suppl. Movie #8). After a few hours and up to 24–48 h, long intercellular TNT connected astrocytes with endothelial cells and transferred mitochondria (white arrows) from endothelial cells to astrocytes (A2-A4; Suppl. Movie #9). Representative frames from N = 7 independent preparations, with > 10 sampled areas per experiment. B Confocal imaging of a long endothelial cell-astrocyte TNT. 3D reconstruction of XY confocal planes of a 120 µm-long TNT connecting an astrocyte (GFAP, blue) to an endothelial cell. The magnified inset reported at the bottom, shows the 3D reconstruction of endothelial mitochondria (red) traveling along the TNT (actin, green). The magnified inset reported on the right shows a single XY plane and XZ/YZ projections of a TNT attached to the astrocyte in which endothelial mitochondria are localized. C Confocal microscopy analysis of F-actin (green), astrocyte plasma membrane and internalized vesicles (cyano), and endothelial mitochondria (red). Note the presence of endothelial-derived mitochondria inside the astrocyte. Representative frames from N = 3 independent preparations, with > 10 sampled areas per experiment. D GFAP immunofluorescence analysis. 3D reconstruction, XY plane and Z-projections show the presence of endothelial mitochondria inside a GFAP-positive astrocyte. Representative images from N = 3 independent preparations, with > 10 sampled areas per experiment. E Quantification of homotypic-TNT (A-A or E-E) and heterotypic-TNT (AE) number after 24 h of co-culture. A single dot represents the TNT number/field of 50 cells. F Quantification of homotypic and heterotypic TNT length after 24 h of co-culture. In E, F: N = 3 independent experiments with > 10 sampled areas per experiment. Kruskal–Wallis/Dunn’s tests.
Fig. 3
Fig. 3. Endothelial cells and pericytes transfer functional mitochondria to astrocytes in a 3D assembloids model of human BBB.
A, B Functional mitochondria from either pericytes or brain endothelial cells were stained with MT (red), while astrocyte membranes were labeled with CM (blue). To generate BBB assembloids, labeled astrocytes were cultured with either labeled pericytes and unlabeled endothelial cells (A) or labeled endothelial cells and unlabeled pericytes (B). After 2 days in culture, assembloids were fixed and analyzed by confocal microscopy for MT localization. 3D reconstructions and Z-projections acquired at low magnification show either pericytes (A1, red) or endothelial cells (B1, red) localized in the assembloid shell, with astrocytes localized in the assembloid core (A1, B1, blue). In both cases, high magnification analysis reveal MT-stained mitochondria (red) in the assembloid core (A2/A3; B2/B3). Representative images from N = 3 independent preparations with N ≥ 3 assembloids per experiment. C, D Immunofluorescence and high magnification confocal analysis of the assembloid core using anti-GFAP antibodies. XY planes and Z projections of the assembloid core show MT-stained mitochondria (red) from either pericyte (C) or endothelial cells (D) inside GFAP-positive astrocytes. Representative images from N = 2 independent experiments in which N ≥ 6 assembloids per experiment were analyzed.
Fig. 4
Fig. 4. Oxygen-glucose deprivation/reoxygenation boost TNT formation between astrocytes and healthy pericytes in a cytoskeleton-dependent manner.
A Schematic representation of the oxygen-glucose deprivation/reoxygenation (OGD/R) paradigm. Astrocytes, stained with CM and exposed to 2% O2 for 24 h in glucose- and serum-free medium (OGD), were co-cultured for 24 h (regeneration phase) with a constant number of healthy MT-stained pericytes in the presence or absence of Cytochalasin D (CytoD; 200 nM). Cells were fixed and analyzed by confocal microscopy for TNT structure and number, phalloidin-labeled F-actin, and mitochondria transfer. B OGD-astrocytes trigger heterotypic-TNT formation with healthy pericytes. Astrocyte-to-pericyte TNT (yellow arrows) are indicated in normoxia and in OGD/R. Note that OGD/R trigger TNT while CytoD completely prevents TNT formation. Images are representative of N = 4 independent experiments. C Quantitative evaluation of the astrocyte-astrocyte (A-A), pericyte-pericyte (P-P) and heterotypic astrocyte-pericyte (A-P) number of TNT after 24 h of co-culture. OGD/R strongly upregulates heterotypic-TNT formation, while CytoD completely prevents TNT formation in control and OGD/R conditions. A single dot represents the TNT number/field of 50 cells. N = 3; **p < 0.005 ***p < 0.001, ****p < 0.0001; two-way ANOVA/Tukey’s tests. D 3D confocal reconstruction at higher magnification of the experiments shown in B. XY plane and Z-projections show a representative [OGD/R astrocytes + pericytes] co-culture incubated in the absence (up) or presence of CytoD (bottom). TNT between OGD/R astrocyte and pericyte and pericyte-derived mitochondria are indicated by yellow and white arrows, respectively. Note that CytoD treatment prevents the formation of TNT and strongly reduces mitochondria transfer from pericytes to astrocytes. Images are representative of N = 4 independent experiments. E Quantification of pericyte-to-astrocyte mitochondrial transfer. N = 3; ****p < 0.0001; two-way ANOVA/Tukey’s tests.
Fig. 5
Fig. 5. TNT-mediated mitochondrial transfer from pericytes rescues OGD-induced apoptosis of astrocytes.
Astrocytes were stained with CM and exposed to 2% O2 for 24 h in glucose- and serum-free medium, washed and refreshed in normal complete medium with a constant number of healthy MT-stained pericytes (OGD/R), in the presence or absence of CytoD (200 nM), as described in Fig. 4A. Twenty-four hours later, the co-culture was analyzed for mitochondria trafficking and astrocyte apoptosis by time-lapse and confocal fluorescence microscopy. A Time-lapse fluorescence microscopy analysis of mitochondria trafficking from healthy pericytes to OGD-astrocytes regenerated for 24 h (OGD/R) in the absence or presence of CytoD. TNT and actively transported mitochondria from healthy pericytes to OGD-astrocytes are indicated by yellow and white arrows, respectively (A1 and Suppl. Movie 10; A2 and Suppl. Movie 11 for OGD-astrocytes with overt morphological alterations). CytoD abolished TNT formation and strongly reduced the intercellular mitochondria trafficking to OGD-astrocytes (A3; Suppl. Movie 12) also when astrocytes are morphologically altered (A4; Suppl. Movie 13). Representative images from N = 4 independent experiments in which N ≥ 10 areas per experiment were analyzed. B Apoptosis of OGD-astrocyte regenerated for 24 h (OGD/R) with healthy pericytes in the presence or absence of CytoD. Astrocytes (orange) that were positive for CellEvent Caspase 3/7 (green nuclei, white arrows) were counted under the experimental conditions reported in the images. C Analysis of OGD-astrocyte apoptosis. The percentage of Caspase 3/7-positive astrocytes on the total astrocyte population is shown. Pericytes rescued astrocytes from OGD-induced apoptosis only in the presence of an intact F-actin cytoskeleton. N = 3 independent experiments. ****p < 0.0001; Student’s t-test (normoxia); two-way ANOVA/Tukey’s tests (OGD/R).
Fig. 6
Fig. 6. Staurosporin treatment of astrocytes triggers TNT formation with healthy pericytes in a cytoskeleton-dependent manner.
A CM-labeled astrocytes (blue) were treated with STS (1 μM for 3 h), washed, and co-cultured with pericyte that had been previously stained with MT (red) (STS/R) with or without CytoD (STS/R + CytoD). After 24 h, cells were fixed, stained for the F-actin-network with phallodin (green), and analyzed by confocal microscopy for the TNT number and mitochondria transfer. B STS-astrocytes trigger TNT heterotypic-TNT formation with healthy pericytes. Astrocyte-to-pericyte TNT (yellow arrows) are indicated in control and in STS/R. Note that STS/R trigger TNT while CytoD completely prevents TNT formation. Homotypic (A-A and P-P) and heterotypic (A-P) TNT were counted between control or STS-astrocytes and pericytes (STS/R) in the absence or in the presence of CytoD (STS/R + CytoD). C Quantitative evaluation of the astrocyte-astrocyte (A-A), pericyte-pericyte (P-P) and heterotypic astrocyte-pericyte (A-P) number of TNT after 24 h of co-culture. STS-astrocytes strongly upregulate heterotypic-TNT formation, an effect that is strongly inhibited by CytoD treatment. D 3D confocal reconstruction at higher magnification of the experiments shown in D. XY plane and relative Z-projections show a representative [STS/R astrocytes + pericytes] co-culture incubated in the absence (up) or presence (bottom) of CytoD. TNT between STS/R astrocytes and pericytes are indicated by the yellow arrows; pericyte-derived mitochondria are indicated by the white arrows. Note that CytoD treatment prevents the formation of TNT and strongly reduces mitochondria transfer from pericytes to astrocytes. Images are representative of N = 4 independent experiments. E Quantification of pericyte-to-astrocytes mitochondria transfer. N = 3; **p < 0.005, ***p < 0.001, ****p < 0.0001, two-way ANOVA/Tukey’s tests.
Fig. 7
Fig. 7. Pericytes rescue STS-induced astrocyte apoptosis by TNT-mediated transfer of mitochondria.
CM-stained astrocytes were incubated with STS for 3 h. After the treatment, cells were washed and co-cultured for 24 h with pericytes (+Peri) as described in Fig. 6A, in the presence or absence of the tubulin-depolymerizing drug vincristine (VCR; 10 nM). The co-culture was analyzed for mitochondria trafficking and apoptosis by time-lapse and confocal fluorescence microscopy. A Time-lapse analysis of mitochondrial trafficking from healthy pericytes to STS-treated astrocytes. White arrows indicate mitochondria actively transported from healthy pericytes to STS-astrocytes through TNT (yellow arrow) (panel A1, insets I-III; Suppl. Movies 14–15). VCR treatment prevents TNT formation and strongly reduces intercellular mitochondrial trafficking (panel A2, insets I-III; Suppl. Movie 16). Representative images from N = 17 independent experiments with N ≥ 10 areas per experiment analyzed. B Apoptosis of STS-treated astrocytes regenerated for 24 h with healthy pericytes in the presence or absence of VCR. Astrocytes (blue) that were positive for CellEvent Caspase 3/7 (green nuclei, white arrows) were counted under the experimental conditions reported in the images. C Analysis of STS-astrocyte apoptosis. The percentage of Caspase 3/7-positive on the total astrocyte population is shown. Pericytes strongly rescue astrocytes from STS-induced apoptosis, an effect that is significantly decrease by VCR. D High magnification images of the analysis reported in panel C. Note the presence of pericyte-derived mitochodria (white arrow) inside STS-treated caspase3/7-negative astrocytes. E Confocal analysis and 3D reconstruction of rescued astrocytes after SDS treatment. Note the presence of pericyte-derived mitochodria (white arrow) inside post-STS astrocytes. N = 4 independent experiments. ****p < 0.0001; Student’s t-test (control); two-way ANOVA/Tukey’s tests (STS/R).

References

    1. Soenen SJ, Manshian B, Montenegro JM, Amin F, Meermann B, Thiron T, et al. Cytotoxic effects of gold nanoparticles: a multiparametric study. ACS Nano. 2012;6:5767–83. doi: 10.1021/nn301714n. - DOI - PubMed
    1. Hill SA, Blaeser AS, Coley AA, Xie Y, Shepard KA, Harwell CC, et al. Sonic hedgehog signaling in astrocytes mediates cell type-specific synaptic organization. Elife. 2019;8:e45545. doi: 10.7554/eLife.45545. - DOI - PMC - PubMed
    1. Liu L-R, Liu J-C, Bao J-S, Bai Q-Q, Wang G-Q. Interaction of microglia and astrocytes in the neurovascular unit. Front Immunol. 2020;11:1024.. doi: 10.3389/fimmu.2020.01024. - DOI - PMC - PubMed
    1. Ronaldson PT, Davis TP. Regulation of blood–brain barrier integrity by microglia in health and disease: a therapeutic opportunity. J Cereb Blood Flow Metab. 2020;40:S6–24. doi: 10.1177/0271678X20951995. - DOI - PMC - PubMed
    1. Shimizu F, Sano Y, Tominaga O, Maeda T, Abe M-A, Kanda T. Advanced glycation end-products disrupt the blood–brain barrier by stimulating the release of transforming growth factor–β by pericytes and vascular endothelial growth factor and matrix metalloproteinase–2 by endothelial cells in vitro. Neurobiol Aging. 2013;34:1902–12. doi: 10.1016/j.neurobiolaging.2013.01.012. - DOI - PubMed

Publication types

Substances