. 2022 Jul 5;5(1):661.
doi: 10.1038/s42003-022-03624-1.

BayesR3 enables fast MCMC blocked processing for largescale multi-trait genomic prediction and QTN mapping analysis

Affiliations

BayesR3 enables fast MCMC blocked processing for largescale multi-trait genomic prediction and QTN mapping analysis

Edmond J Breen et al. Commun Biol. .

Abstract

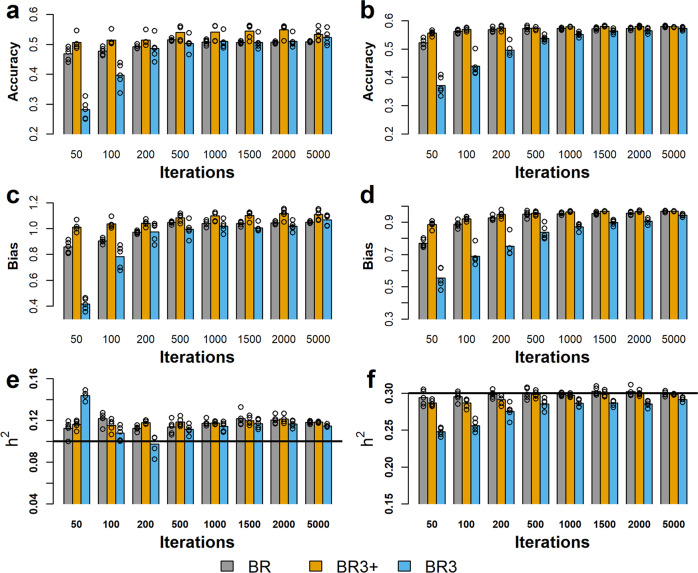
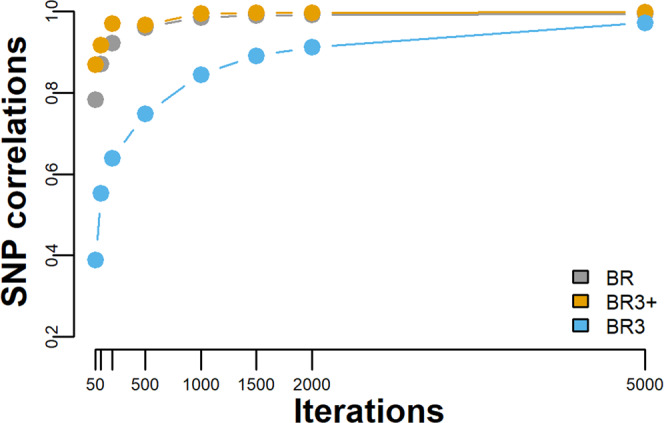
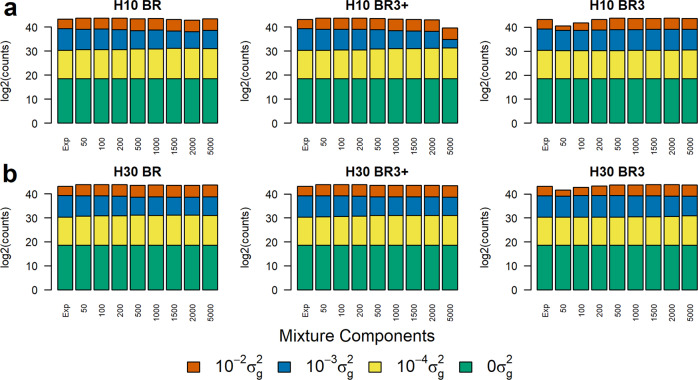
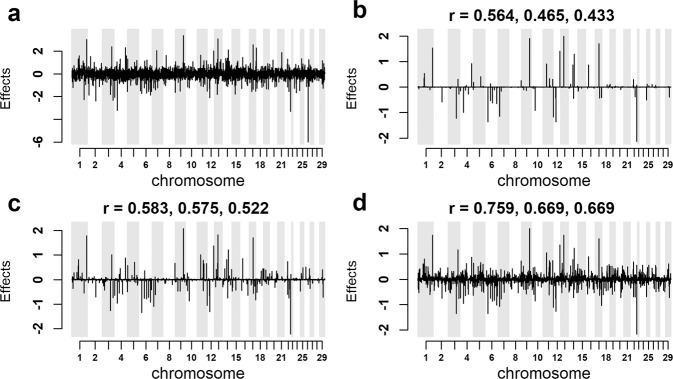
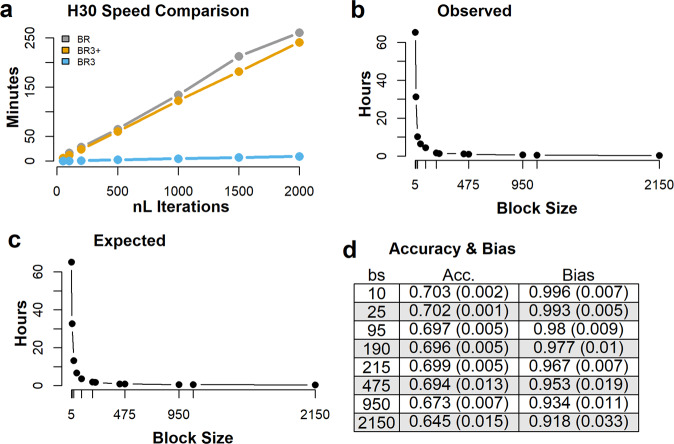
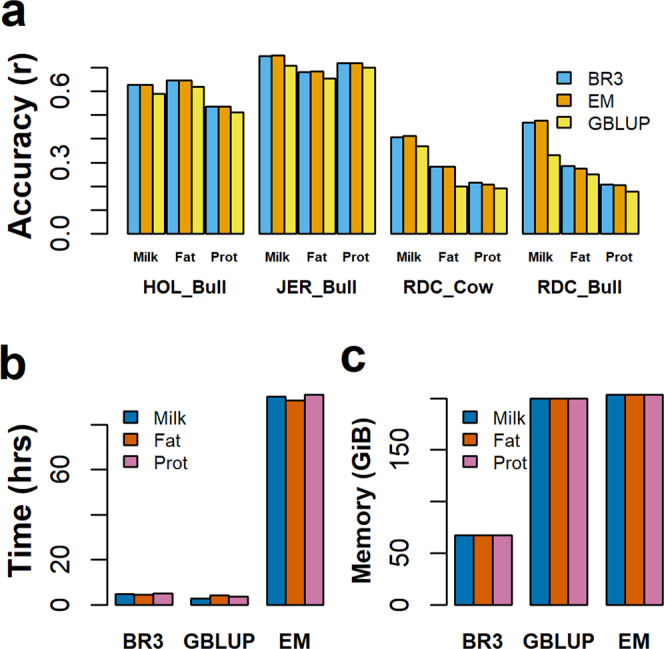
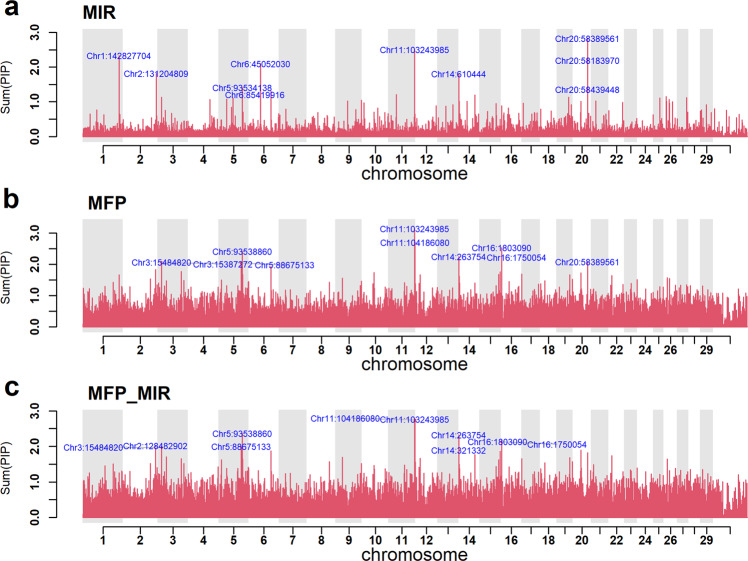
Bayesian methods, such as BayesR, for predicting the genetic value or risk of individuals from their genotypes, such as Single Nucleotide Polymorphisms (SNP), are often implemented using a Markov Chain Monte Carlo (MCMC) process. However, the generation of Markov chains is computationally slow. We introduce a form of blocked Gibbs sampling for estimating SNP effects from Markov chains that greatly reduces computational time by sampling each SNP effect iteratively n-times from conditional block posteriors. Subsequent iteration over all blocks m-times produces chains of length m × n. We use this strategy to solve large-scale genomic prediction and fine-mapping problems using the Bayesian MCMC mixed-effects genetic model, BayesR3. We validate the method using simulated data, followed by analysis of empirical dairy cattle data using high dimension milk mid infra-red spectra data as an example of "omics" data and show its use to increase the precision of mapping variants affecting milk, fat, and protein yields relative to a univariate analysis of milk, fat, and protein.


Conflict of interest statement

The authors declare no competing interests.

Figures

Fig. 1
Fig. 1. Correlation between true breeding value (TBV) and estimated breeding value (EBV) with 10% (H10) and 30% (H30) heritabilities.
X-axis gives the number of iterations performed by BR (grey bars), BR3 (sky blue bars), and BR3+ (orange bars). The bar heights in each plot represents the mean summary statistics obtained from 5 chains and the individual data points from each chain are overlaying on each respective bar. The prediction accuracy for the 2 heritabilities are given in panels a for 10% heritability data and in b for the 30% heritability data. The prediction biases are given in panels c 10% and d 30%. Panels e, f give the estimated 10% and 30% heritability with respect to iteration. The horizontal black line on each of these plots shows the expected heritability for each data set.
Fig. 2
Fig. 2. Across chain convergence analysis.
Pearson’s correlations for iteration {50,100,200,500,1000,2000 and 5000} for the analysis and data presented in Fig. 1b. The number of chains was 5, therefore each plotted point represents the mean of 10 correlations. Results obtained from BR are given in grey, BR3 results are in given in sky blue while the BR3+ results are shown in orange.
Fig. 3
Fig. 3. Stacked bar plots for the mixture components inferred with respect to BayesR configuration (BR, BR3 and BR3+) and iterations (50 to 2000).
Y-axis is the log2 of the number of SNPs. Component variance 102σg2 is given in vermillion, component 103σg2 is given in blue, 104σg2 is given in yellow and 0σg2 is given in a bluish green colour. The expected (Exp) number of SNPs for each component is given in the first bar in each plot where the expected counts are (396000, 3485, 500, 15). Panel a gives results observed for the 10% heritability data set H10, while panel b is the equivalent data for the 30% heritability, H30, data set.
Fig. 4
Fig. 4. The true SNP effects for the 4000 simulated causal variants and their estimated effects using the H30 training data set, embedded within three different genotype densities.
All results are from BR3 using five chains, each of length 2,000 and with a block size of 25. The r values above panels bd, are all Pearson’s correlation values. The first value above each of these figures is the correlation between estimated and true breeding values, the 2nd value is the correlation between the true 4000 causal SNP effect values to their corresponding estimates, while the 3rd value is the estimated SNP effects correlation across all SNPs within each of the analysis to their simulated true values: a the simulated true effects for the 4,000 causal variants. b the effects of the 4000 causal variants estimated in the training set with 400,000 marker genotypes. c the effects recovered from the training set with 40,000 SNP genotypes. d the effects recovered when only the true simulated causal variants were used as the genotype set.
Fig. 5
Fig. 5. Processing speeds for the simulated data sets.
a Y-axis is time in minutes to process 20,000 phenotypic records of 400,000 SNPs for the 3 Bayes R configurations as specified in Fig. 1. b Computing time in hours of BR3 with respect to changing block size for Markov chain lengths of 10,000 and for block sizes: n5, 10, 25, 50, 95, 190, 215, 430, 475, 950, 1075, 2150, for the simulated data set using 41,925 phenotype records and 400,000 SNPs composed of Holsteins and Jersey cows only, c ratio of nR+nn, for the same block sizes, n, and where nR is the number of records. Note plot in panel c is scaled to have the same range (min and max) given in plot b. d Aussie Reds genomic prediction mean accuracies (Acc.) and biases (standard deviations) from 5 MCMC chains of length 10,000 each, for selected block sizes associated to the timings given in b.
Fig. 6
Fig. 6. Comparison of the accuracy of genomic prediction and computational efficiency between BayesR3 to EM-BayesR (EM) and GBLUP. Each comparison is for a single trait analysis for milk, fat, and protein yield, using a reference set of 25,000 Holstein and Jersey cattle and where accuracy was tested in 3 validation sets: 398 Jersey bulls, 702 Holstein bulls, and 3082 RDC cows and 212 RDC Bulls.
a Accuracy of genomic prediction as a function of trait and breed. Results for BR3 are the sky-blue bars, EM-BayesR orange bars, and GBLUP yellow bars. Also note, error bars are not included as GBLUP only provides single-point values. Computation requirements in terms of b runtime and c memory requirements. Note with respect b, c Results for milk, fat and protein are given by blue, vermillion, and reddish-purple bars respectively.
Fig. 7
Fig. 7. MIR PC trait summary results.
a The phenotype variance σp2 for each MIR PC trait plotted against PC number. b Estimated heritability for each PC trait. c Number of SNPs per mixture distribution for each PC trait. Note, count k4 is given in vermillion, count k3 is given in blue, k2 is given in yellow and count k1 is given in a bluish green. d Raw counts for the number SNPs per distribution for each trait. Note the sum of counts for each PC trait is 3995, which is the number SNPs estimated to be associated to the traits.
Fig. 8
Fig. 8. Manhattan plots for MFP, MIR, and MFP_MIR multi-trait analysis. Y-axis is the sum of the posterior probabilities that SNPs within and centred on each non-overlapping 50 kb segment of the genome is included in the model.
a Result from the 17 PCA MIR multi-trait analysis. b Plot is multi-trait milk, fat, and protein yields. c Multi-trait milk, fat, and protein yield analysis, using BayesR3C, where class 1 was formed from the top 1000 SNPs identified from the MIR analysis. Note each plot has the top 10 SNP effects labelled.

References

    1. Timpson NJ, Greenwood CMT, Soranzo N, Lawson DJ, Richards JB. Genetic architecture: the shape of the genetic contribution to human traits and disease. Nat. Rev. Genetics. 2018;19:110–124. - PubMed
    1. Maier RM, et al. Improving genetic prediction by leveraging genetic correlations among human diseases and traits. Nat. Commun. 2018;9:1–17. - PMC - PubMed
    1. Visscher PM, Goddard ME. From R.A. Fisher’s 1918 paper to GWAS a century later. Genetics. 2019;211:1125–1130. - PMC - PubMed
    1. Visscher PM, Yang J, Goddard ME. A commentary on ‘common SNPs explain a large proportion of the heritability for human height’ by Yang et al. (2010) Twin Res Hum. Genetics. 2010;13:517–524. - PubMed
    1. Maier R, et al. Joint analysis of psychiatric disorders increases accuracy of risk prediction for schizophrenia, bipolar disorder, and major depressive disorder. Am. J. Hum. Genet. 2015;96:283–294. - PMC - PubMed

Publication types