. 2022 Jul 5;12(1):11344.
doi: 10.1038/s41598-022-15520-z.

Cytarabine-induced differentiation of AML cells depends on Chk1 activation and shares the mechanism with inhibitors of DHODH and pyrimidine synthesis

Affiliations

Cytarabine-induced differentiation of AML cells depends on Chk1 activation and shares the mechanism with inhibitors of DHODH and pyrimidine synthesis

Barbara Tomic et al. Sci Rep. .

Abstract

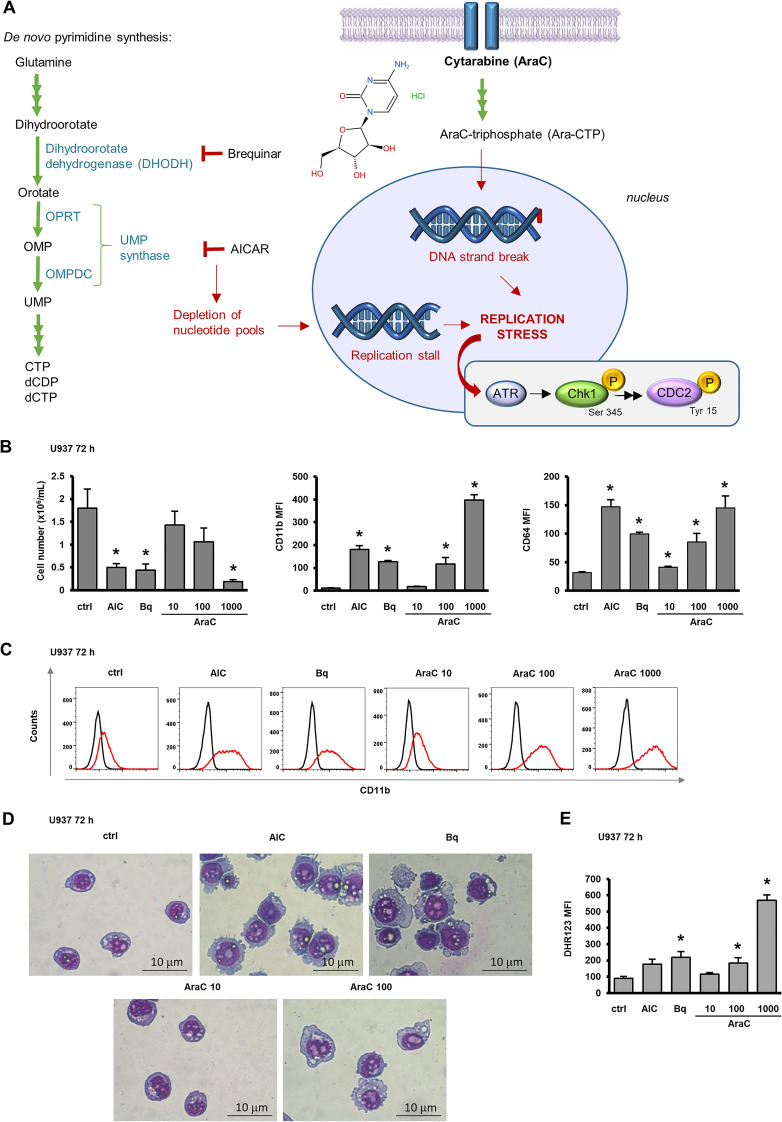
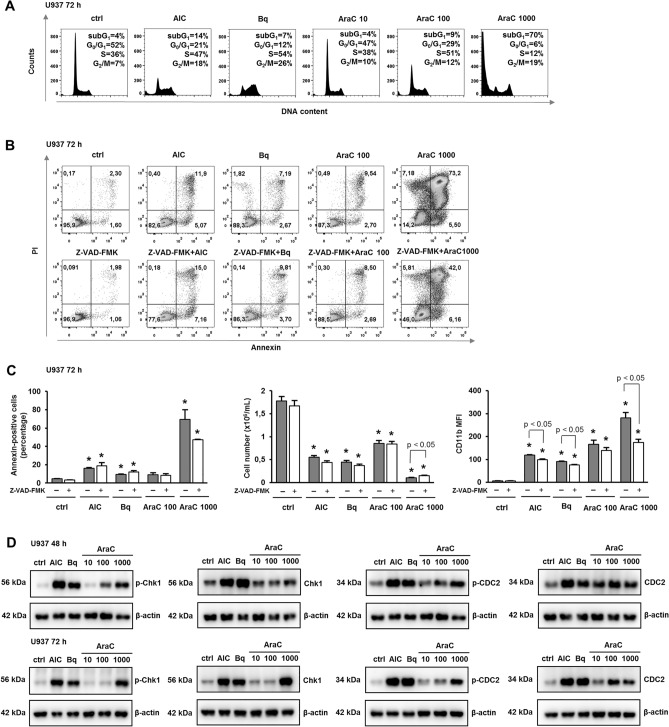
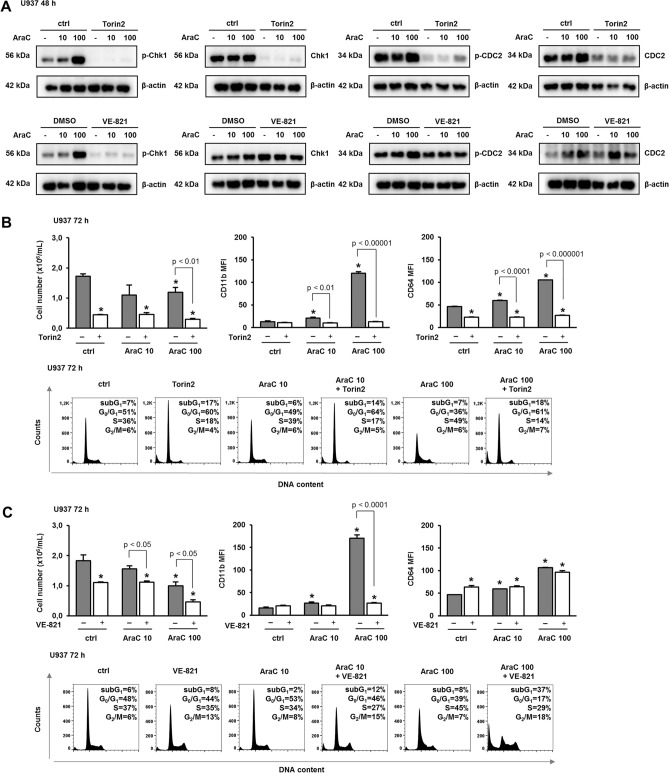
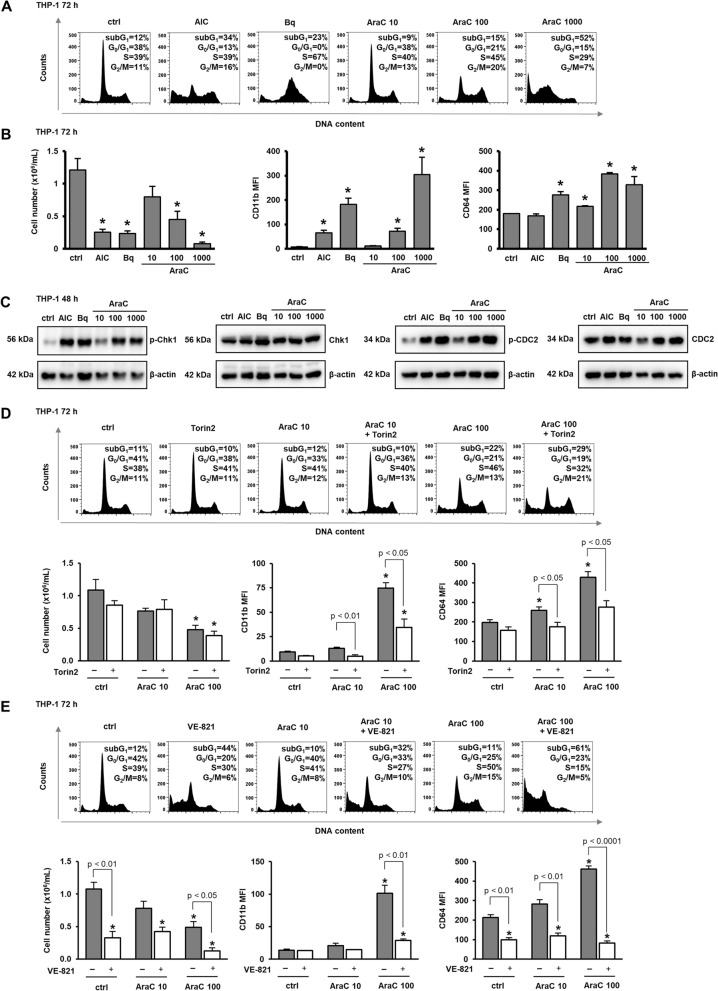
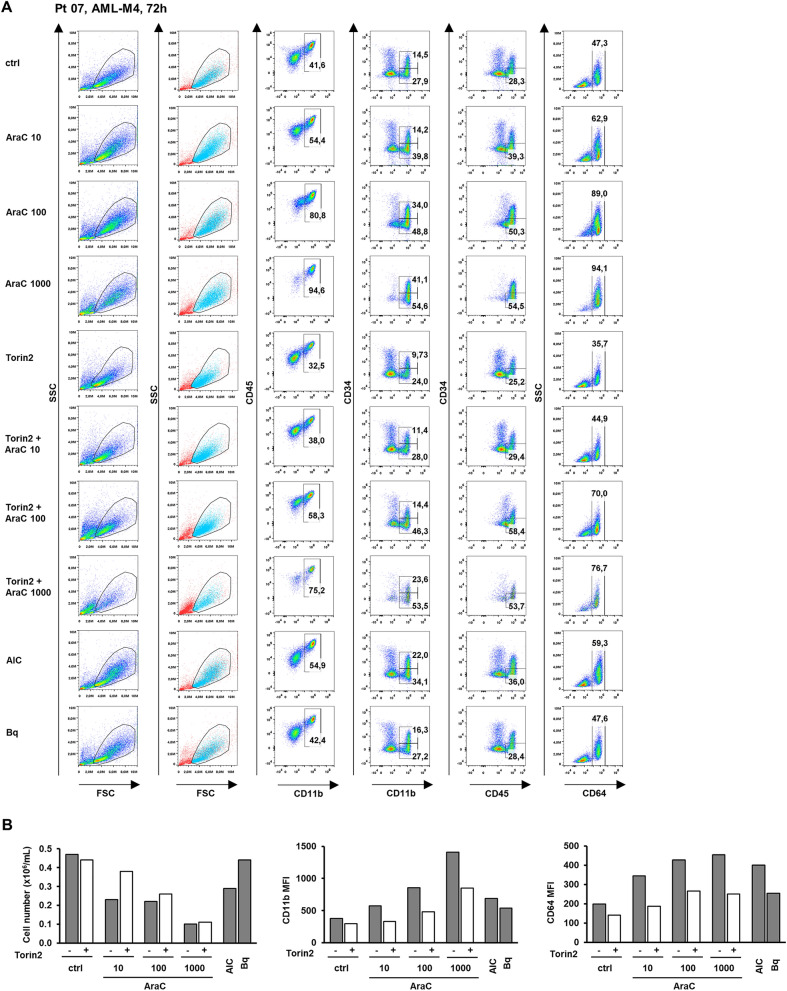
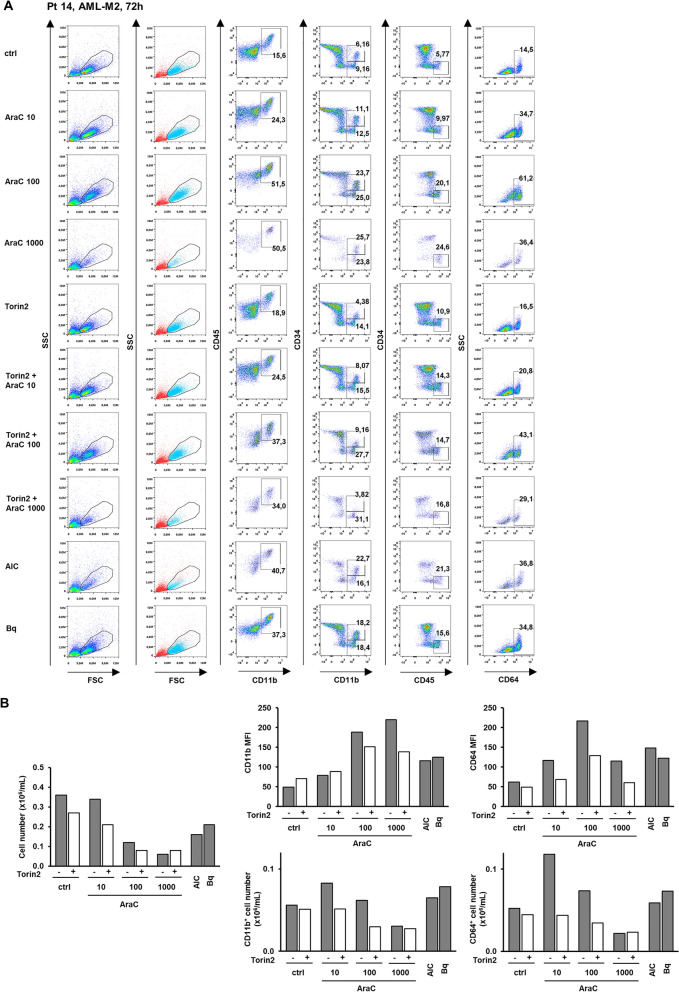
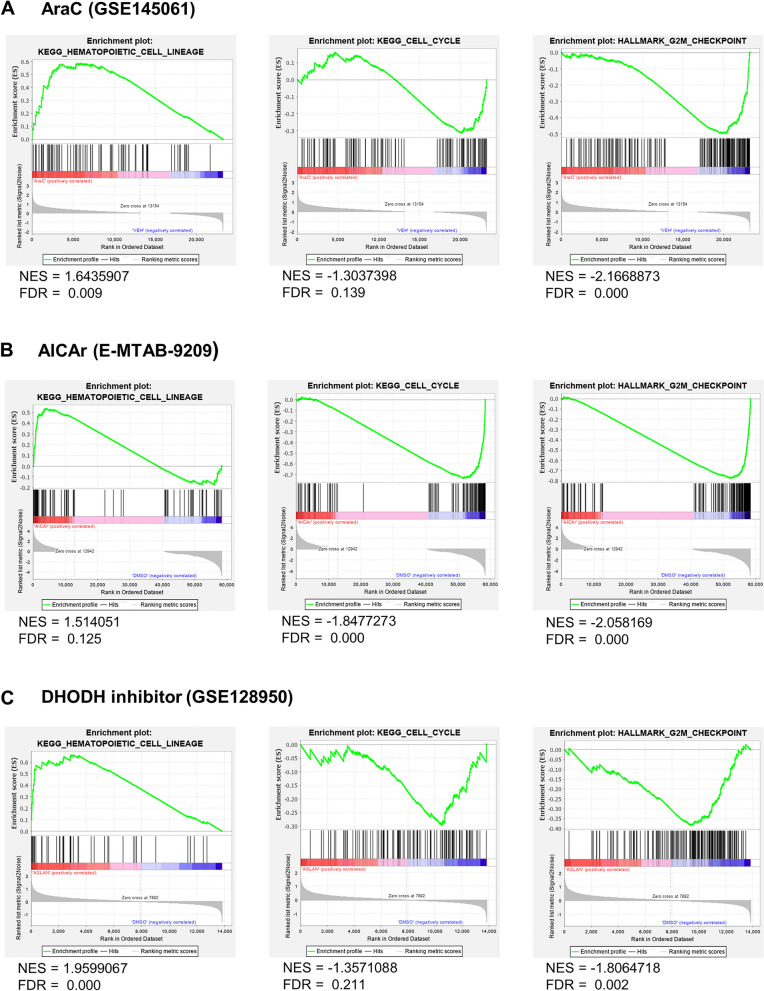
Acute myeloid leukemia (AML) is characterized by arrested differentiation making differentiation therapy a promising treatment strategy. Recent success of inhibitors of mutated isocitrate dehydrogenase (IDH) invigorated interest in differentiation therapy of AML so that several new drugs have been proposed, including inhibitors of dihydroorotate dehydrogenase (DHODH), an enzyme in pyrimidine synthesis. Cytarabine, a backbone of standard AML therapy, is known to induce differentiation at low doses, but the mechanism is not completely elucidated. We have previously reported that 5-aminoimidazole-4-carboxamide ribonucleoside (AICAr) and brequinar, a DHODH inhibitor, induced differentiation of myeloid leukemia by activating the ataxia telangiectasia and Rad3-related (ATR)/checkpoint kinase 1 (Chk1) via pyrimidine depletion. In this study, using immunoblotting, flow cytometry analyses, pharmacologic inhibitors and genetic inactivation of Chk1 in myeloid leukemia cell lines, we show that low dose cytarabine induces differentiation by activating Chk1. In addition, cytarabine induces differentiation ex vivo in a subset of primary AML samples that are sensitive to AICAr and DHODH inhibitor. The results of our study suggest that leukemic cell differentiation stimulated by low doses of cytarabine depends on the activation of Chk1 and thus shares the same pathway as pyrimidine synthesis inhibitors.


Conflict of interest statement

The authors declare no competing interests.

Figures

Figure 1
Figure 1
Cytarabine dose-dependently decreases cell number and induces differentiation. (A) DNA damage pathway activation by pyrimidine synthesis inhibitors and cytarabine. (B) U937 cells were incubated with AICAr (AIC) (0.2 mM), brequinar (Bq) (0.5 µM) and AraC (10, 100, 1000 nM). The number of viable cells and the expression of differentiation markers were determined after 72 h. Mean fluorescence intensity (MFI) of CD11b and CD64 was calculated as described under “Methods” section. Results are mean ± S.E. (error bars) of at least three independent experiments. *, p < 0.05 (Student's t-test) compared with control (ctrl). (C) Representative histograms (out of three independent flow cytometric analyses shown in B) with black line representing isotypic control and red line representing the expression of CD11b. (D) Morphological analysis of U937 cells treated with AICAr (AIC) (0.2 mM), brequinar (Bq) (0.5 µM) and AraC (10 and 100 nM). May-Grünwald-Giemsa stained cytospin preparations (100 × magnification). (E) Respiratory burst in U937 cells treated with AICAr (AIC) (0.2 mM), brequinar (Bq) (0.5 µM) and AraC (10, 100, 1000 nM) for 72 h. Results are mean ± S.E. (error bars) of at least three independent experiments. *, p < 0.05 (Student's t-test) compared with control (ctrl).
Figure 2
Figure 2
Cytarabine induces cell cycle arrest and activates Chk1. U937 cells were incubated with AICAr (AIC) (0.2 mM), brequinar (Bq) (0.5 µM) and AraC (10, 100, 1000 nM). (A) Representative histograms of propidium-labelled cells from three independent experiments analyzed by flow cytometry. (B, C) Pan-caspase inhibitor Z-VAD-FMK (10 μM) was added 30 min before the addition of agents. (B) The representative dot plots of cells stained with annexin V-FITC/PI and analyzed by flow cytometry. (C) The percentage of annexin V-FITC-positive cells, the number of viable cells and the expression of differentiation markers were determined after 72 h. Results are mean ± S.E. (error bars) of at least three independent experiments. *, p < 0.05 (Student's t-test) compared with control (ctrl). (D) U937 cells were incubated with AICAr (AIC) (0.2 mM), brequinar (Bq) (0.5 µM) and AraC (10, 100, 1000 nM) for 48 h (upper panels) or 72 h (lower panels). Total cell lysates were isolated after 48 and 72 h and analyzed by Western blotting for the level of Ser-345-phosphorylated Chk1, total Chk1, Tyr-15-phosphorylated CDC2 and total CDC2. Representative immunoblots from three independent experiments are shown.
Figure 3
Figure 3
Pharmacological inhibition of ATR/Chk1 pathway prevents differentiation and cell cycle arrest. U937 cells were grown in the presence of increasing concentrations of AraC (10, 100 nM). Torin2 (100 nM), VE-821 (10 µM) or vehicle (DMSO) were added 30 min before the addition of AraC. (A) Total cell lysates were isolated after 48 h and analyzed by Western blotting for the level of Ser-345-phosphorylated Chk1, total Chk1, Tyr-15-phosphorylated CDC2 and total CDC2. Representative immunoblots from three independent experiments are shown. (BC) The number of viable cells, the expression of differentiation markers and the cell cycle progression were determined for Torin2 (B) and VE-821 (C) pre-treated cells as described under “Methods” section. Results are mean ± S.E. (error bars) of at least three independent experiments. *, p < 0.05 (Student's t-test) compared with control (ctrl).
Figure 4
Figure 4
Down-regulation of Chk1 reduces the effects of cytarabine on the expression of differentiation markers and S-phase arrest. U937 cells were transfected with siRNA against CHK1, and respective nontargeting siRNA was used as a negative control. AICAr (AIC) (0.2 mM), brequinar (Bq) (0.5 µM) and AraC (100 nM) were added 24 h after transfection. (A) Total cell lysates were isolated 3 or 48 h after the addition of agents and analyzed by Western blotting for the level of Chk1. Western blot analyses are shown for each of the three independent experiments. (B) The number of viable cells, the expression of differentiation markers and the cell cycle progression were analyzed by flow cytometry 72 h after addition of agents. (C) Representative histograms of propidium-labeled cells analyzed by flow cytometry. (D) Percentage of cells in G0/G1, S, and G2/M-phases of the cell cycle. Results are mean ± S.E. (error bars) of at least three independent experiments. *, p < 0.05 (Student's t-test) compared with control (ctrl).
Figure 5
Figure 5
Cytarabine exerts similar effects on proliferation and differentiation in another monocytic cell line. THP-1 cells were incubated with AICAr (AIC) (0.2 mM), brequinar (Bq) (0.5 µM) and AraC (10, 100, 1000 nM) for 72 h. (A) Representative histograms of propidium-labelled cells. (B) The number of viable cells and the expression of differentiation markers. (C) Total cell lysates were isolated after 48 h and analyzed by Western blotting for the level of Ser-345-phosphorylated, total Chk1, Tyr-15-phosphorylated and total CDC2. (D) Torin2 (10 nM), (E) VE-821 (2 µM) or vehicle (DMSO) were added 30 min before the addition of cytarabine. Histograms and immunoblots are representatives from three independent experiments. The number of viable cells and the expression of differentiation markers were determined as described under “Methods” section. Results are mean ± S.E. (error bars) of at least three independent experiments. *, p < 0.05 (Student's t-test) compared with control (ctrl).
Figure 6
Figure 6
Cytarabine dose-dependently increases expression of differentiation markers in a primary sample from AML-M4 patient that was responsive to pyrimidine synthesis inhibition. Non-adherent mononuclear cells from bone marrow sample (Pt 07, normal karyotype, FLT3-ITD, NPM/mut) were plated at concentration 0.4 × 106/mL in medium supplemented with 50 ng/mL IL-3, IL-6, SCF and FLT3L and incubated with AraC (10, 100, 1000 nM) with or without Torin2 (10 nM) for 72 h. AICAr (AIC) (0.2 mM) and brequinar (Bq) (0.5 µM) were used as a positive control. Data shown are from a single experiment. (A) Flow cytometric analysis of CD11b+CD45+, CD11b+CD34+ and CD11b+CD34-, CD45highCD34, and CD64+ populations. Percentage of cells in population of interest is indicated in respective gates. Cells within the gate that stained negative for 7-AAD are shown in blue. (B) The number of viable cells was determined by trypan blue exclusion. Mean fluorescence intensity (MFI) of CD11b and CD64 was calculated as described under “Methods” section.
Figure 7
Figure 7
Cytarabine dose-dependently increases expression of differentiation markers in a primary sample from AML-M2 patient that was responsive to pyrimidine synthesis inhibition. Non-adherent mononuclear cells from bone marrow sample (Pt 14, normal karyotype, FLT3wt, NPMwt) were plated at concentration 0.4 × 106/mL in medium supplemented with 50 ng/mL IL-3, IL-6, SCF and FLT3L and incubated with AraC (10, 100, 1000 nM) with or without Torin2 (10 nM) for 72 h. AICAr (AIC) (0.2 mM) and brequinar (Bq) (0.5 µM) were used as positive controls. (A) Flow cytometric analysis of CD11b+CD45+, CD11b+CD34+ and CD11b+CD34-, CD45highCD34-, and CD64+ populations. Percentage of cells in population of interest is indicated in respective gates. Cells within the gate that stained negative for 7-AAD are shown in blue. (B) The number of viable cells was determined by trypan blue exclusion. Mean fluorescence intensity (MFI) of CD11b and CD64 was calculated as described under “Methods” section. Absolute number of CD11b+ and CD64+ cells was calculated from the number of viable cells and the percentage of CD11b+CD45+ and CD64+ cells, respectively.
Figure 8
Figure 8
Cytarabine and pyrimidine synthesis inhibitors have similar effects on transcriptional signatures. (A) Gene set enrichment analysis of RNASeq read counts from two patient samples treated with 1000 nM AraC in vitro for 24 h. (B) Gene set enrichment analysis of RNASeq read counts from AML-M2 patient that was responsive to pyrimidine synthesis inhibition (Pt 14, normal karyotype, FLT3wt, NPMwt) treated with 0.4 mM AICAr for 24 h. (C) Gene set enrichment analysis of RNASeq read counts from MOLM-14 and KG-1 cells treated with a novel DHODH inhibitor ASLAN003 (0.5 and 1 µM) for 24 h (GSE128950). Enrichment plots are shown for KEGG pathways Hematopoietic Cell Lineage and Cell Cycle, and MSigDB G2/M Checkpoint pathway.

References

    1. Short NJ, et al. Advances in the treatment of acute myeloid leukemia: New drugs and new challenges. Cancer Discov. 2020;10:506–525. doi: 10.1158/2159-8290.CD-19-1011. - DOI - PubMed
    1. Madan V, Koeffler HP. Differentiation therapy of myeloid leukemia: Four decades of development. Haematologica. 2020;106:26–38. - PMC - PubMed
    1. Sanz MA, et al. Management of acute promyelocytic leukemia: Updated recommendations from an expert panel of the European LeukemiaNet. Blood. 2019;133:1630–1643. doi: 10.1182/blood-2019-01-894980. - DOI - PMC - PubMed
    1. Stein EM, et al. Enasidenib in mutant IDH2 relapsed or refractory acute myeloid leukemia. Blood. 2017;130:722–731. doi: 10.1182/blood-2017-04-779405. - DOI - PMC - PubMed
    1. Amatangelo MD, et al. Enasidenib induces acute myeloid leukemia cell differentiation to promote clinical response. Blood. 2017;130:732–741. doi: 10.1182/blood-2017-04-779447. - DOI - PMC - PubMed

Publication types

MeSH terms