. 2023 Jul-Sep;39(3):1366-1383.
doi: 10.1016/j.ijforecast.2022.06.005. Epub 2022 Jul 1.

Comparing trained and untrained probabilistic ensemble forecasts of COVID-19 cases and deaths in the United States

Affiliations

Comparing trained and untrained probabilistic ensemble forecasts of COVID-19 cases and deaths in the United States

Evan L Ray et al. Int J Forecast. 2023 Jul-Sep.

Abstract

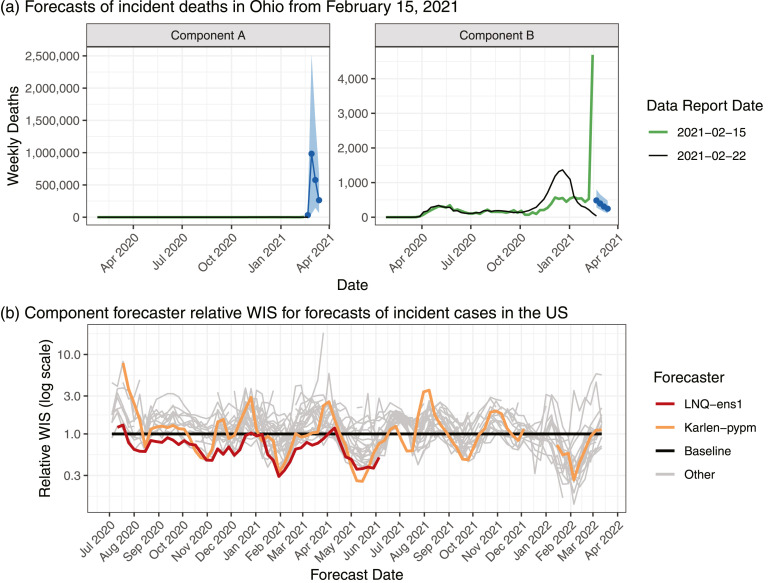
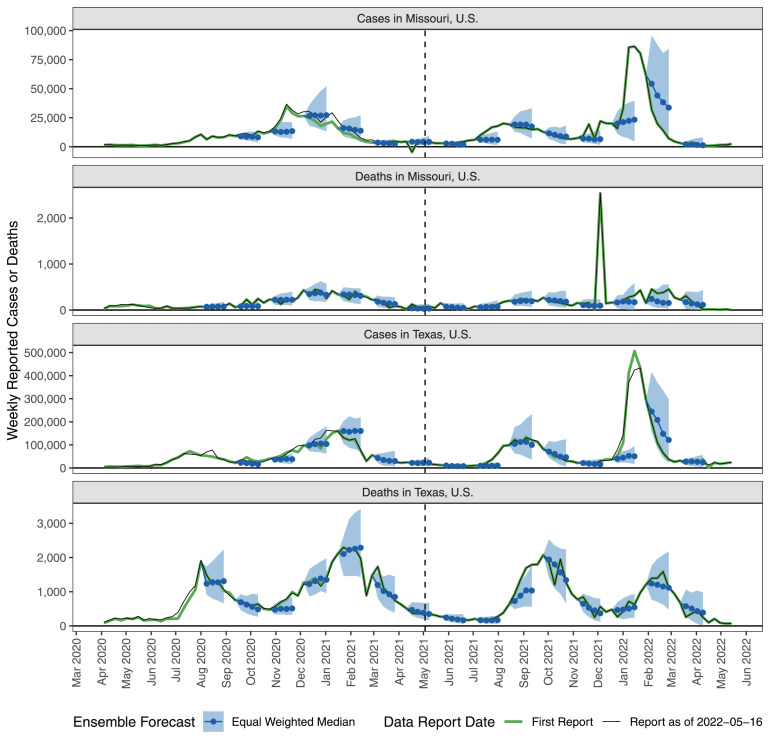
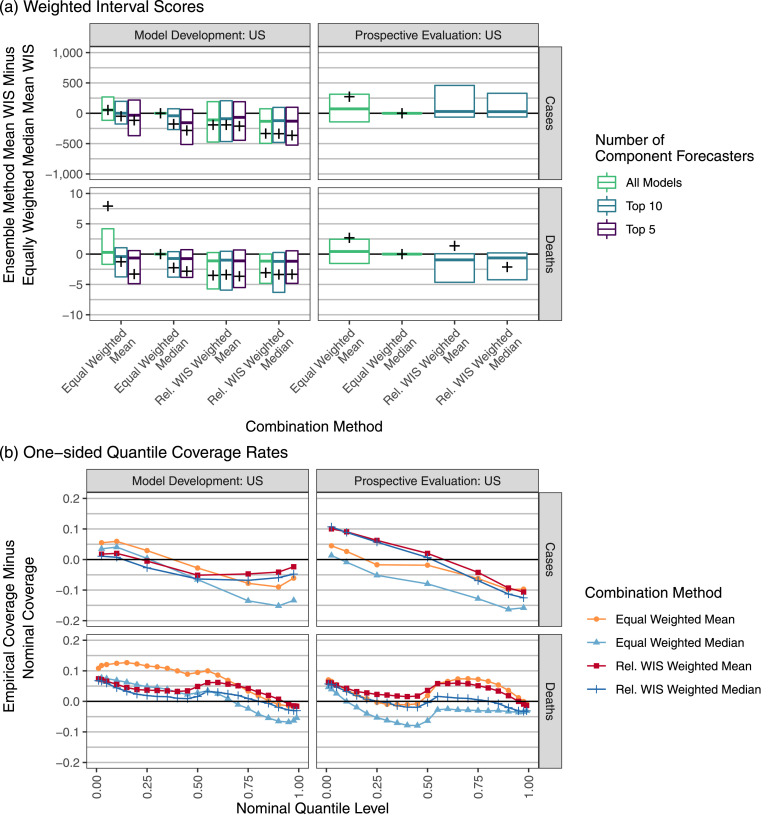
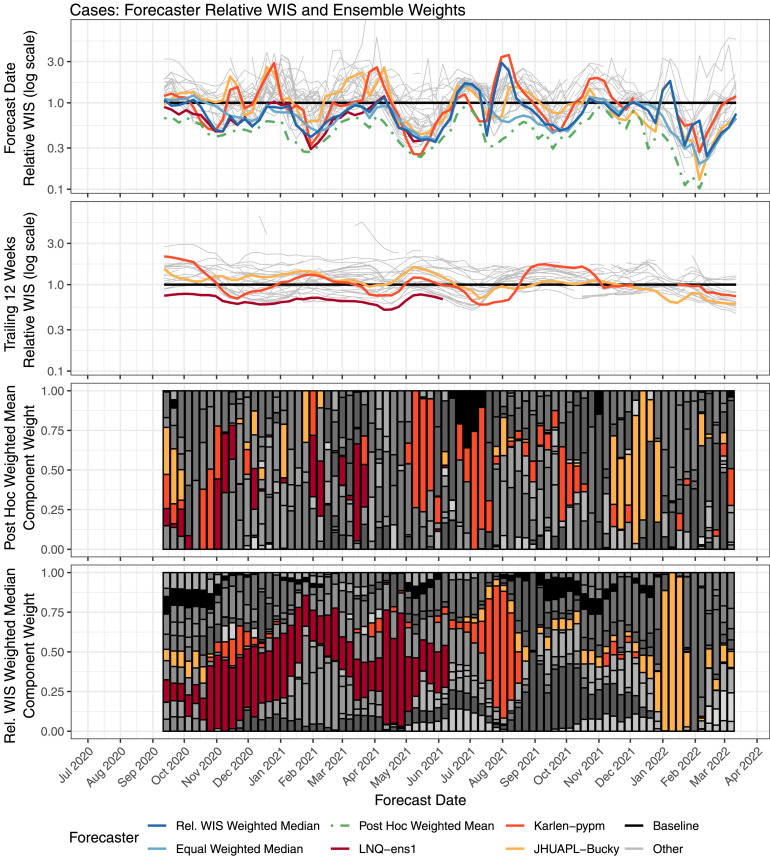
The U.S. COVID-19 Forecast Hub aggregates forecasts of the short-term burden of COVID-19 in the United States from many contributing teams. We study methods for building an ensemble that combines forecasts from these teams. These experiments have informed the ensemble methods used by the Hub. To be most useful to policymakers, ensemble forecasts must have stable performance in the presence of two key characteristics of the component forecasts: (1) occasional misalignment with the reported data, and (2) instability in the relative performance of component forecasters over time. Our results indicate that in the presence of these challenges, an untrained and robust approach to ensembling using an equally weighted median of all component forecasts is a good choice to support public health decision-makers. In settings where some contributing forecasters have a stable record of good performance, trained ensembles that give those forecasters higher weight can also be helpful.

Keywords: COVID-19; Ensemble; Epidemiology; Health forecasting; Quantile combination.


Conflict of interest statement

The authors declare that they have no known competing financial interests or personal relationships that could have appeared to influence the work reported in this paper.

Figures

Fig. 1
Fig. 1
(a) Predictive medians and 95% prediction intervals for incident deaths in Ohio generated on February 15, 2021 by two example component forecasters. The vertical axis scale is different in each facet, reflecting differences across several orders of magnitude in forecasts from different forecasters; the reference data are the same in each plot. The data that were available as of Monday, February 15, 2021 included a large spike in reported deaths that had been redistributed into the history of the time series in the version of the data available as of Monday, February 22, 2021. In this panel, forecaster names are anonymized to avoid calling undue attention to individual teams; similar behavior has been exhibited by many forecasters. (b) Illustration of the relative weighted interval score (WIS, defined in Section 2.5) of component forecasters over time; lower scores indicate better performance. Each point summarizes the skill of forecasts made on a given date for the one- to four-week-ahead forecasts of incident cases across all state-level locations.
Fig. 2
Fig. 2
Weekly reported cases and deaths and example equally weighted median ensemble forecasts (predictive median and 95% interval) for selected U.S. states. Forecasts were produced each week, but for legibility, only forecasts originating from every sixth week are displayed. Data providers occasionally change initial reports (green lines) leading to revised values (black lines). Vertical dashed lines indicate the start of the prospective ensemble evaluation phase. (For interpretation of the references to colour in this figure legend, the reader is referred to the web version of this article.)
Fig. 3
Fig. 3
Performance measures for ensemble forecasts of weekly cases and deaths at the state level in the U.S. In panel (a) the vertical axis is the difference in mean WIS for the given ensemble method and the equally weighted median ensemble. Boxes show the 25th percentile, 50th percentile, and 75th percentile of these differences, averaging across all locations for each combination of forecast date and horizon. For legibility, outliers are suppressed here; Supplemental Figure 8 shows the full distribution. A cross is displayed at the difference in overall mean scores for the specified combination method and the equally weighted median averaging across all locations, forecast dates, and horizons. Large mean score differences of approximately 2005 and 2387 are suppressed for the Rel. WIS Weighted Mean and the Rel. WIS Weighted Median ensembles, respectively, in the prospective phase forecasts of cases. A negative value indicates that the given method outperformed the equally weighted median. The vertical axis of panel (b) shows the probabilistic calibration of the ensemble forecasts through the one-sided empirical coverage rates of the predictive quantiles. A well-calibrated forecaster has a difference of 0 between the empirical and nominal coverage rates, while a forecaster with conservative (wide) two-sided intervals has negative differences for nominal quantile levels less than 0.5 and positive differences for quantile levels greater than 0.5.
Fig. 4
Fig. 4
Performance of weekly case forecasts from component forecasters and selected ensembles, along with component forecaster weights. Component forecasters that were given high weight at key times are highlighted. The top row shows the relative WIS of forecasts made each week. The second row shows the relative WIS over the 12 weeks before the forecast date, for forecasts of quantities that were observed by the forecast date. These scores, which are used to compute the component weights in the relative WIS weighted median ensemble, are calculated using data available as of the forecast date. The third row shows component forecaster weights for the post hoc weighted mean ensemble, and the bottom row shows the component model weights for the relative WIS weighted median ensemble; each component forecaster is represented with a different color. Over the time frame considered, 31 distinct component forecasters were included in this top-10 ensemble.
Fig. 5
Fig. 5
Performance of weekly death forecasts from component forecasters and selected ensembles, along with component forecaster weights. Component forecasters that were given high weight at key times are highlighted. The top row shows the relative WIS of forecasts made each week. The second row shows the relative WIS over the 12 weeks before the forecast date, for forecasts of quantities that were observed by the forecast date. These scores, which are used to compute the component weights in the relative WIS weighted median ensemble, are calculated using data available as of the forecast date. The third row shows component forecaster weights for the post hoc weighted mean ensemble, and the bottom row shows the component model weights for the relative WIS weighted median ensemble; each component forecaster is represented with a different color. Over the time frame considered, 34 distinct component forecasters were included in this top-10 ensemble.
Fig. 6
Fig. 6
Mean WIS and 95% prediction interval coverage rates for relative WIS weighted median trained ensemble variations with varying sizes of a limit on the weight that could be assigned to any one model. In panel (a), the baseline forecaster is included as a reference. Results are for a post hoc analysis including forecast dates up to January 3, 2022.
Fig. 7
Fig. 7
Performance measures for ensemble forecasts of weekly cases and deaths in Europe. In panel (a) the vertical axis is the difference in mean WIS for the given ensemble method and the equally weighted median ensemble. Boxes show the 25th percentile, 50th percentile, and 75th percentile of these differences, averaging across all locations for each combination of forecast date and horizon. For legibility, outliers are suppressed here; Supplemental Figure 9 shows the full distribution. A cross is displayed at the difference in overall mean scores for the specified combination method and the equally weighted median of all models, averaging across all locations, forecast dates, and horizons. A large mean score difference of approximately 666 is suppressed for the Equal Weighted Mean ensemble forecasts of deaths. A negative value indicates that the given method had better forecast skill than the equally weighted median. Panel (b) shows the probabilistic calibration of the forecasts through the one-sided empirical coverage rates of the predictive quantiles. A well-calibrated forecaster has a difference of 0 between the empirical and nominal coverage rates, while a forecaster with conservative (wide) two-sided intervals has negative differences for nominal quantile levels less than 0.5 and positive differences for quantile levels greater than 0.5.
Fig. 8
Fig. 8
A comparison of the impacts of forecast missingness in the applications to the U.S. (panel (a)) and Europe (panel (b)). Within each panel, the histogram on the left shows the number of locations forecasted by each contributing forecaster in the week of October 11, 2021, colored by whether or not the forecaster was among the top 10 forecasters eligible for inclusion in the relative WIS weighted ensemble selected for prospective evaluation. The plot on the right shows the estimated weights that would be used if all of the top 10 models (each represented by a different color) were available for a given location (on the left side), and the effective weights used in each location after setting the weights for models that did not provide location-specific forecasts to 0 and rescaling the other weights proportionally to sum to 1. (For interpretation of the references to colour in this figure legend, the reader is referred to the web version of this article.)

References

    1. Agosto A., Campmas A., Giudici P., Renda A. Monitoring COVID-19 contagion growth. Statistics in Medicine. 2021;40(18):4150–4160. - PMC - PubMed
    1. Bartolucci F., Pennoni F., Mira A. A multivariate statistical approach to predict COVID-19 count data with epidemiological interpretation and uncertainty quantification. Statistics in Medicine. 2021;40(24):5351–5372. - PMC - PubMed
    1. Bengtsson H. 2020. Matrixstats: Functions that apply to rows and columns of matrices (and to vectors) R package version 0.57.0.
    1. Bracher J., Ray E.L., Gneiting T., Reich N.G. Evaluating epidemic forecasts in an interval format. PLOS Computational Biology. 2021;17(2) - PMC - PubMed
    1. Bracher J., Wolffram D., Deuschel J., Görgen K., Ketterer J.L., Ullrich A., Abbott S., Barbarossa M.V., Bertsimas D., Bhatia S., Bodych M., Bosse N.I., Burgard J.P., Castro L., Fairchild G., Fuhrmann J., Funk S., Gogolewski K., Gu Q.…Schienle M. A pre-registered short-term forecasting study of COVID-19 in Germany and Poland during the second wave. Nature Communications. 2021;12(1):5173. - PMC - PubMed

LinkOut - more resources