. 2022 Jan-Dec:14:17590914221112352.
doi: 10.1177/17590914221112352.

Lanthionine Ketimine Ethyl Ester Accelerates Remyelination in a Mouse Model of Multiple Sclerosis

Affiliations

Lanthionine Ketimine Ethyl Ester Accelerates Remyelination in a Mouse Model of Multiple Sclerosis

Jeffrey L Dupree et al. ASN Neuro. 2022 Jan-Dec.

Abstract

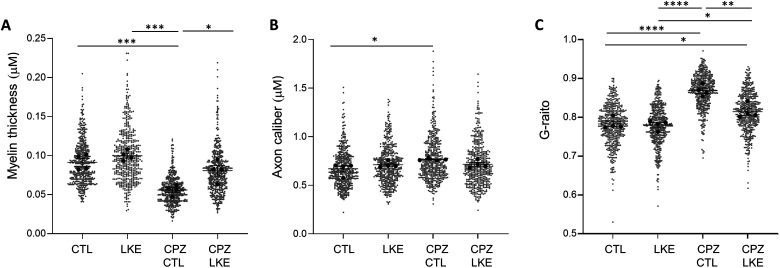
Although over 20 disease modifying therapies are approved to treat Multiple Sclerosis (MS), these do not increase remyelination of demyelinated axons or mitigate axon damage. Previous studies showed that lanthionine ketenamine ethyl ester (LKE) reduces clinical signs in the experimental autoimmune encephalomyelitis (EAE) mouse model of MS and increased maturation of oligodendrocyte (OL) progenitor cells (OPCs) in vitro. In the current study, we used the cuprizone (CPZ) demyelination model of MS to test if LKE could increase remyelination. The corpus callosum (CC) and somatosensory cortex was examined by immunohistochemistry (IHC), electron microscopy and for mRNA expression changes in mice provided 5 weeks of CPZ diet followed by 2 weeks of normal diet in the presence of LKE or vehicle. A significant increase in the number of myelinated axons, and increased myelin thickness was observed in the CC of LKE-treated groups compared to vehicle-treated groups. LKE also increased myelin basic protein and proteolipid protein expression in the CC and cortex, and increased the number of mature OLs in the cortex. In contrast, LKE did not increase the percentage of proliferating OPCs suggesting effects on OPC survival and differentiation but not proliferation. The effects of LKE on OL maturation and remyelination were supported by similar changes in their relative mRNA levels. Interestingly, LKE did not have significant effects on GFAP or Iba1 immunostaining or mRNA levels. These findings suggest that remyelinating actions of LKE can potentially be formulated to induce remyelination in neurological diseases associated with demyelination including MS.

Keywords: demyelination < NEURO degeneration; myelination < NEURO development; oligodendrocytes < NEURO glia; regeneration < NEURO repair.


Conflict of interest statement

Declaration of Conflicting Interests: The author(s) declared no potential conflicts of interest with respect to the research, authorship, and/or publication of this article.

Figures

Figure 1.
Figure 1.
LKE increases the percentage of myelinated axons. (A) Overview of experimental protocol. Mice were kept on control chow (CTL) or chow containing CPZ (CPZ) for 5 weeks. LKE mice were kept on control chow for 5 weeks then provided chow containing 100 ppm LKE for a further 2 weeks. CPZ/CTL and CZP/LKE mice were kept on CPZ containing chow for 5 weeks then switched to control or LKE containing chow for a further 2 weeks. (B–F) Representative EM images of sections from the corpus callosum from each of the 5 experimental groups. Size bar is 2 microns. (G) The percentage of myelinated axons. Data is mean ± SE, n = 3 (CPZ) or n = 4 (all other groups) mice per group, an average of 11 images per mouse, and an average of 75 axons per image, for an average total # of axons counted per mouse of 860 (control), 635 (CPZ), 911 (LKE), 908 (CPZ/CTL), and 641 (CPZ/LKE). 1-way ANOVA F = 152.1, P < 0.0001. All groups were significantly different from all other groups (P < 0.0001) by Tukey's multiple comparison tests except for CTL versus LKE (not significant).
Figure 2.
Figure 2.
Effects of LKE on myelin thickness and axon caliber. EM images through the CC were analyzed using ImageJ to obtain values for (A) myelin thickness, (B) axon caliber, and (C) to calculate g-ratios. Data is presented for all individual axons counted (grey dots), and for average values obtained for each individual mouse (dark circles). Bars show mean ± se. Data is derived from 4 mice per group, an average of 120 axons per mouse, and total axons of 480 (CTL), 481 (LKE), 479 (CPZ/CTL), and 482 (CPZ/LKE). 1-way ANOVA (F = 16.3, P = 0.0002 for myelin; F = 3.8, P = 0.039 for axon; F = 30.1, P < 0.0001 for g-ratio). *, P < 0.05; **, P < 0.005; ***, P < 0.0005; ****, P < 0.0001; Tukey multiple comparisons.
Figure 3.
Figure 3.
LKE restores distribution of myelin thickness and g-ratios during remyelination. Histograms of the frequency distributions of (A) myelin thickness, (B) axon caliber and (C) g-ratios were generated for each individual mouse. Data is mean ± se of the percentage of axons in each bin, n = 4 mice per group. For myelin thickness, bin size is 0.025 microns, e.g. axons in bin 0.05 range from 0.025 to 0.050 microns. For axon caliber the bin size is 0.25 microns, e.g. axons in bin 0.50 range from 0.25 to 0.50 microns. For g-ratios the bin size is 0.04, e.g. axons in bin 0.69 have g-ratios from 0.65 to 0.69. 2-way ANOVA, 2-way interactions were F(30,132) = 7.1, P < 0.0001 for myelin thickness; F(30,132) = 16.3, P < 0.001 for g-ratio; and F(21,96) = 1.3, P = 0.167 for axon caliber. *, P < 0.05 CTL versus CPZ/CTL; #, P < 0.05 CTL versus CPZ/LKE; §, P < 0.05 CPZ/CTL versus CPZ/LKE, Tukey multiple comparisons.
Figure 4.
Figure 4.
LKE increases myelin thickness and g-ratios across all axon sizes. (A) Scatter graphs of g-ratio versus axon caliber for all axons in all groups. The data was fit by simple linear regression, slopes and intercepts are indicated. (B) Average myelin thickness and (C) average g-ratios for axons in the indicated bins were determined for each mouse. Axon bin size is 0.1 microns, axons in the 0.4 bin have calibers from 0.3 to 0.4 microns. Data is mean ± SE of n = 4 mice per group.
Figure 5.
Figure 5.
LKE increases myelin protein expression during remyelination. Representative sections through the CC and overlying somatosensory cortex (CX) stained for (A) MBP and (B) PLP from CTL, CPZ, LKE, CPZ/CTL, and CPZ/LKE mice. (C, D) MBP and (E, F) PLP staining was quantified in the CX and CC. Data is % staining intensity relative to staining in CTL samples, and is mean ± SE n = 7–9 mice per group except for PLP in the CTX for the CPZ group (n = 6). 1-way ANOVA F = 28.9 for MBP in CX; F = 20.6 for MBP in CC; F = 22.1 for PLP in CX; and F = 50.1 for PLP in CC. Significance was P < 0.0001 for C-F *, P < 0.05; **, P < 0.005; ***, P < 0.0005, ****, P < 0.0001; Tukey's multiple comparison tests. Scale bar represents 200 microns.
Figure 6.
Figure 6.
Effects of LKE on oligodendrocyte and glial mRNA levels.. Relative mRNA levels in the CC were determined by qPCR in samples from CTL, CPZ, LKE, CPZ/CTL, and CPZ/LKE mice for (A) GFAP; (B) PLP; (C) MBP; (D) GFAP; and (E) Iba1. Data is mean ± SE of n = 4 mice per group and is mRNA levels normalized to β-actin measured in the same samples, shown relative to CTL values (100%). 1-way ANOVA F = 3.3 for Olig2; F = 36.4 for PLP; F = 17.0 for MBP; F = 25.4 for GFAP; and F = 36.8 for Iba1. *, P < 0.05; ****, P < 0.0001 versus CTL. Tukey's multiple comparison tests.
Figure 7.
Figure 7.
LKE increases OLG cell numbers and OPC maturation during remyelination. (A) Representative sections through the CC and overlying somatosensory cortex (CX) stained for Olig2 and CC1 from CTL, CPZ, CPZ/CTL, and CPZ/LKE mice. Quantitation of (B) Number of Olig2 + cells; (C) Percentage of double-labeled [Olig2 + : Ki67 + ] cells out of total Olig2 + cells; (D) Number of CC1 + ; and (E) Percentage of double labeled [Olig2 + : CC1 + cells].out of total Olig2 + cells. Data is mean ± SE of n = 3 or 4 mice per group. 1-way ANOVA F = 6.6 for Olig2 + ; F = 4.9 for CC1 + ; F = 8.3 for Olig2:Ki67; and F = 16.7 for Olig2 + :CC1 + . Significance was P < 0.0001 for B–E. *, P < 0.05; ****, P < 0.0001 versus CTL. Tukey's multiple comparison tests. Scale bar represents 200 microns.
Figure 8.
Figure 8.
LKE does not reduce glial cell activation during remyelination. Representative sections through the CC and overlying somatosensory cortex (CX) stained for (A) GFAP and (B) Iba1 from CTL, CPZ, LKE, CPZ/CTL, and CPZ/LKE mice. (C, D) GFAP and (E, F) Iba1 staining was quantified in the CX and CC. Data is % staining intensity relative to CTL samples, and is mean ± SE n = 4 mice per group. 1-way ANOVA F = 23.0 for GFAP in CX; F = 20.5 for GFAP in CC; F = 0.5 for Iba1 in CX; F = 5.5 for Iba1 in CC. Significance was P < 0.0001 for B, C, D; and P < 0.05 for E,G. *, P < 0.05; **, P < 0.005; ***, P < 0.0005, ****, P < 0.0001; Tukey’s multiple comparison tests. Scale bar represents 200 microns.
Figure 9.
Figure 9.
LKE does not reduce glial cell numbers during remyelination. Representative sections through the somatosensory cortex stained for (A) GFAP and (B) Iba1 from CTL, CPZ, LKE, CPZ/CTL, and CPZ/LKE mice. Data is % cell numbers (C, D) relative to CTL samples, and is mean ± SE n = 4 mice per group. 1-way ANOVA F = 64.9 for GFAP; F = 3.8 for Iba1. Significance was P <��0.05 for C. *, P < 0.05; **, P < 0.005; ***, P < 0.0005, ****, P < 0.0001; Tukey's multiple comparison tests. Scale bar represents 90 microns.

References

    1. Aryanpour R., Zibara K., Pasbakhsh P., Namjoo S. B., Ghanbari Z., Mahmoudi A., Amani R., Kashani S. (2021). 17β- Estradiol reduces demyelination in cuprizone-fed mice by promoting M2 microglia polarity and regulating NLRP3 inflammasome. Neuroscience, 463, 116–127. https://doi.org/10.1016/j.neuroscience.2021.03.025. - PubMed
    1. Bretin S., Rogemond V., Marin P., Maus M., Torrens Y., Honnorat J., Glowinski J., Premont J., Gauchy C. (2006). Calpain product of wt-crmp2 reduces the amount of surface nr2b nmda receptor subunit. Journal of Neurochemistry, 98(4), 1252–1265. 10.1111/j.1471-4159.2006.03969.x - DOI - PubMed
    1. Brittain J. M., Pan R., You H., Brustovetsky T., Brustovetsky N., Zamponi G. W., Lee W. H., Khanna R. (2012). Disruption of nmdar-crmp-2 signaling protects against focal cerebral ischemic damage in the rat middle cerebral artery occlusion model. Channels (Austin), 6(1), 52–59. 10.4161/chan.18919 - DOI - PMC - PubMed
    1. Brittain J. M., Piekarz A. D., Wang Y., Kondo T., Cummins T. R., Khanna R. (2009). An atypical role for collapsin response mediator protein 2 (crmp-2) in neurotransmitter release via interaction with presynaptic voltage-gated calcium channels. Journal of Biological Chemistry, 284(45), 31375–31390. 10.1074/jbc.M109.009951 - DOI - PMC - PubMed
    1. Brustovetsky T., Pellman J. J., Yang X. F., Khanna R., Brustovetsky N. (2014). Collapsin response mediator protein 2 (crmp2) interacts with n-methyl-d-aspartate (nmda) receptor and na + /ca2 + exchanger and regulates their functional activity. Journal of Biological Chemistry, 289(11), 7470–7482. 10.1074/jbc.M113.518472 - DOI - PMC - PubMed

Publication types