. 2022 Dec;74(12):1971-1983.
doi: 10.1002/art.42284. Epub 2022 Nov 6.

Modulation of the Itaconate Pathway Attenuates Murine Lupus

Affiliations

Modulation of the Itaconate Pathway Attenuates Murine Lupus

Luz P Blanco et al. Arthritis Rheumatol. 2022 Dec.

Abstract

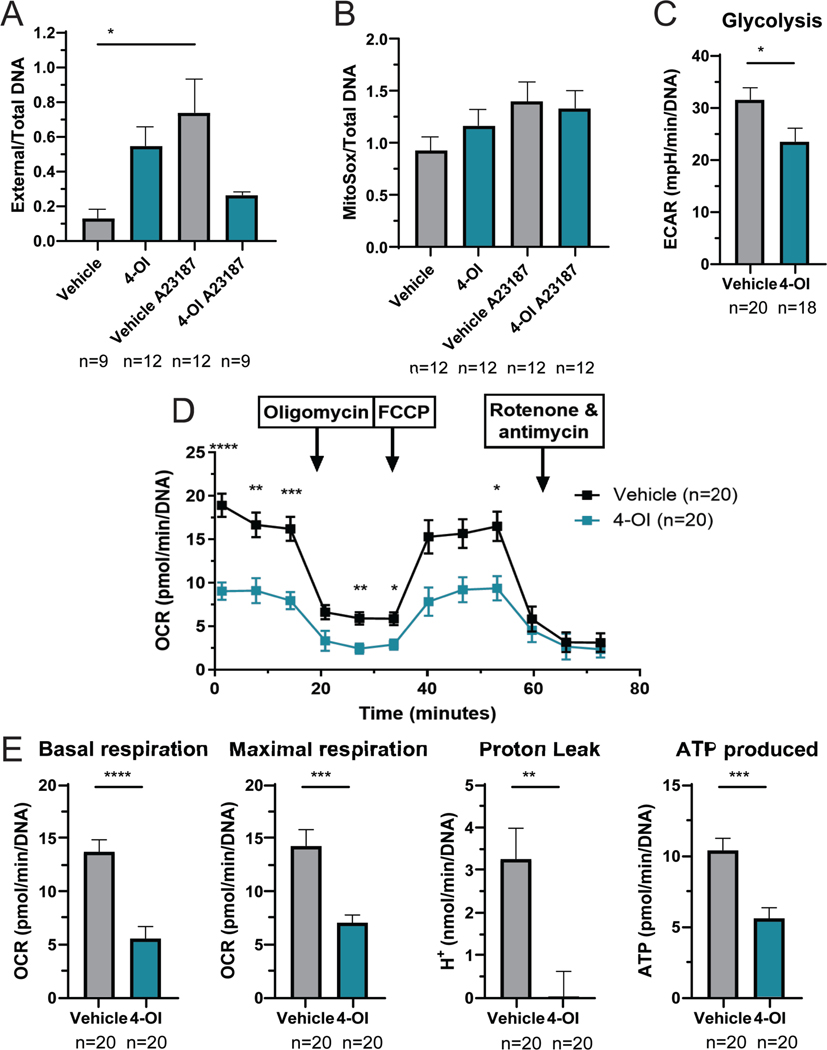
Objective: Itaconic acid, a Krebs cycle-derived immunometabolite, is synthesized by myeloid cells in response to danger signals to control inflammasome activation, type I interferon (IFN) responses, and oxidative stress. As these pathways are dysregulated in systemic lupus erythematosus (SLE), we investigated the role of an itaconic acid derivative in the treatment of established murine lupus.

Methods: Female (NZW × NZB)F1 lupus-prone mice were administered 4-octyl itaconate (4-OI) or vehicle starting after clinical onset of disease (30 weeks of age) for 4 weeks (n = 10 mice /group). At 34 weeks of age (peak disease activity), animals were euthanized, organs and serum were collected, and clinical, metabolic, and immunologic parameters were evaluated.

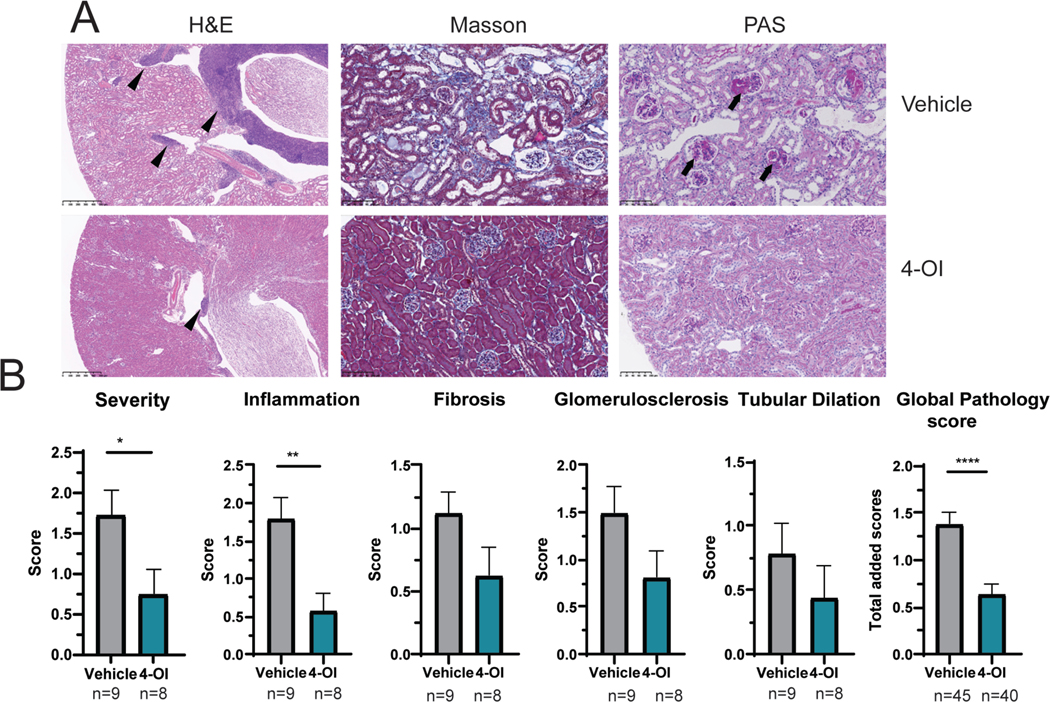
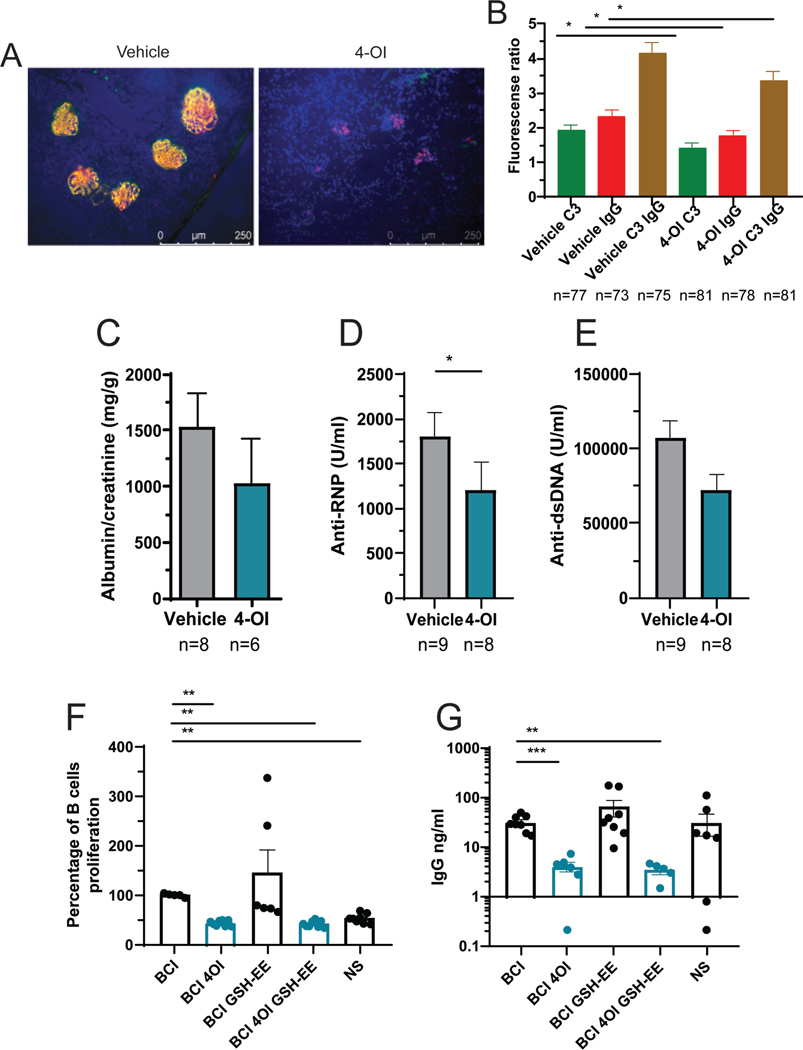
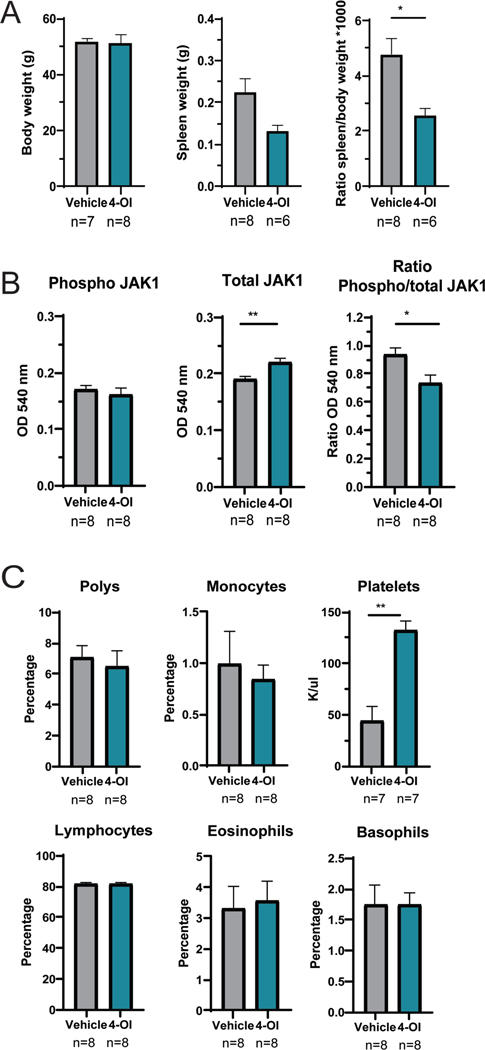
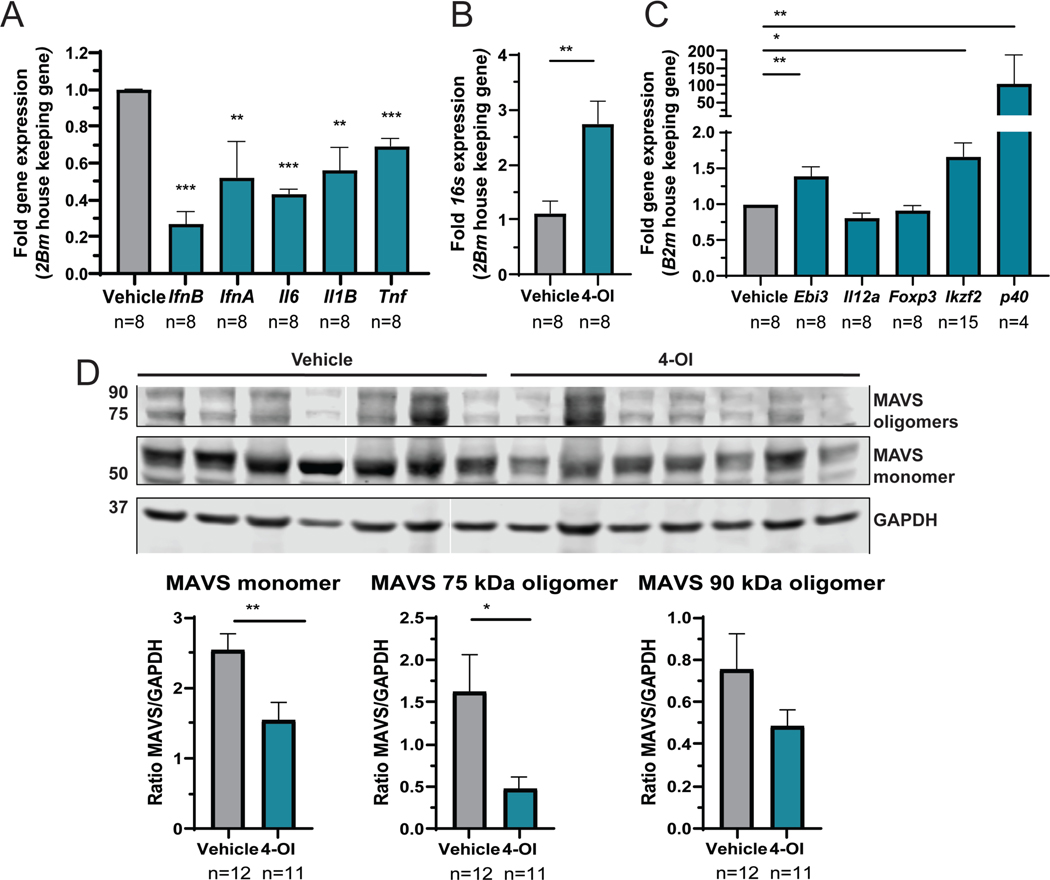
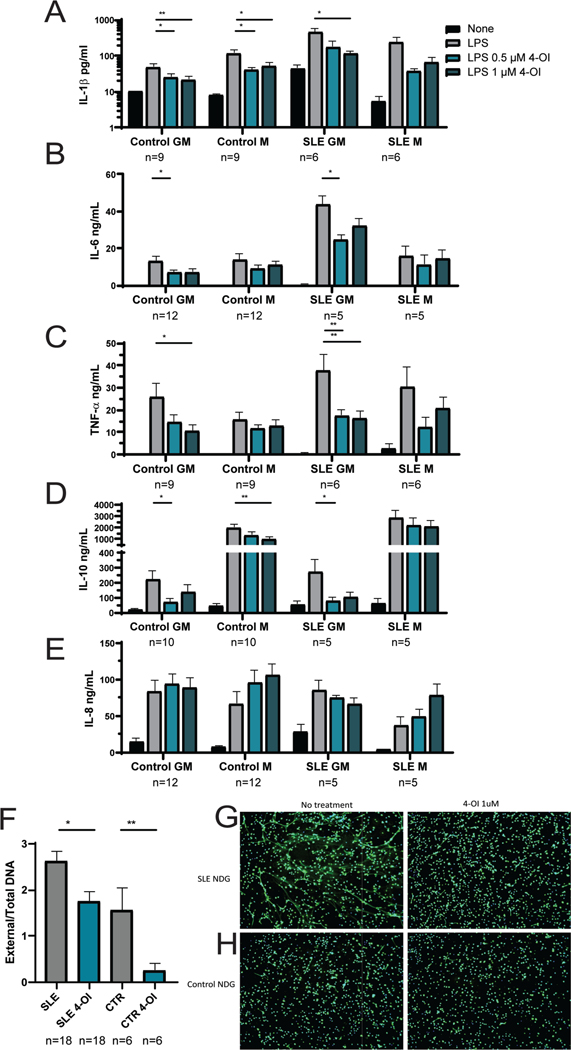
Results: Proteinuria, kidney immune complex deposition, renal scores of severity and inflammation, and anti-RNP autoantibodies were significantly reduced in the 4-OI treatment group compared to the vehicle group. Splenomegaly decreased in the 4-OI group compared to vehicle, with decreases in activation markers in innate and adaptive immune cells, increases in CD8+ T cell numbers, and inhibition of JAK1 activation. Gene expression analysis in splenocytes showed significant decreases in type I IFN and proinflammatory cytokine genes and increased Treg cell-associated markers in the 4-OI group compared to the vehicle group. In human control and lupus myeloid cells, 4-OI in vitro treatment decreased proinflammatory responses and B cell responses.

Conclusions: These results support targeting immunometabolism as a potentially viable approach in autoimmune disease treatment, with 4-OI displaying beneficial roles attenuating immune dysregulation and organ damage in lupus.


Conflict of interest statement

There are no conflicts of interest.

Figures

Figure 1:
Figure 1:. Attenuation of lupus kidney pathology by 4-OI.
A) Representative kidney tissue images showing H&E, Masson, and PAS staining. Magnifications are 40x for H&E and 200x for Masson and PAS. In H&E; arrowheads show inflammation. In PAS, arrows indicate glomerulosclerosis. B) Graphs display kidney pathology scores. Bar graphs represent mean ± SEM. In all studies mice were treated with 4-OI or vehicle control; n=number of animals except in global pathology score where all the individual scores (severity, inflammation, fibrosis, glomerulosclerosis, and tubular dilation) are graphed together per group. The statistical analysis was done using Mann Whitney test *:p<0.05, **:p<0.01: ****:p<0.001.
Figure 2:
Figure 2:. Attenuation of kidney damage, serum autoantibody levels, and human B cell responses by 4-OI.
A) Representative immunofluorescence microphotographs displaying IC deposition (IgG red, C3 green, nuclei in blue); magnification 40x. B) Image J quantification depicting pixel analysis of glomeruli in 3 different images/mouse from panel A. C) Analysis of proteinuria at the time of euthanasia. Serum antibodies against D) RNP, and E) ds-DNA; mice were treated with 4-OI or vehicle control with n numbers indicated in the figure; the discrepancy in numbers is due to failure to collect urine in some of the mice in C. F) Human B cell proliferation after stimulation (BCI) or non-stimulation (NS) and G) total IgG secretion in 3 different healthy donors. Bar graphs represent mean ± SEM. The statistical analysis was done using Mann Whitney test *:p<0.05, **:p<0.01, ***:p<0.001.
Figure 3:
Figure 3:. 4-OI modulates splenomegaly, JAK1 activation, and platelet counts.
A) Body and spleen weights, and their ratio are displayed. B) Spleen tissue was homogenized and phospho- and total- JAK1 protein were detected by ELISA. C) Complete blood counts. In both studies mice treated with 4-OI or vehicle control with n= numbers indicated in the figure; bar graphs represent mean ± SEM, and statistical analysis was done using Mann Whitney test *:p<0.05; **:p<0.01; outlier data points were detected using GraphPad ROUT method (Q=10%) and excluded from the analysis.
Figure 4:
Figure 4:. Effect of 4-OI in gene expression and inflammasome protein expression in spleen cells.
A) Gene expression in splenocytes was analyzed by q-RT-PCR normalized against B2m housekeeping gene. B) The 16s mitochondrial gene expression in splenocytes was determined as a surrogate of mitochondrial transcriptional activity by q-RT-PCR. C) Gene expression of associated Treg markers. In these studies, mice were treated with 4-OI or vehicle control with n= numbers indicated in the figure corresponding to 4 animals per group and 2 technical duplicates, except for Ikzf2 done in quadruplicate; the missing values are samples with no amplification. Statistical analysis was done using Mann Whitney test, **:p<0.01; ***:p<0.005. D) The expression of MAVS monomer, 75, and 90 kDA oligomers, and GAPDH wasquantified by Western blot in lysates of splenocytes from vehicle- or 4-OI-treated mice. Representative Western blot image of 2 similar experiments: the first blot was performed with 5 vehicle-treated animals and four 4-OI treated-animals; the second blot was with 7 animals in each group. Results represent the average ± SEM of protein versus GAPDH loading control ratio. Statistical analysis was done using Mann Whitney test *:p<0.05; **:p<0.01.
Figure 5:
Figure 5:. 4-OI modulates NET formation and immune-metabolism.
A) NETs were quantified in BM-derived neutrophils, 2 h post-plating, by SYTOX/Pico Green plate assay to measure external and total DNA, respectively. B) mROS was quantified in BM-derived neutrophils at 1 h using MitoSox, by plate assay. In both A and B, mice were treated with 4-OI or vehicle control per group; data points include 4 animals per group and 3 technical repeats, and neutrophils were stimulated with the A23187 calcium ionophore (250 uM) to induce NETs and mROS. The statistical analysis was done using Mann Whitney test *:p<0.05. C) Glycolysis of murine BM-differentiated macrophages, measured by Seahorse; data points are shown which include 4 animals per group and 5 technical repeats. D) Seahorse mitochondrial stress test analysis of splenocytes; statistical analysis using 2-way ANOVA. E) Parameters for splenocytes calculated from D. Seahorse studies included mice treated with 4-OI or vehicle control per group; data points shown include 4 animals per group and 5 technical repeats. Bar graphs represent mean ± SEM. The statistical analysis was done using Mann Whitney test, **:p<0.01; ***:p<0.005; ****p<0.001. In these experiments outlier data points excluded were detected using GraphPad ROUT method (Q=10%).
Figure 6:
Figure 6:. In vitro effect of 4-OI on cytokine release by human-monocyte derived primary macrophages and NET formation by human neutrophils.
A-E) Human primary monocyte-derived macrophages (at least n=6 from different donors) were obtained from healthy control or SLE subjects circulating monocytes by differentiating with either GM-CSF (GM proinflammatory) or M-CSF (M anti-inflammatory) for 7 days. Cytokines in supernatants were measured by ELISA after 24 h treatment with 4-OI or vehicle. The cytokines measured were A) IL1-beta, B) IL-6, C) TNF-alpha, D) IL-10, and E) IL-8. F) NET formation in normal dense granulocytes (NDGs) measured by fluorometry plate assay. Shown is mean ± SEM from SLE and healthy control (CTR) neutrophils, with numbers indicated in the figure, corresponding to 9 SLE and 3 healthy controls, done by technical duplicates; G-H) and by fluorescent microscopy imaging showing merged immunofluorescence staining with primary antibody against neutrophil elastase (green) and DNA (nuclei and NET fibers, Hoechst, blue); representative images of neutrophils from G) SLE and from H) healthy controls; magnification is 10 x. Bar graphs represent mean ± SEM. The statistical analysis was done using Mann Whitney test *:p<0.05; **:p<0.01

References

    1. Kaplan MJ. Role of neutrophils in systemic autoimmune diseases. Arthritis Research & Therapy. 2013;15(5):219-. - PMC - PubMed
    1. Mohan C, Putterman C. Genetics and pathogenesis of systemic lupus erythematosus and lupus nephritis. Nat Rev Nephrol. 2015;11(6):329–41. - PubMed
    1. Kiriakikidou M, Chin KL. Systemic Lupus Erythematosus. Annals of Internal Medicine. 2020;172(11):ITC81–ITC96. - PubMed
    1. Crow MK, Olferiev M, Kirou KA. Type I Interferons in Autoimmune Disease. Annual Review of Pathology: Mechanisms of Disease. 2019;14(1):369–93. - PubMed
    1. Li Z, Guo J, Bi L. Role of the NLRP3 inflammasome in autoimmune diseases. Biomedicine & Pharmacotherapy. 2020;130:110542. - PubMed

Publication types