. 2022 Dec;54(1):1867-1883.
doi: 10.1080/07853890.2022.2089728.

Neural regeneration therapy after spinal cord injury induces unique brain functional reorganizations in rhesus monkeys

Affiliations

Neural regeneration therapy after spinal cord injury induces unique brain functional reorganizations in rhesus monkeys

Jia-Sheng Rao et al. Ann Med. 2022 Dec.

Abstract

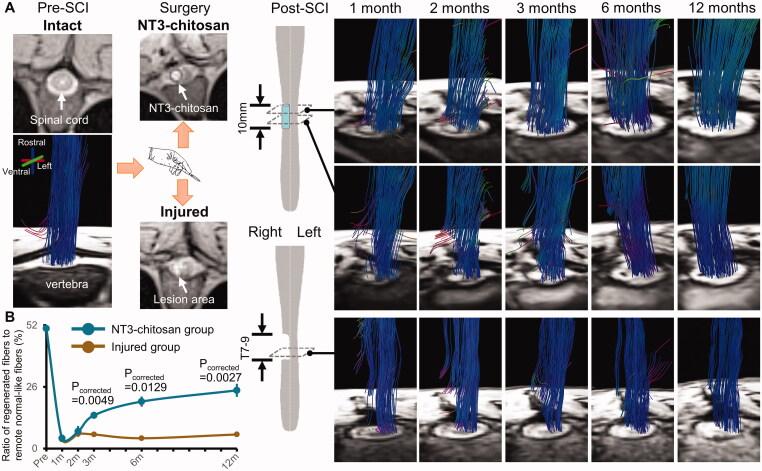
Purpose: Spinal cord injury (SCI) destroys the sensorimotor pathway and induces brain plasticity. However, the effect of treatment-induced spinal cord tissue regeneration on brain functional reorganization remains unclear. This study was designed to investigate the large-scale functional interactions in the brains of adult female Rhesus monkeys with injured and regenerated thoracic spinal cord.

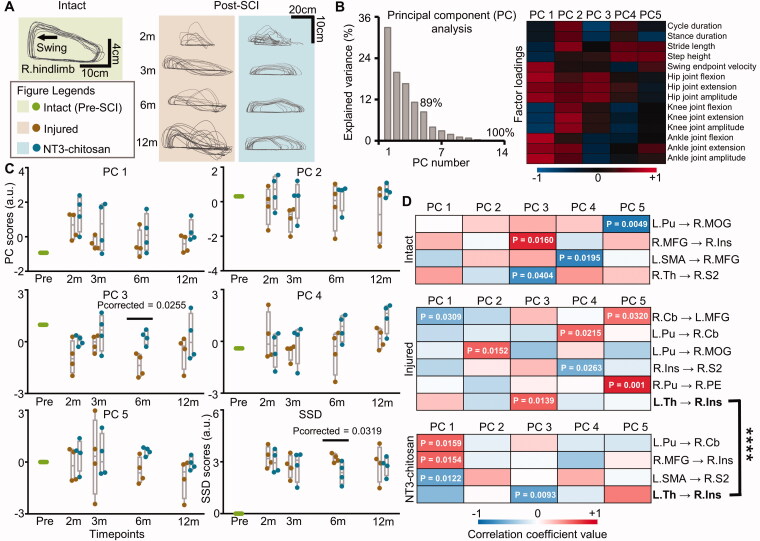
Materials and methods: Resting-state functional magnetic resonance imaging (fMRI) combined with Granger Causality analysis (GCA) and motor behaviour analysis were used to assess the causal interaction between sensorimotor cortices, and calculate the relationship between causal interaction and hindlimb stepping in nine Rhesus monkeys undergoing lesion-induced spontaneous recovery (injured, n = 4) and neurotrophin-3/chitosan transplantation-induced regeneration (NT3-chitosan, n = 5) after SCI.

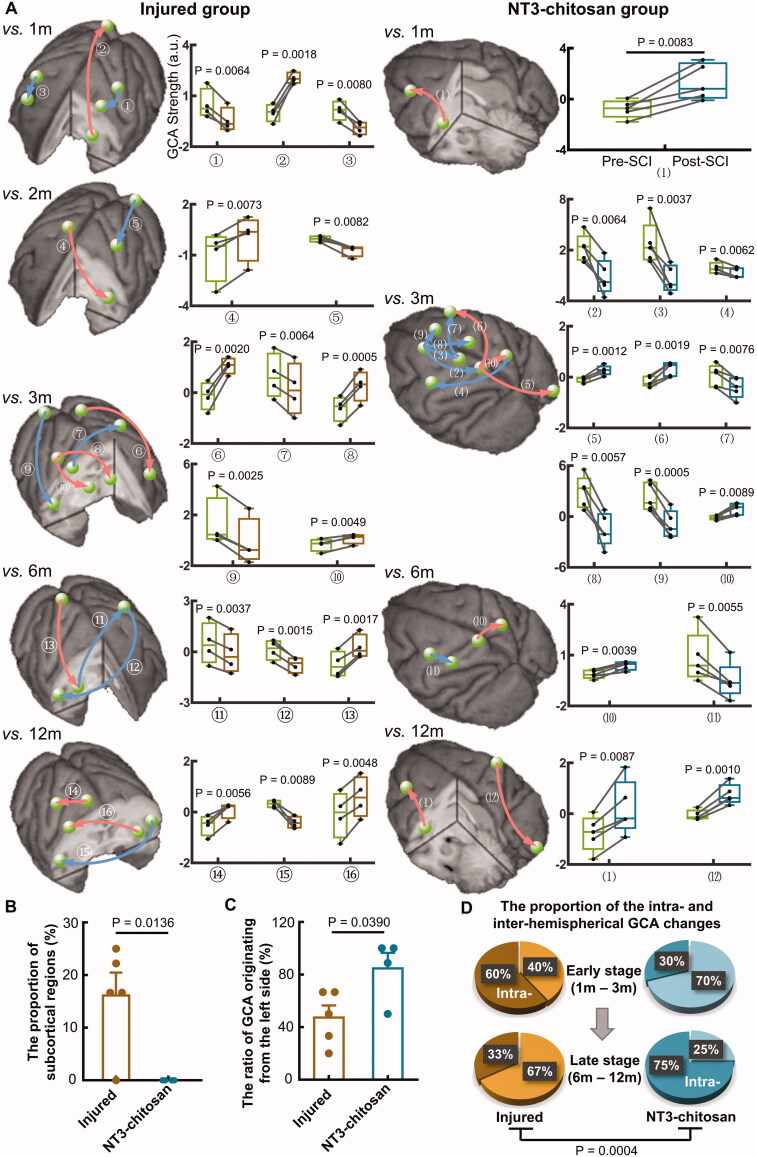
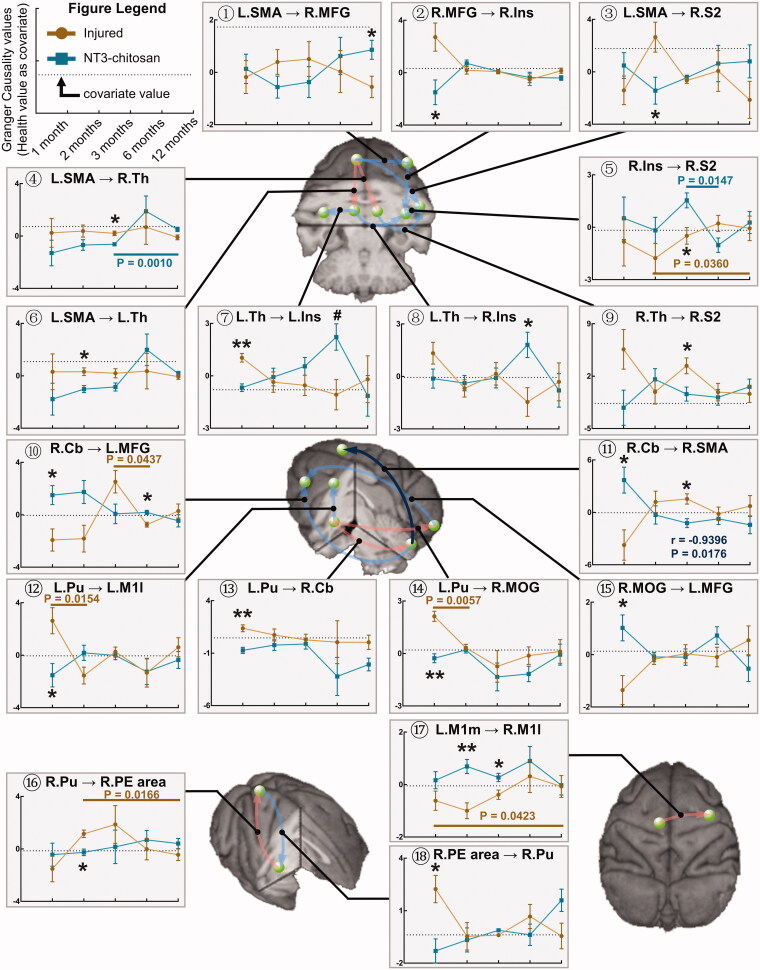
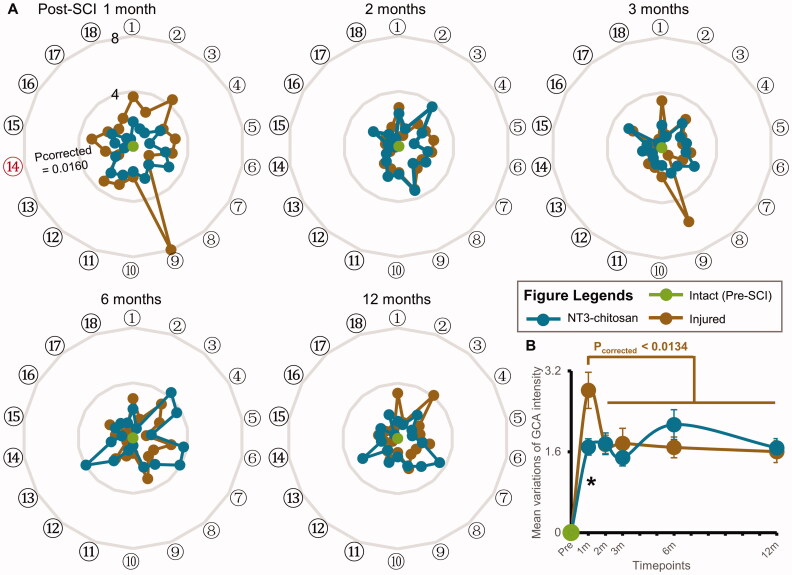
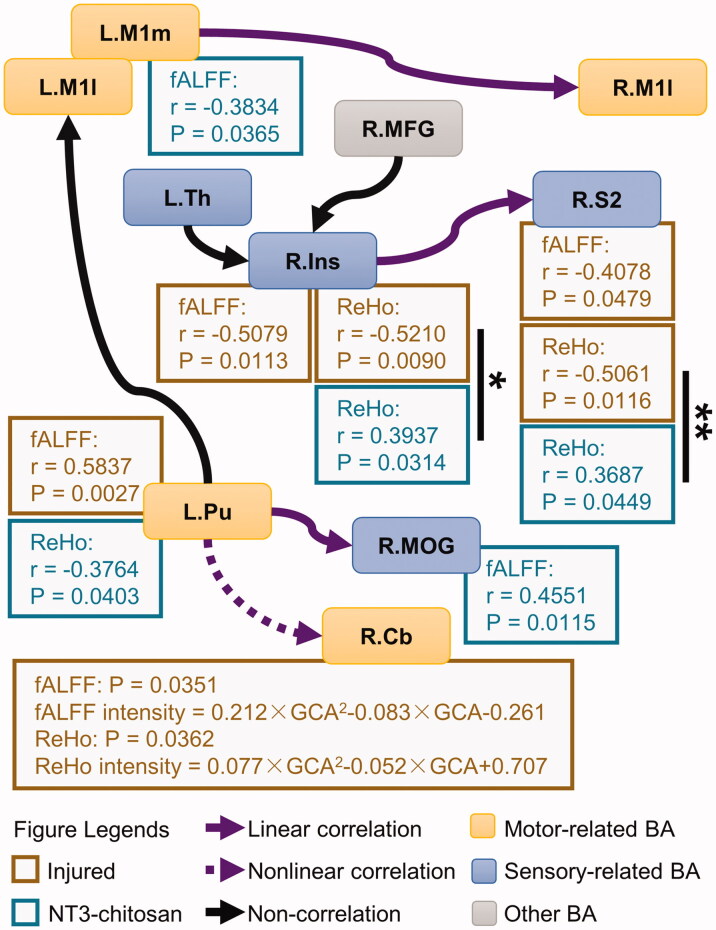
Results: The results showed that the injured and NT3-chitosan-treated animals had distinct spatiotemporal features of brain functional reorganization. The spontaneous recovery followed the model of "early intra-hemispheric reorganization dominant, late inter-hemispheric reorganization dominant", whereas regenerative therapy animals showed the opposite trend. Although the variation degree of information flow intensity was consistent, the tendency and the relationship between local neuronal activity properties and coupling strength were different between the two groups. In addition, the injured and NT3-chitosan-treated animals had similar motor adjustments but various relationship modes between motor performance and information flow intensity.

Conclusions: Our findings show that brain functional reorganization induced by regeneration therapy differed from spontaneous recovery after SCI. The influence of unique changes in brain plasticity on the therapeutic effects of future regeneration therapy strategies should be considered. Key messagesNeural regeneration elicited a unique spatiotemporal mode of brain functional reorganization in the spinal cord injured monkeys, and that regeneration does not simply reverse the process of brain plasticity induced by spinal cord injury (SCI).Independent "properties of local activity - intensity of information flow" relationships between the injured and treated animals indicating that spontaneous recovery and regenerative therapy exerted different effects on the reorganization of the motor network after SCI.A specific information flow from the left thalamus to the right insular can serve as an indicator to reflect a heterogeneous "information flow - motor performance" relationship between injured and treated animals at similar motor adjustments.

Keywords: Nonhuman primate; causal interactions; neural regeneration; reorganization; sensorimotor cortex.


Conflict of interest statement

No potential conflict of interest was reported by the authors.

Figures

Figure 1.
Figure 1.
Representative DTI-fibre tracking longitudinal results of injured and NT3-chitosan treated animals. Data processing just following the same methods as we previously reported [26]. (A) Reconstructed fibre bundles were superimposed on the corresponding axial PD weighted structural images. Before operation, the structure of the spinal cord exhibited good integrity, and the fibre bundles filled the whole spinal cord structure in an orderly manner. After operation, the tissue of the right thoracic cord was damaged and the structural integrity was destroyed, and the implanted NT3–chitosan scaffold could be clearly observed. The fibres (rostrocaudal orientation) gradually extended across the surgical site over time, reconnecting the rostral and caudal ends of the injured cord in the regenerative therapy animals. On the axial structural images, the material boundary gradually blurred and disappeared with the degradation of the implanted NT3-chitosan scaffold. In injured animals, no fibre bundles were present within the lesion and passed through the injured site. (B) The proportion of the regenerated fibres to the number of remote normal-like spinal cord fibres was significantly different between the two groups at 3, 6, and 12 months post-SCI (Independent t-test with Bonferroni multiple comparisons). m, months.
Figure 2.
Figure 2.
The injured and NT3-chitosan-treated animals have different brain functional reorganization features. (A) Causal interactions that significantly deviated from intact status in each timepoint post-SCI were superimposed on the three-dimensional monkey brain. The corresponding quantitative assessment described the alteration of intensity (Paired t-test with Bonferroni multiple comparisons). Red indicates the GCA intensity that is significantly higher than the intact state, whereas blue indicates the opposite. Box plots show the median and 25th and 75th percentiles; whiskers indicate the minimum and maximum values. Raw data were shown in graphs. The green ball represents both ends of the brain regions of the causal interaction, and the arrows indicate the direction of information flow. (B) Significant difference between the two groups in the proportion of subcortical regions involved in the reorganization (Independent t-test). (C) Notable difference between the two groups in the ratio of GCA originating from the left brain regions (Independent t-test). Data dots represent the proportion at each timepoint post-SCI. (D) The two group animals differed in the proportions of intra- and inter-hemispheric GCA alterations at early and late stages (Chi-square test). L: left; R: right; m: months; S1l: lateral primary somatosensory cortex; M1l: lateral primary motor cortex; Pu: putamen; MOG: middle occipital gyrus; MFG: middle frontal gyrus; M1m: medial primary motor cortex; Ins: insula; PE area: parieto-occipital association cortex; Th: thalamus; S2: secondary somatosensory cortex; SMA: supplementary motor area; S1m: medial primary somatosensory cortex. Injured group: ①L.S1l→L.M1l, ②L.Pu→R.MOG, ③R.M1l→R.MFG, ④R.M1m→L.Ins, ⑤L.MOG→L.S1l, ⑥L.PE area→L.MFG, ⑦R.M1l→L.S1l, ⑧R.S1l→L.Th, ⑨R.MOG→R.S2, ⑩R.S1l→R.Th, ⑪R.Pu→L.S1l, ⑫L.S1l→R.S2, ⑬R.PE area→R.Pu, ⑭R.M1m→R.S1l, ⑮L.S2→R.S2, ⑯L.Pu→R.M1l. NT3-chitosan group: (1)L.Ins→L.MFG, (2)L.SMA→L.S1m, (3)L.SMA→L.M1m, (4)R.PE area→L.M1l, (5)L.S1m→R.MOG, (6)L.S1m→R.MFG, (7)L.M1m→R.MFG, (8)L.SMA→R.M1m, (9)L.SMA→R.SMA, (10)L.S1m→R.PE area, (11)L.M1l→L.S1l, (12)R.S1l→R.MOG.
Figure 3.
Figure 3.
Brain reorganization processes are mostly independent between the injured and NT3-chitosan-treated groups. Granger Causality connections that were significantly affected by time × group interaction were overlaid on the three-dimensional monkey brain (repeated-measures ANOVA, for detailed values see Supplementary Table 1). Quantitative evaluation was performed to describe the longitudinal variation in the corresponding GCA intensity with time. Light red/blue indicates positive/negative correlations (but not significant) in GCA intensity between the two groups, and dark blue indicates a prominent negative relationship (information flow R.Cb→R.SMA, r and p values are given). Single-factor principal effect analysis showed that the intra-group GCA intensity of injured (brown) and NT3-chitosan (dark cyan) animals altered remarkably among different time points (p values have been given). Inter-group analysis displayed significant differences in GCA intensity at a specific timepoint. Data are presented as mean ± SEM. *p < 0.05; **p < 0.01 (for detailed p values see Supplementary Table 1). L: left; R: right; SMA: supplementary motor area; MFG: middle frontal gyrus; Ins: insula; S2: secondary somatosensory cortex; Th: thalamus; Cb; cerebellum; Pu: putamen; M1l: lateral primary motor cortex; MOG: middle occipital gyrus; PE area: parieto-occipital association cortex; M1m: medial primary motor cortex.
Figure 4.
Figure 4.
Intensity changes of brain causal interactions between the injured and NT3-chitosan groups are basically the same. (A) Radar map showing the extent of GCA changes which were significantly affected by time × group interaction. Order numbers were corresponded to the ones also shown in Figure 3. The red serial number indicates a noteworthy difference in variation degree between the two groups (independent t-test with Bonferroni multiple comparisons). (B) Change extent and tendency of GCA intensity with time in the two groups (intra-group: paired t-test with Bonferroni multiple comparisons; inter-group: independent t-test with Bonferroni multiple comparisons, *pcorrected = 0.0369). L: left; R: right; SMA: supplementary motor area; MFG: middle frontal gyrus; Ins: insula; S2: secondary somatosensory cortex; Th: thalamus; Cb: cerebellum; Pu: putamen; M1l: lateral primary motor cortex; MOG: middle occipital gyrus; PE area: parieto-occipital association cortex; M1m: medial primary motor cortex. Order numbers: ①L.SMA→R.MFG, ②R.MFG→R.Ins, ③L.SMA→R.S2, ④L.SMA→R.Th, ⑤R.Ins→R.S2, ⑥L.SMA→L.Th, ⑦L.Th→L.Ins, ⑧L.Th→R.Ins, ⑨R.Th→R.S2, ⑩R.Cb→L.MFG, ⑪R.Cb→R.SMA, ⑫L.Pu→L.M1l, ⑬L.Pu→R.Cb, ⑭L.Pu→R.MOG, ⑮R.MOG→L.MFG, ⑯R.Pu→R.PE area, ⑰L.M1m→R.M1l, ⑱R.PE area→R.Pu.
Figure 5.
Figure 5.
The injured and NT3-chitosan-treated animals have different relationships between the intensity of information flow and the property of the spontaneous activities. Correlations between the intensity of the information flow that was affected by time × group interaction and the fALFF/ReHo values in the brain regions corresponding to these flows were shown (r and p values are given). No pronounced relationship was observed between other information flows and the properties of local brain activity. Significant differences in correlation mode between the two groups were calculated (Chow-test with Bonferroni multiple comparisons). *p < 0.05; **p < 0.01. L: left; R: right; M1l: lateral primary motor cortex; M1m: medial primary motor cortex; Th: thalamus; MFG: middle frontal gyrus; Ins: insula; S2: secondary somatosensory cortex; Pu: putamen; MOG: middle occipital gyrus; Cb: cerebellum.
Figure 6.
Figure 6.
The injured and NT3-chitosan-treated animals have similar motor adjustments but different relationship modes between motor performance and information flow intensity. (A) Representative limb endpoint trajectories during consecutive stepping on a treadmill pre- and post-SCI showing the recovery of gait performance over time. (B) PCA was used to evaluate all parameters for each gait cycle. The first five PCs (PC1–5) with a cumulative variance interpretation rate of 89% were extracted. The factor loading matrix showed the correlation between each gait variable and each PC. Colour bar represents the value of correlation coefficients. (C) PC1-5 and SSD scores were compared between the two groups (independent t-test with Bonferroni multiple comparisons). SSD score indicated the extent of PC1-5 values which deviated from the intact. Significant differences were observed at 6 months post-SCI. (D) Significant relationships between PC1–5 scores and information flow intensity in animals with intact, injured, or NT3-chitosan treated status were displayed (p values have been given). The two groups showed diverse correlation patterns (Chow-test, ****F1,29 = 20.9057, p = 0.83 × 10−4). L: left; R: right; m: months; SSD: the sum of square deviation; Pu: putamen; MOG: middle occipital gyrus; MFG: middle frontal gyrus; Ins: insula; SMA: supplementary motor area; Th: thalamus; S2: secondary somatosensory cortex; Cb: cerebellum; PE: parieto-occipital association cortex.

References

    1. Darian-Smith C. Synaptic plasticity, neurogenesis, and functional recovery after spinal cord injury. Neuroscientist. 2009;15(2):149–165. - PMC - PubMed
    1. Freund P, Weiskopf N, Ashburner J, et al. MRI investigation of the sensorimotor cortex and the corticospinal tract after acute spinal cord injury: a prospective longitudinal study. Lancet Neurol. 2013;12(9):873–881. - PMC - PubMed
    1. Ghosh A, Haiss F, Sydekum E, et al. Rewiring of hindlimb corticospinal neurons after spinal cord injury. Nat Neurosci. 2010;13(1):97–104. - PubMed
    1. Rao JS, Ma M, Zhao C, et al. Atrophy and primary somatosensory cortical reorganization after unilateral thoracic spinal cord injury: a longitudinal functional magnetic resonance imaging study. Biomed Res Int. 2013;2013:753061. - PMC - PubMed
    1. Sydekum E, Ghosh A, Gullo M, et al. Rapid functional reorganization of the forelimb cortical representation after thoracic spinal cord injury in adult rats. NeuroImage. 2014;87:72–79. - PubMed

Publication types