. 2022 Sep 2;12(9):2098-2119.
doi: 10.1158/2159-8290.CD-21-1508.

Common Trajectories of Highly Effective CD19-Specific CAR T Cells Identified by Endogenous T-cell Receptor Lineages

Affiliations

Common Trajectories of Highly Effective CD19-Specific CAR T Cells Identified by Endogenous T-cell Receptor Lineages

Taylor L Wilson et al. Cancer Discov. .

Abstract

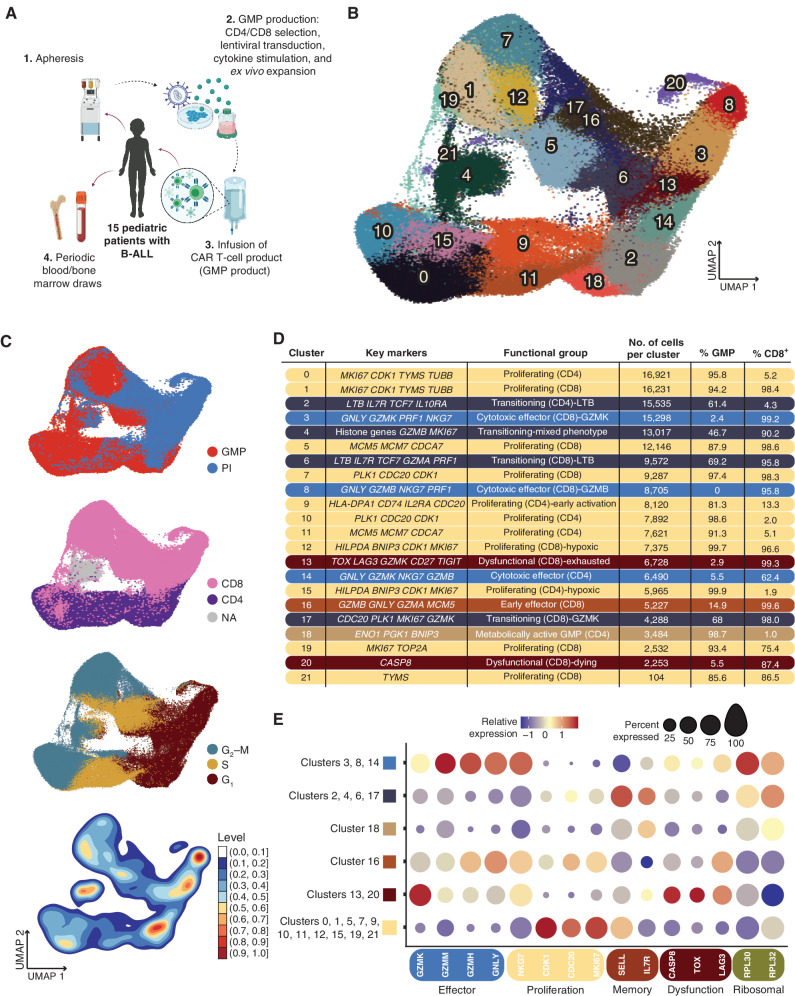
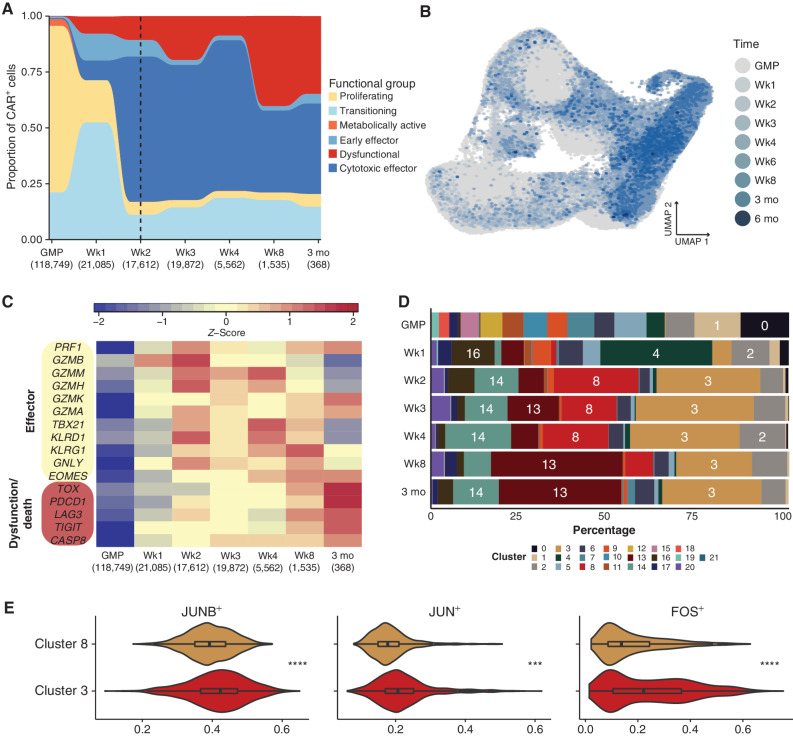
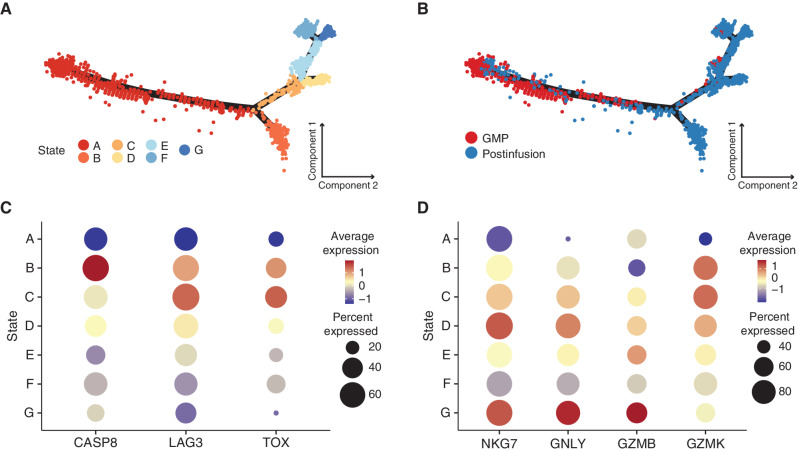
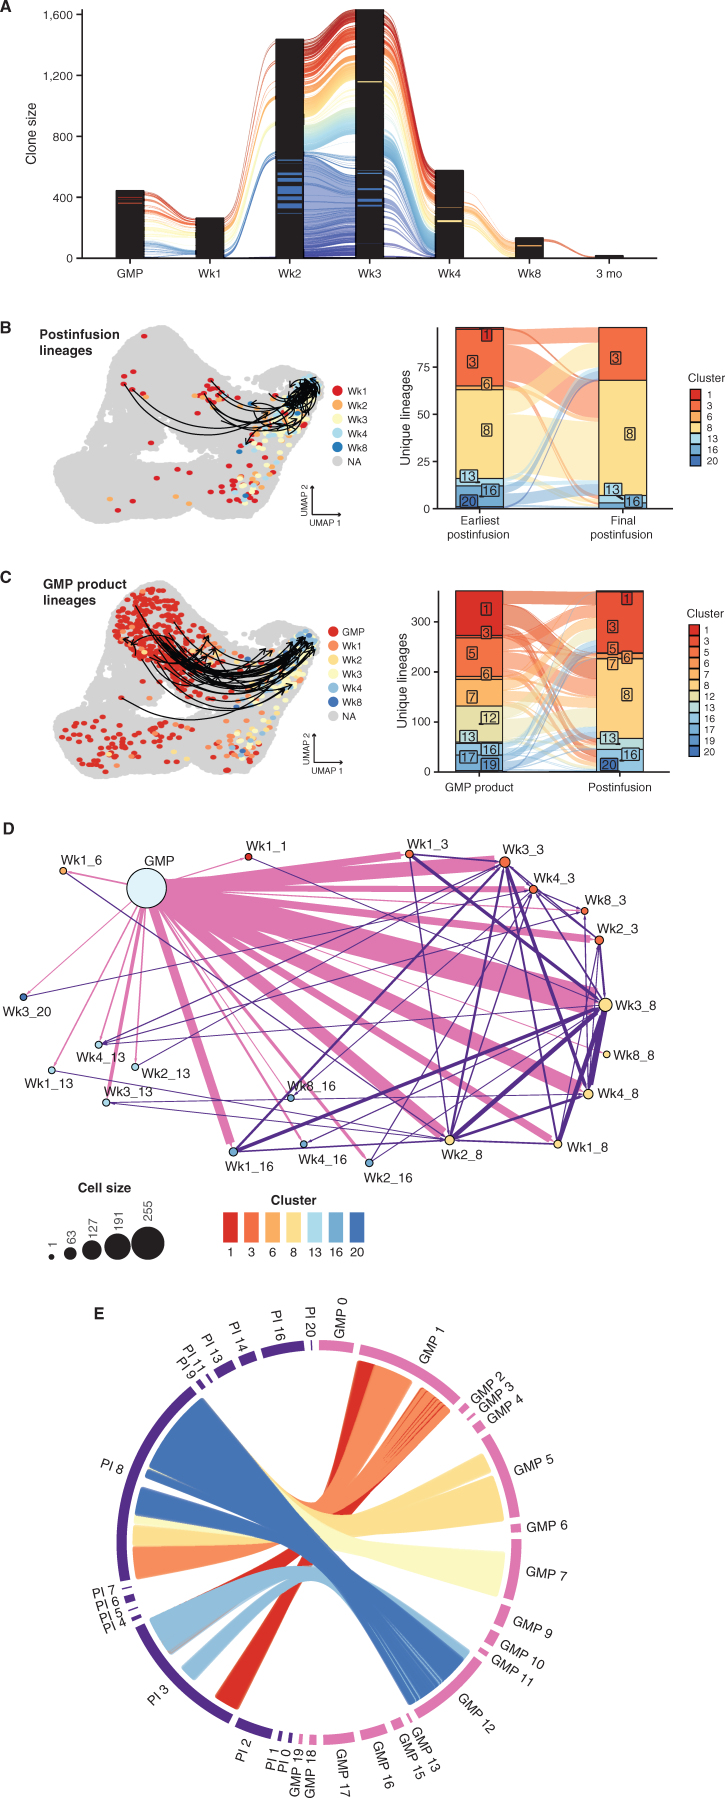
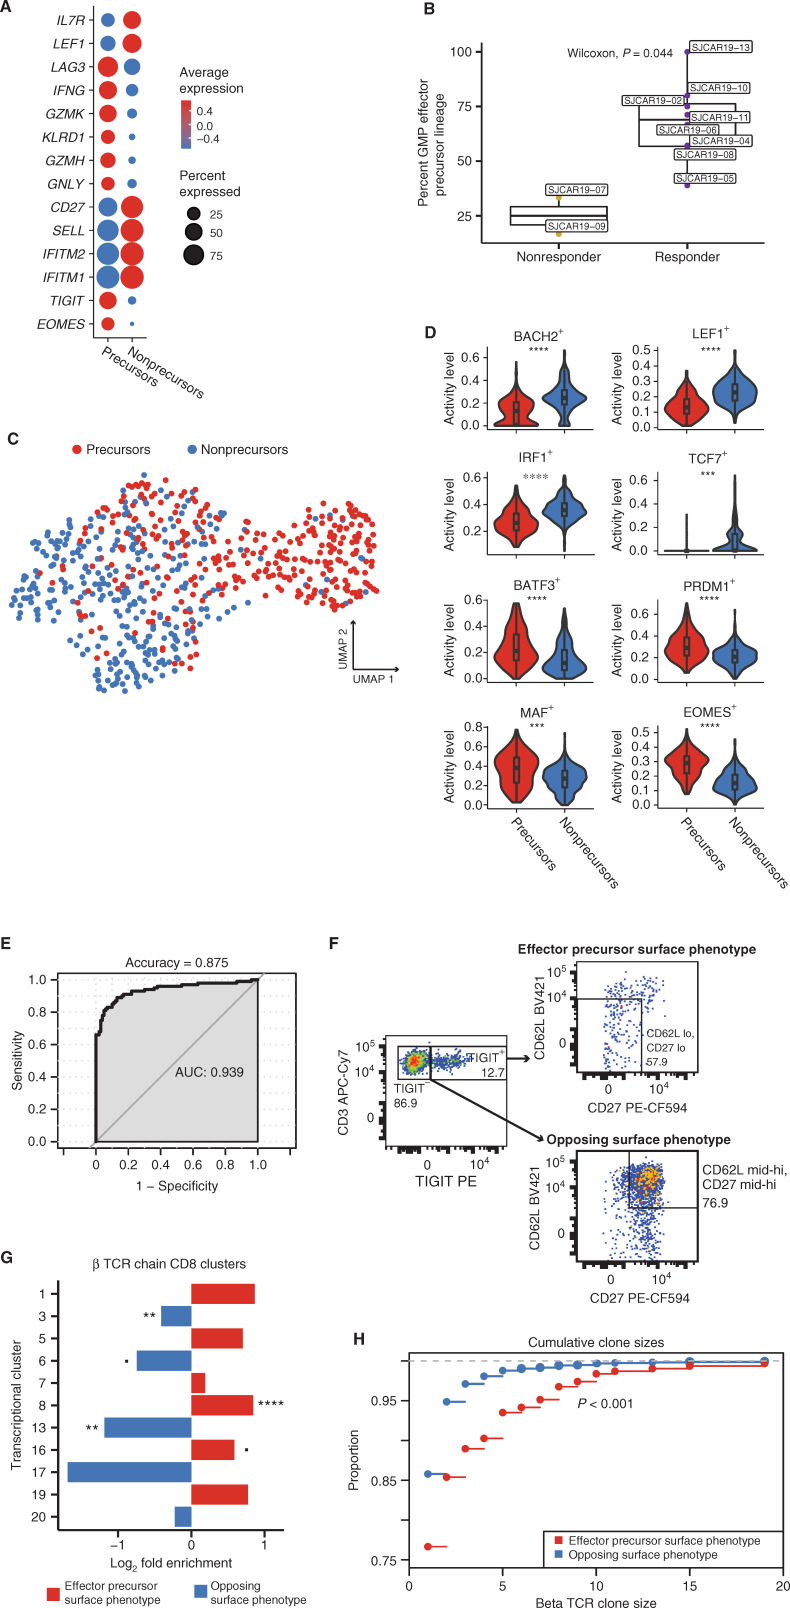
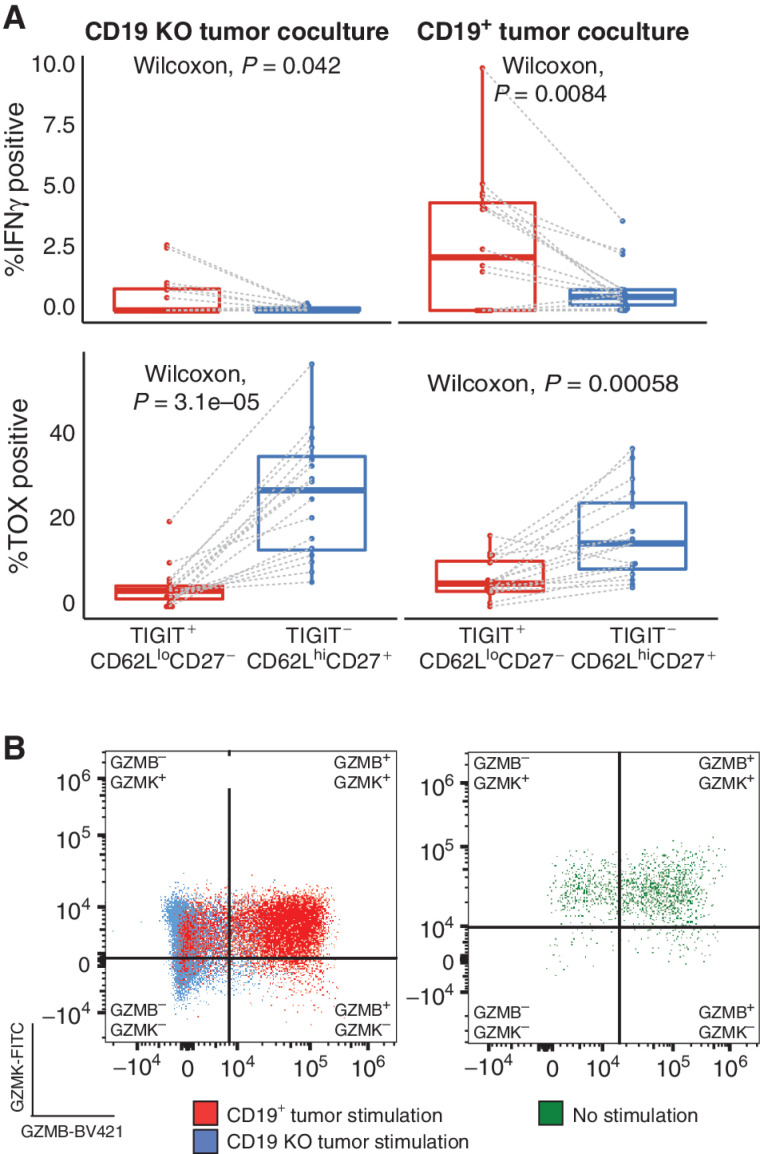
Current chimeric antigen receptor-modified (CAR) T-cell products are evaluated in bulk, without assessing functional heterogeneity. We therefore generated a comprehensive single-cell gene expression and T-cell receptor (TCR) sequencing data set using pre- and postinfusion CD19-CAR T cells from blood and bone marrow samples of pediatric patients with B-cell acute lymphoblastic leukemia. We identified cytotoxic postinfusion cells with identical TCRs to a subset of preinfusion CAR T cells. These effector precursor cells exhibited a unique transcriptional profile compared with other preinfusion cells, corresponding to an unexpected surface phenotype (TIGIT+, CD62Llo, CD27-). Upon stimulation, these cells showed functional superiority and decreased expression of the exhaustion-associated transcription factor TOX. Collectively, these results demonstrate diverse effector potentials within preinfusion CAR T-cell products, which can be exploited for therapeutic applications. Furthermore, we provide an integrative experimental and analytic framework for elucidating the mechanisms underlying effector development in CAR T-cell products.

Significance: Utilizing clonal trajectories to define transcriptional potential, we find a unique signature of CAR T-cell effector precursors present in preinfusion cell products. Functional assessment of cells with this signature indicated early effector potential and resistance to exhaustion, consistent with postinfusion cellular patterns observed in patients. This article is highlighted in the In This Issue feature, p. 2007.


Figures

Figure 1.
Figure 1.
Identification of transcriptional subsets within pre- and postinfusion CAR cells. A, Schematic of clinical trial. For single-cell sequencing and transcriptional profiling, leukocytes were apheresed from 16 pediatric patients undergoing CD19-CAR T-cell therapy. T cells were selected, virally transduced with the CAR-containing lentivirus, and expanded. The autologous CAR T-cell products were infused into 15 of the patients, and blood and bone marrow were drawn at protocol-specific time points to isolate CAR T cells. B, UMAP plot with shared nearest neighbor clustering of 184,791 pre- (GMP) and postinfusion (PI) CAR T cells across all patients, colored by 21 transcriptional clusters. C, UMAP from B colored by sample type (top), inferred CD8+ or CD4+ phenotype using a consensus approach (second from top), inferred cell-cycle phase (second from bottom), or density of overlapping cells (bottom). PI, postinfusion. D, Chart depicting the cluster number as indicated in A, with key genes used to characterize the transcriptional profile of each cluster; the functional groups each cluster was assigned to based on the specific transcriptional profile, the number of cells in each cluster, the percent GMP composition of each cluster, and the percentage of cells inferred to be CD8+ of each cluster. Percentage of cells in a cluster that was CD8+ was inferred using SignacX. Colored bars correspond to each broad functional group (proliferating: slate blue; transitioning: navy blue; early effector: burnt orange; cytotoxic effector: dark yellow; dysfunctional: burgundy; metabolically active: light brown). E, Dot plots showing the relative expression of genes characteristic to relevant cellular processes as listed. Dot size corresponds to the percentage of cells expressing each gene.
Figure 2.
Figure 2.
Expression of effector and dysfunctional genes over time correlates with kinetics of CAR T-cell subsets. A, Relative proportion of functional groups as defined in Fig. 1, aggregated across donors for each preinfusion and postinfusion time point. The number of cells per time point is included in parentheses under each time point label. The six-month time point was excluded due to the limited number of CAR T cells (n = 7, from a single patient). A dashed vertical line indicates the median time point of peak expansion across sequenced patients. B, UMAP of pre- and postinfusion CAR T cells, colored by GMP status or postinfusion time point. Cells from later time points were plotted on top of those from earlier time points. C, Heatmap of average gene expression across CAR T-cell time points, visualizing variation in genes associated with cytotoxic effector function or T-cell dysfunction as indicated. D, Stacked bar plots portraying each transcriptional cluster's relative contribution to the indicated time points, colored by transcriptional cluster. E, Violin plots depicting activity level of select regulons that were significantly different between transcriptional clusters 3 and 8. Asterisks indicate the degree of significance. ****, Padj < 1E−15; ***, Padj < 1E−10 (>1E−15); **, Padj < 1E−5 (>1E−10); *, Padj < 0.05 (>1E−5).
Figure 3. Pseudotime trajectory analysis identifies a subset of dysfunctional postinfusion CAR T cells that arise directly from the GMP product rather than from prolonged antigen exposure. A–B, Monocle pseudotime map depicting trajectory analysis of 3,416 CAR T cells. Downsampling was necessary due to computational limitations. The analysis included 368 cells (the number of all cells at the month 3 time point) from each time point, as well as all 840 cells with TCRs matching known pre- and postinfusion lineages regardless of cluster designation. Pseudotime states were generated based on internal clustering by the pseudotime analysis. A, Cells are colored by pseudotime state. B, Cells are colored by either GMP or postinfusion sample types. C, Dot plot comparing relative expression of CASP8, LAG3, and TOX across pseudotime states, with the percentage of cells expressing a gene encoded by dot size. D, Dot plot comparing relative expression of effector genes (NKG7, GNLY, GZMB, and GZMK) across pseudotime states, with the percentage of cells expressing a gene encoded by dot size.
Figure 3.
Pseudotime trajectory analysis identifies a subset of dysfunctional postinfusion CAR T cells that arise directly from the GMP product rather than from prolonged antigen exposure. A–B, Monocle pseudotime map depicting trajectory analysis of 3,416 CAR T cells. Downsampling was necessary due to computational limitations. The analysis included 368 cells (the number of all cells at the month 3 time point) from each time point, as well as all 840 cells with TCRs matching known pre- and postinfusion lineages regardless of cluster designation. Pseudotime states were generated based on internal clustering by the pseudotime analysis. A, Cells are colored by pseudotime state. B, Cells are colored by either GMP or postinfusion sample types. C, Dot plot comparing relative expression of CASP8, LAG3, and TOX across pseudotime states, with the percentage of cells expressing a gene encoded by dot size. D, Dot plot comparing relative expression of effector genes (NKG7, GNLY, GZMB, and GZMK) across pseudotime states, with the percentage of cells expressing a gene encoded by dot size.
Figure 4.
Figure 4.
Tracking of endogenous TCR over time identifies CAR T-cell lineages and their subsequent fates. A, Alluvial plot of CAR T-cell lineages across the GMP and postinfusion (PI) time points. Lineages were defined using a “one-from-each” approach, where cells that match their most highly expressed (as a stringency filter) α and β chains are designated as lineages (detailed further in Supplementary Fig. S3). Each line corresponds to an individual CAR T-cell lineage. Due to space constraints, only immediately consecutive connections are visualized (e.g., excluding direct connections between GMP and Wk3). Black columns result from the stacking of many clones that are detected in only a single cell at a given time point. B (left), UMAP plot emphasizing CAR T-cell lineages detected across PI time points. Arrows indicate the CD8+ CAR T cells of the same lineage, starting at the earliest PI time point a lineage was detected and ending at the final time point a lineage was detected. Cells without lineages across PI time points are colored gray. All other cells are colored by their postinfusion time point. Colored cells without arrows are in lineages that span GMP to PI time points. B (right), Alluvial plot depicting the cluster assigned to the earliest postinfusion detection of a lineage and the cluster assigned to the latest detection of a lineage. Colors correspond to transcriptional clusters. When lineages span multiple clusters at the same time point, we include both clusters in the plot. C (left), UMAP plot emphasizing CAR T-cell lineages spanning GMP and multiple postinfusion time points. Arrows indicate the CD8+ CAR T cells of the same lineage, starting at the first detection of the lineage in the GMP and ending at the final detection of the lineage. To aid in visualization, only CD8+ GMP lineages observed in more than one postinfusion time point are represented with an arrow. Cells without lineages tracking to the GMP product are colored gray. All other cells are colored according to their GMP status or postinfusion time point. C (right), Alluvial plot depicting the cluster assigned to the lineage in the GMP sample and the cluster assigned to the final detection of the lineage. Colors correspond to transcriptional clusters. When lineages span multiple clusters at the same time point, we include both clusters in the plot. D, Network plot of CAR T-cell lineages. Arrows link cells that share TCRs, directed from earlier to later time points (blue: GMP to PI; red: PI to PI). Dot size indicates the number of cells, dot colors correspond to transcriptional clusters, and arrow width increases as the number of lineages increases. Labels indicate either GMP sample type or the time point followed by the transcriptional cluster number. E, Circos plot visualizing most frequent lineage connections between GMP clusters and PI CD8+ cytotoxic effector clusters ( and 8). Each position on the outer ring represents a cell, and each line represents a lineage. When lineages span multiple GMP or PI clusters, all clusters are plotted. For ease of visualization, lineages between GMP-PI clusters with fewer than 50 total connections are excluded.
Figure 5.
Figure 5.
A subset of GMP CAR T cells is uniquely poised to give rise to cytotoxic effectors. A, Dot plot comparing relative expression of 14 genes differentially expressed between GMP effector precursors (labeled as “precursors”), as defined by αβTCR lineage tracing, and all other CD8+ GMP CAR T cells (labeled as “nonprecursors”). B, Box plot comparing the proportion of GMP to postinfusion lineages that ended up in effector clusters 3 and 8 between responders and nonresponders. C, UMAP based on SCENIC transcriptional factor regulatory network analysis conducted on effector precursors (labeled as “precursors”; red) and a random subset of other CD8+ GMP CAR T cells (labeled as “nonprecursors”; blue). D, Violin plots comparing activity levels of regulons based on SCENIC analysis. Asterisks indicate the degree of significance. ****, Padj < 1E−15; ***, Padj < 1E–10 (>1E−15); **, Padj < 1E−5 (>1E−10); *, Padj < 0.05 (>1E−5). E, AUC of the best performing iteration of an SVM classifier trained on the top 100 differentially expressed genes between GMP effector precursors and all other CD8+ GMP T cells. The single-cell data set was randomly downsampled for 1,000 iterations, with LOOCV in each iteration. F, Flow cytometry data from an aliquot of patient 11's GMP preinfusion product, visualizing CD8+ CAR T cells with the effector precursor surface phenotype (TIGIT+, CD62Llo, and CD27) and the opposite noneffector associated surface phenotype (TIGIT, CD62hi, and CD27hi). G, Bar plot comparing the proportion of bulk β TCRs sequenced that matched those from postinfusion CD8 transcriptional clusters. Differences are represented as log2 fold change for the proportions of TCRs matching each cluster. Colors correspond to the precursor effector signature (red) or the opposing, noneffector signature (blue). Asterisks indicate the degree of significance. ****, Padj < 1E−15; ***, Padj < 1E−10 (>1E−15); **, Padj < 1E−5 (>1E−10); *, Padj < 0.05 (>1E−5); Padj < 0.1 (>0.05). H, Cumulative β clone sizes of postinfusion CAR T cells that share β TCRs with GMP product CAR T cells sorted by the precursor effector phenotype (red) or the opposing, noneffector surface phenotype (blue). The graph represents the proportion of cells (y-axis) cumulatively encompassed by increasing clone sizes.
Figure 6.
Figure 6.
Flow cytometry data validate the transcriptional characterization of CD8+ CAR T cells. A, Box plots comparing the percentage of IFNγ-producing CD8+ CAR T cells (top) and TOX-producing CD8+ CAR T cells (bottom) between effector precursor preinfusion cells (Tigit+, CD62Llo, CD27; red) and preinfusion cells with the opposing surface phenotype (Tigit, CD62Lhi, CD27+; blue) cocultured either with CD19 knockout (KO) tumor (left) or CD19+ tumor (right). Dashed lines link subsets from the same patient and sample. B, Representative flow cytometry data visualizing GzmB-BV421 and GzmK-FITC staining of preinfusion CD8+ CAR T cells (left) stimulated with either CD19+ tumor (red) or CD19 KO tumor (blue) and unstimulated postinfusion CD8+ CAR T cells (right).
Figure 7. Endogenous TCR tracking as a broadly applicable method for CAR T cells. Schematic overview of the experimental approach and analytical pipeline for (i) identifying signatures associated with precursors of potent cytotoxic effectors in CAR GMP products, (ii) evaluating effector potential of CAR GMP products, and (iii) enriching CAR GMP products to maximize therapeutic potential.
Figure 7.
Endogenous TCR tracking as a broadly applicable method for CAR T cells. Schematic overview of the experimental approach and analytic pipeline for (i) identifying signatures associated with precursors of potent cytotoxic effectors in CAR GMP products, (ii) evaluating effector potential of CAR GMP products, and (iii) enriching CAR GMP products to maximize therapeutic potential.

References

    1. Park JH, Rivière I, Gonen M, Wang X, Sénéchal B, Curran KJ, et al. Long-term follow-up of CD19 CAR therapy in acute lymphoblastic leukemia. N Engl J Med 2018;378:449–59. - PMC - PubMed
    1. Davila ML, Riviere I, Wang X, Bartido S, Park J, Curran K, et al. Efficacy and toxicity management of 19-28z CAR T cell therapy in B cell acute lymphoblastic leukemia. Sci Transl Med 2014;6:224ra25. - PMC - PubMed
    1. Maude SL, Frey N, Shaw PA, Aplenc R, Barrett DM, Bunin NJ, et al. Chimeric antigen receptor T cells for sustained remissions in leukemia. N Engl J Med 2014;371:1507–17. - PMC - PubMed
    1. Lee DW, Kochenderfer JN, Stetler-Stevenson M, Cui YK, Delbrook C, Feldman SA, et al. T cells expressing CD19 chimeric antigen receptors for acute lymphoblastic leukaemia in children and young adults: a phase 1 dose-escalation trial. Lancet Lond Engl 2015;385:517–28. - PMC - PubMed
    1. Finney OC, Brakke HM, Rawlings-Rhea S, Hicks R, Doolittle D, Lopez M, et al. CD19 CAR T cell product and disease attributes predict leukemia remission durability. J Clin Invest 2019;129:2123–32. - PMC - PubMed

Publication types

MeSH terms