. 2022 Jul 1;149(13):dev200171.
doi: 10.1242/dev.200171. Epub 2022 Jul 6.

An integrated atlas of human placental development delineates essential regulators of trophoblast stem cells

Affiliations

An integrated atlas of human placental development delineates essential regulators of trophoblast stem cells

Yutong Chen et al. Development. .

Abstract

The trophoblast lineage safeguards fetal development by mediating embryo implantation, immune tolerance, nutritional supply and gas exchange. Human trophoblast stem cells (hTSCs) provide a platform to study lineage specification of placental tissues; however, the regulatory network controlling self-renewal remains elusive. Here, we present a single-cell atlas of human trophoblast development from zygote to mid-gestation together with single-cell profiling of hTSCs. We determine the transcriptional networks of trophoblast lineages in vivo and leverage probabilistic modelling to identify a role for MAPK signalling in trophoblast differentiation. Placenta- and blastoid-derived hTSCs consistently map between late trophectoderm and early cytotrophoblast, in contrast to blastoid-trophoblast, which correspond to trophectoderm. We functionally assess the requirement of the predicted cytotrophoblast network in an siRNA-screen and reveal 15 essential regulators for hTSC self-renewal, including MAZ, NFE2L3, TFAP2C, NR2F2 and CTNNB1. Our human trophoblast atlas provides a powerful analytical resource to delineate trophoblast cell fate acquisition, to elucidate transcription factors required for hTSC self-renewal and to gauge the developmental stage of in vitro cultured cells.

Keywords: Human development; Human trophoblast stem cells; Placenta development; Self-renewal; Trophoblast.


Conflict of interest statement

Competing interests The authors declare no competing or financial interests.

Figures

Fig. 1.
Fig. 1.
A molecular atlas of human trophoblast development to first trimester placenta. (A) PCA for merged single-cell RNA-seq datasets. (B,C) PCA of the combined dataset coloured by original dataset (B) and original labels (C). NL, no label. (D) Normalized read counts for developmentally relevant genes. Box plots show median values (middle bars) and first to third interquartile ranges (boxes); whiskers indicate 1.5× the interquartile ranges; dots indicate outliers. (E) Row normalized read counts of unbiased lineage marker genes. (F-H) Differentially expressed genes from TE versus CTB (F), CTB versus STB (G) and CTB versus EVT (H). (I-K) Enriched KEGG terms for differentially expressed genes between TE and CTB (I), CTB and STB (J) and CTB and EVT (K).
Fig. 2.
Fig. 2.
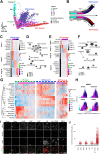
Pseudotime trajectory implicates MAPK signalling in CTB differentiation. (A) Pseudotime trajectory (dashed line) within the GPLVM latent space. (B) Schematic of the trophoblast developmental trajectory. (C) Normalized expression counts of the top 95% of genes along the STB branch. (D) Over-represented KEGG terms of the genes in C. (E) Normalized expression counts of the top 95% of genes along the STB branch. (F) Over-represented KEGG terms of the genes in E. (G) Module scores of key pathways in each cell arranged along the pseudotime trajectory. (H) Scaled transcript counts of the most dynamically expressed genes in the MAPK KEGG term. (I) Immunofluorescence of trophoblast (AP2γ), STB (CGB) and EVT (HLA-G) markers in hTSCs cultured with single activators or inhibitors of indicated signalling pathways. Okae, Okae et al. medium; CHIR, CHIR99021; FK, Forskolin; PD03, PD0325901. (J) Quantification of HLA-G fluorescence in indicated conditions (n=3).
Fig. 3.
Fig. 3.
Okae culture conditions promote TE-CTB transition state in TSCs and blastoids. (A) Normalized read counts for developmentally relevant genes in in vitro cells. (B) PCA projection of in vitro cells onto trophoblast developmental trajectory. (C) Diffusion map of in vitro cells onto the trophoblast developmental trajectory. (D) Scaled correlation score of in vitro cells with trophoblast development lineage subclusters. (E) Relative probability of transcriptomic profile similarity of in vitro cells to trophoblast trajectory. Box plots show median values (middle bars) and first to third interquartile ranges (boxes); whiskers indicate 1.5× the interquartile ranges; dots indicate outliers.
Fig. 4.
Fig. 4.
The CTB transcription factor network regulates hTSC self-renewal. (A) Transcription factor network associated with each trophoblast cell type. Edge width is proportional to Pearson correlation; node size indicates mean expression; colour shows mean pseudotime of the cell cluster. ICM, gene cluster (GC) 6 and GC9 (Fig. S4A); TE, GC1; CTB, GC4; STB, GC3; EVT, GC8. (B) Heatmap of normalized read counts of transcription factors (TFs) in CTB GC. (C) Schematic of CTB TF siRNA clonogenicity assay. (D) Fluorescent imaging of DAPI in hTSC colonies at day 4 in multiple fields. (E) Normalized number of colonies at day 4 with CTB siRNA. Opacity indicates non-significant changes in clonogenicity (n=5). (F) Normalized number of colonies at day 4 with single and dual siRNA treatments (n=5). (G) CTB transcription factor network associated with each trophoblast cell type. Edge width is proportional to the Pearson correlation value; node size is proportional to -log(normalized clonogenicity) (n=5). (H) Immunofluorescence of siGFP, siNFE2L3 and siTFEB for differentiation markers: STB (CGB) and EVT (HLA-G). (I) Quantification of HLA-G and CGB in GFP and knockout conditions (n=3). (J) Graphical summary of results. Significance calculated using a Wilcoxon signed-ranked test (n=5). *P<0.01, **P<0.001. Box plots show median values (middle bars) and first to third interquartile ranges (boxes); whiskers indicate 1.5× the interquartile ranges; dots indicate outliers.

References

    1. Ahmed, S., Rattray, M. and Boukouvalas, A. (2019). GrandPrix: Scaling up the Bayesian GPLVM for single-cell data. Bioinformatics 35, 47-54. 10.1093/bioinformatics/bty533 - DOI - PMC - PubMed
    1. Aibar, S., González-Blas, C. B., Moerman, T., Huynh-Thu, V. A., Imrichova, H., Hulselmans, G., Rambow, F., Marine, J.-C., Geurts, P., Aerts, J.et al. (2017). SCENIC: single-cell regulatory network inference and clustering. Nat. Methods 14, 1083-1086. 10.1038/nmeth.4463 - DOI - PMC - PubMed
    1. Alici-Garipcan, A., Özçimen, B., Süder, I., Ülker, V., Önder, T. T. and Özören, N. (2020). NLRP7 plays a functional role in regulating BMP4 signaling during differentiation of patient-derived trophoblasts. Cell Death Dis. 11, 658. 10.1038/s41419-020-02884-1 - DOI - PMC - PubMed
    1. Angerer, P., Haghverdi, L., Büttner, M., Theis, F. J., Marr, C. and Buettner, F. (2016). Destiny: diffusion maps for large-scale single-cell data in R. Bioinformatics 32, 1241-1243. 10.1093/bioinformatics/btv715 - DOI - PubMed
    1. Apps, R., Murphy, S. P., Fernando, R., Gardner, L., Ahad, T. and Moffett, A. (2009). Human leucocyte antigen (HLA) expression of primary trophoblast cells and placental cell lines, determined using single antigen beads to characterize allotype specificities of anti-HLA antibodies. Immunology 127, 26-39. 10.1111/j.1365-2567.2008.03019.x - DOI - PMC - PubMed

Publication types

Substances