. 2022 Sep 15;28(18):4056-4069.
doi: 10.1158/1078-0432.CCR-22-1102.

Biological Misinterpretation of Transcriptional Signatures in Tumor Samples Can Unknowingly Undermine Mechanistic Understanding and Faithful Alignment with Preclinical Data

Affiliations

Biological Misinterpretation of Transcriptional Signatures in Tumor Samples Can Unknowingly Undermine Mechanistic Understanding and Faithful Alignment with Preclinical Data

Natalie C Fisher et al. Clin Cancer Res. .

Abstract

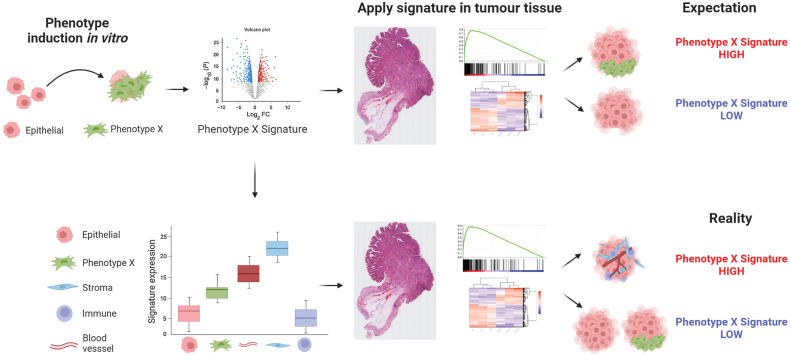
Purpose: Precise mechanism-based gene expression signatures (GES) have been developed in appropriate in vitro and in vivo model systems, to identify important cancer-related signaling processes. However, some GESs originally developed to represent specific disease processes, primarily with an epithelial cell focus, are being applied to heterogeneous tumor samples where the expression of the genes in the signature may no longer be epithelial-specific. Therefore, unknowingly, even small changes in tumor stroma percentage can directly influence GESs, undermining the intended mechanistic signaling.

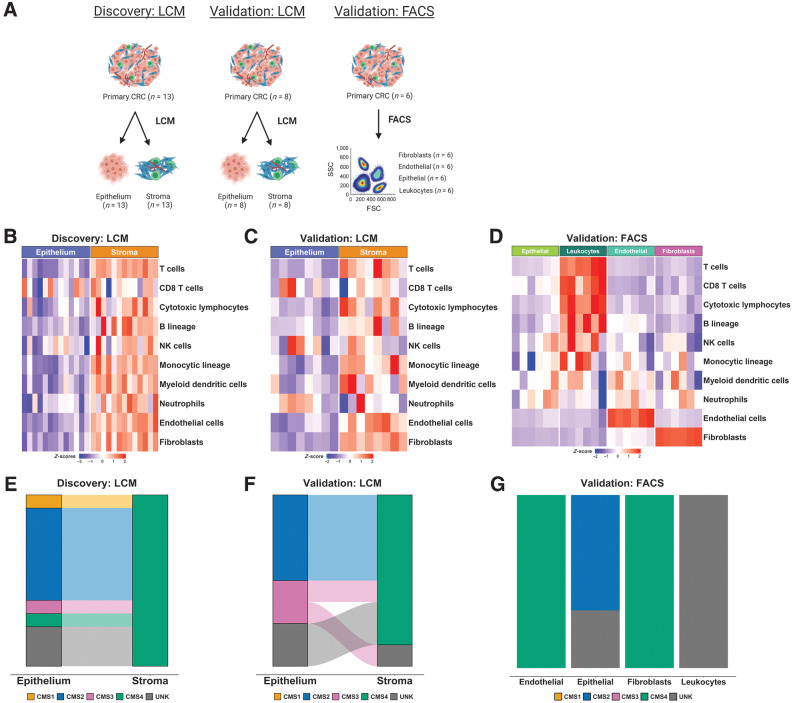
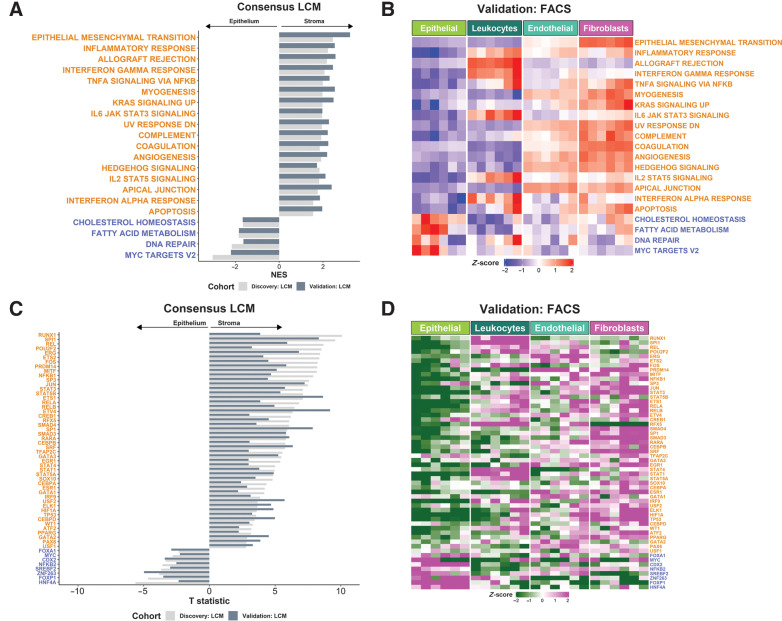
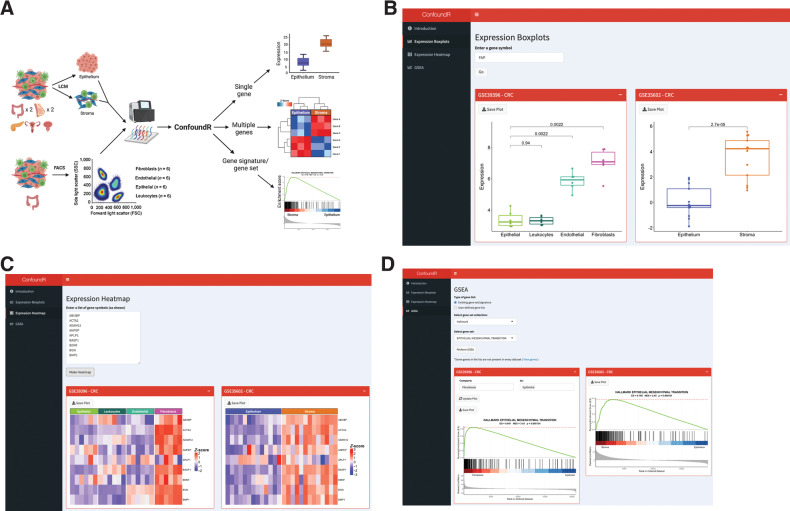
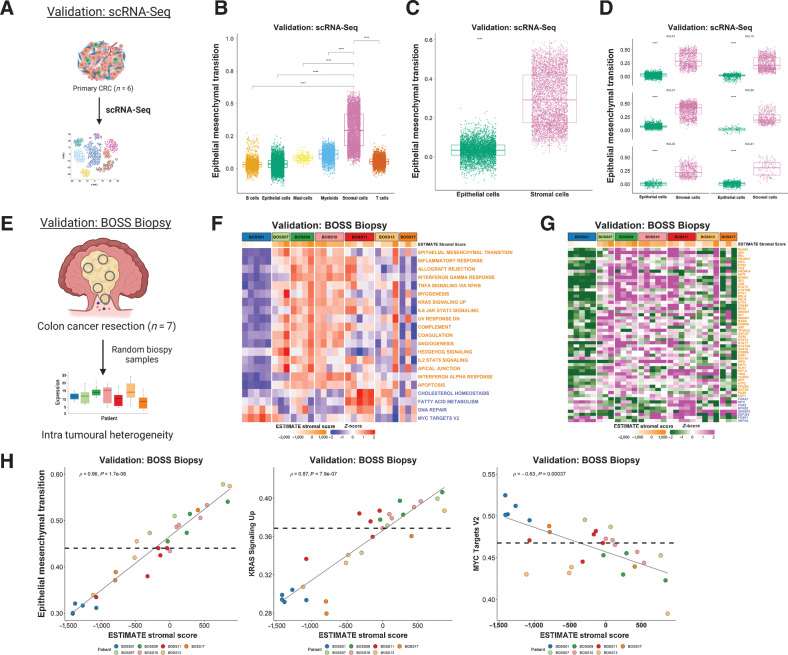
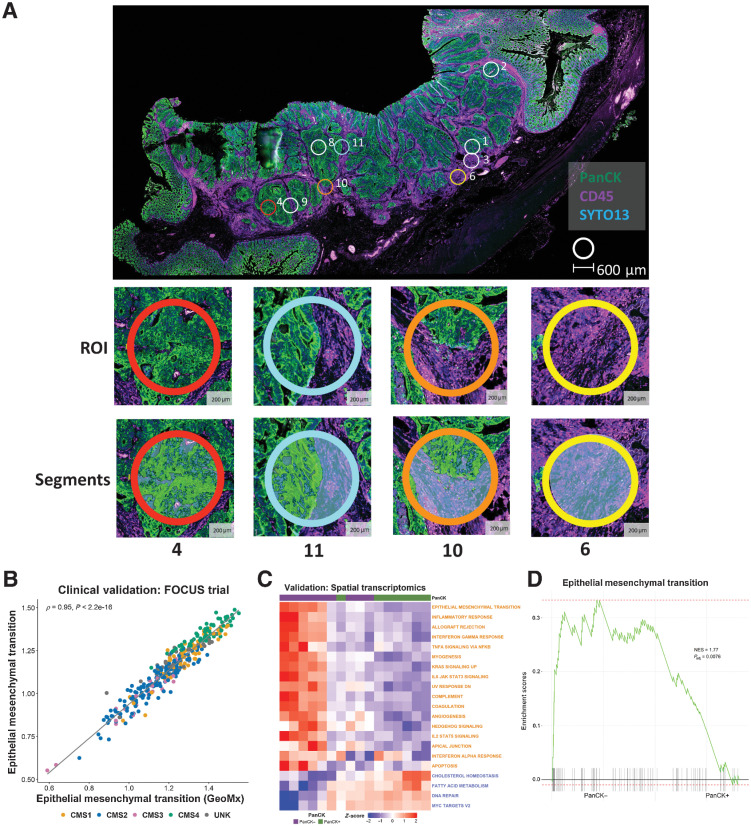
Experimental design: Using colorectal cancer as an exemplar, we deployed numerous orthogonal profiling methodologies, including laser capture microdissection, flow cytometry, bulk and multiregional biopsy clinical samples, single-cell RNA sequencing and finally spatial transcriptomics, to perform a comprehensive assessment of the potential for the most widely used GESs to be influenced, or confounded, by stromal content in tumor tissue. To complement this work, we generated a freely-available resource, ConfoundR; https://confoundr.qub.ac.uk/, that enables users to test the extent of stromal influence on an unlimited number of the genes/signatures simultaneously across colorectal, breast, pancreatic, ovarian and prostate cancer datasets.

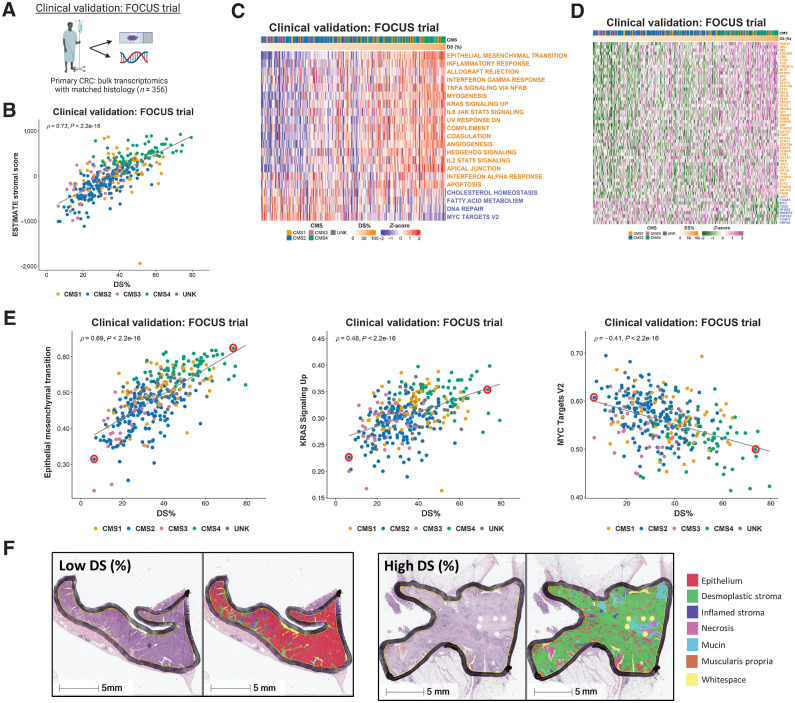
Results: Findings presented here demonstrate the clear potential for misinterpretation of the meaning of GESs, due to widespread stromal influences, which in-turn can undermine faithful alignment between clinical samples and preclinical data/models, particularly cell lines and organoids, or tumor models not fully recapitulating the stromal and immune microenvironment.

Conclusions: Efforts to faithfully align preclinical models of disease using phenotypically-designed GESs must ensure that the signatures themselves remain representative of the same biology when applied to clinical samples.


Figures

Figure 1. Initial characterization of tumor epithelium and stromal datasets. A, Schematic of the segregation strategies in the discovery and validation cohorts, drawn using BioRender. B, Heatmap of MCP-counter scores for the LCM discovery cohort, according to epithelium and stromal regions. C, Heatmap of MCP-counter scores for the LCM validation cohort, according to epithelium and stromal regions. D, Heatmap of MCP-counter scores for the FACS validation cohort. E, CMS classifications (using CMSclassifier) for the matched epithelium and stroma samples in the LCM discovery cohort. F, CMS calls (using CMSclassifier) for the matched epithelium and stroma samples in the laser capture microdissected validation cohort. G, CMS calls (using CMSclassifier) for the four lineages in the FACS validation cohort. SSC, side light scatter; FSC, forward light scatter.
Figure 1.
Initial characterization of tumor epithelium and stromal datasets. A, Schematic of the segregation strategies in the discovery and validation cohorts, drawn using BioRender. B, Heatmap of MCP-counter scores for the LCM discovery cohort, according to epithelium and stromal regions. C, Heatmap of MCP-counter scores for the LCM validation cohort, according to epithelium and stromal regions. D, Heatmap of MCP-counter scores for the FACS validation cohort. E, CMS classifications (using CMSclassifier) for the matched epithelium and stroma samples in the LCM discovery cohort. F, CMS calls (using CMSclassifier) for the matched epithelium and stroma samples in the laser capture microdissected validation cohort. G, CMS calls (using CMSclassifier) for the four lineages in the FACS validation cohort. CMS, consensus molecular subtypes; FSC, forward light scatter; LCM, laser capture microdissection; MCP, microenvironment cell population; SSC, side light scatter.
Figure 2. Stromal influence on widely used transcriptional signatures. A, GSEA of Hallmark gene sets in LCM discovery and validation cohorts. Only gene sets significantly and concordantly enriched in stroma or epithelium in both the discovery and validation cohorts are shown (Padj < 0.02). B, Heatmap of ssGSEA scores for the Hallmark gene sets in the FACS validation cohort samples. Only the gene sets significantly and concordantly enriched in stroma or epithelium in both the LCM discovery and validation cohorts are shown (Padj < 0.02). C, TFs whose activity was significantly and concordantly enriched in stroma or epithelium in both the LCM discovery and validation cohorts (P < 0.05). D, Heatmap of the inferred activity scores for the same TFs in the FACS validation cohort. For all panels in Fig. 2, gene sets/transcription factors with names/symbols colored orange were significantly and consistently enriched in stroma in the LCM discovery and validation cohorts, whereas gene sets/TFs with names/symbols colored blue were consistently and significantly enriched in epithelium in the LCM discovery and validation cohorts (gene sets: Padj < 0.02; TFs: P < 0.05). NES, normalized enrichment scale.
Figure 2.
Stromal influence on widely used transcriptional signatures. A, GSEA of Hallmark gene sets in LCM discovery and validation cohorts. Only gene sets significantly and concordantly enriched in stroma or epithelium in both the discovery and validation cohorts are shown (Padj < 0.02). B, Heatmap of ssGSEA scores for the Hallmark gene sets in the FACS validation cohort samples. Only the gene sets significantly and concordantly enriched in stroma or epithelium in both the LCM discovery and validation cohorts are shown (Padj < 0.02). C, TFs whose activity was significantly and concordantly enriched in stroma or epithelium in both the LCM discovery and validation cohorts (P < 0.05). D, Heatmap of the inferred activity scores for the same TFs in the FACS validation cohort. For all panels in Fig. 2, gene sets/transcription factors with names/symbols colored orange were significantly and consistently enriched in stroma in the LCM discovery and validation cohorts, whereas gene sets/TFs with names/symbols colored blue were consistently and significantly enriched in epithelium in the LCM discovery and validation cohorts (gene sets: Padj < 0.02; TFs: P < 0.05). LCM, laser capture microdissection; NES, normalized enrichment scale; TF, transcription factor.
Figure 3. The ConfoundR resource enables stromal influence estimation in cancer tissue. A, Schematic overview of the cohorts and analyses available within the ConfoundR app, accessible via https://confoundr.qub.ac.uk/. B, Expression Boxplots analysis module of ConfoundR enabling the expression of a single gene to be compared between stroma and epithelium samples in each of the ConfoundR datasets. C, Expression Heatmap analysis module of ConfoundR enabling the expression of multiple genes to be visually compared between stroma and epithelium samples in each of the ConfoundR datasets. D, GSEA analysis module of ConfoundR allowing GSEA of existing gene sets from established gene set collections or custom user defined gene sets to be performed comparing stroma with epithelium in each of the ConfoundR datasets.
Figure 3.
The ConfoundR resource enables stromal influence estimation in cancer tissue. A, Schematic overview of the cohorts and analyses available within the ConfoundR app, accessible via https://confoundr.qub.ac.uk/. B, Expression Boxplots analysis module of ConfoundR enabling the expression of a single gene to be compared between stroma and epithelium samples in each of the ConfoundR datasets. C, Expression Heatmap analysis module of ConfoundR enabling the expression of multiple genes to be visually compared between stroma and epithelium samples in each of the ConfoundR datasets. D, GSEA analysis module of ConfoundR allowing GSEA of existing gene sets from established gene set collections or custom user defined gene sets to be performed comparing stroma with epithelium in each of the ConfoundR datasets.
Figure 4. Application of findings to bulk colorectal cancer tumor data. A, Schematic summary of the clinical validation dataset from the FOCUS clinical trial. B, Scatterplot showing correlation between desmoplastic stroma percentage determined from H&E assessment and ESTIMATE Stromal Score determined by transcriptomic data in the FOCUS clinical trial samples (Spearman rho = 0.73, P < 2.2e-16), colored by CMS calls (CMS1: n = 62; CMS2: n = 155; CMS3: n = 29; CMS4: n = 66; UNK: n = 44). C, Heatmap of ssGSEA scores for the Hallmark gene sets (identified in Fig. 2 as significantly enriched in the stroma/epithelium in the LCM discovery and validation cohorts) for the FOCUS clinical trial samples. Samples ranked in order of DS% from lowest (left) to highest (right). Gene sets with names colored orange were significantly enriched in stroma in the LCM discovery and LCM validation cohorts and gene sets with names colored blue were significantly enriched in epithelium in the LCM discovery and LCM validation cohorts. D, Heatmap of activity scores for TFs (identified as significantly enriched in the stroma/epithelium in the LCM discovery and validation cohorts) for the FOCUS clinical trial samples. Samples are arranged in order of DS% from lowest (left) to highest (right). Gene sets with names colored orange were significantly enriched in stroma in the LCM discovery and LCM validation cohorts and gene sets with names colored blue were significantly enriched in epithelium in the LCM discovery and LCM validation cohorts. E, Scatterplots showing the correlation between desmoplastic stroma percentage determined from H&E and ssGSEA scores for the Epithelial Mesenchymal Transition (left; Spearman rho = 0.69, P < 2.2e-16), KRAS Signaling Up (middle; Spearman rho = 0.48, P < 2.2e-16) and MYC Targets V2 (right; Spearman rho = -0.41, P < 2.2e-16) Hallmark gene sets. We identified two cases representative of low and high DS% in each of these analyses (red circles). F, H&E along with HALO mark-up for the representative low and high desmoplastic stromal percentage samples identified in (E). CRC, colorectal cancer.
Figure 4.
Application of findings to bulk colorectal cancer tumor data. A, Schematic summary of the clinical validation dataset from the FOCUS clinical trial. B, Scatterplot showing correlation between desmoplastic stroma percentage (DS%) determined from H&E assessment and ESTIMATE Stromal Score determined by transcriptomic data in the FOCUS clinical trial samples (Spearman rho = 0.73, P < 2.2e-16), colored by CMS calls (CMS1: n = 62; CMS2: n = 155; CMS3: n = 29; CMS4: n = 66; UNK: n = 44). C, Heatmap of ssGSEA scores for the Hallmark gene sets (identified in Fig. 2 as significantly enriched in the stroma/epithelium in the LCM discovery and validation cohorts) for the FOCUS clinical trial samples. Samples ranked in order of DS% from lowest (left) to highest (right). Gene sets with names colored orange were significantly enriched in stroma in the LCM discovery and LCM validation cohorts and gene sets with names colored blue were significantly enriched in epithelium in the LCM discovery and LCM validation cohorts. D, Heatmap of activity scores for TFs (identified as significantly enriched in the stroma/epithelium in the LCM discovery and validation cohorts) for the FOCUS clinical trial samples. Samples are arranged in order of DS% from lowest (left) to highest (right). Gene sets with names colored orange were significantly enriched in stroma in the LCM discovery and LCM validation cohorts and gene sets with names colored blue were significantly enriched in epithelium in the LCM discovery and LCM validation cohorts. E, Scatterplots showing the correlation between DS% determined from H&E and ssGSEA scores for the Epithelial Mesenchymal Transition (left; Spearman rho = 0.69, P < 2.2e-16), KRAS Signaling Up (middle; Spearman rho = 0.48, P < 2.2e-16) and MYC Targets V2 (right; Spearman rho = -0.41, P < 2.2e-16) Hallmark gene sets. We identified two cases representative of low and high DS% in each of these analyses (red circles). F, H&E along with HALO mark-up for the representative low and high DS% samples identified in (E). CRC, colorectal cancer; LCM, laser capture microdissection.
Figure 5. Single-cell and multi-regional biopsy analyses. A, Schematic of scRNA-seq cohort derived from n = 6 colorectal cancer primary tumors. Boxplots showing ssGSEA scores for the Hallmark Epithelial Mesenchymal Transition gene set across the various cell types (B) and specifically between epithelial and stromal cells (C; from all six colorectal cancer tumors) in the scRNA-seq dataset (P < 2.2 × 10⁻¹⁶; Wilcoxon test). D, Comparison of ssGSEA scores for the Hallmark Epithelial Mesenchymal Transition gene set between epithelial and stromal cells in each primary CRC (n = 6) in the scRNA-seq dataset (all P < 2.2×10⁻¹⁶; Wilcoxon test). Epithelial cells are shown in green and stromal cells in pink. E, Schematic overview of the BOSS Biopsy cohort consisting of colon cancer resections from 7 patients each with up to n = 5 multi-regional biopsy samples. Heatmaps of ssGSEA scores for the Hallmark gene sets (F) and TF activity scores for the BOSS Biopsy samples (G). Samples are grouped according to patient of origin and the ESTIMATE Stromal Score of each biopsy sample is indicated by the ESTIMATE StromalScore bar at the top of the heatmap. Only the gene sets/TFs significantly and concordantly enriched in stroma or epithelium in both the LCM discovery and LCM validation cohorts are shown (from Fig. 2; Padj < 0.02 – Hallmarks; P < 0.05 – TFs). Gene sets/TFs with names/symbols colored orange were significantly enriched in stroma in the LCM discovery and LCM validation cohorts and gene sets/transcription factors with names/symbols colored blue were significantly enriched in epithelium in the LCM discovery and LCM validation cohorts. H, Scatterplots showing correlation between the ESTIMATE StromalScore and ssGSEA scores for the Hallmark Epithelial Mesenchymal Transition (left; Spearman rho = 0.96, P = 1.7e-08), KRAS Signaling Up (middle; Spearman rho = 0.87, P = 7.9e-07) and MYC Targets V2 (right; Spearman rho = -0.63, P = 0.00037) gene sets. Samples are colored by patient of origin. CRC, colorectal cancer.
Figure 5.
Single-cell and multi-regional biopsy analyses. A, Schematic of scRNA-seq cohort derived from n = 6 CRC primary tumors. Boxplots showing ssGSEA scores for the Hallmark Epithelial Mesenchymal Transition gene set across the various cell types (B) and specifically between epithelial and stromal cells (C; from all six colorectal cancer tumors) in the scRNA-seq dataset (P < 2.2 × 10⁻¹⁶; Wilcoxon test). D, Comparison of ssGSEA scores for the Hallmark Epithelial Mesenchymal Transition gene set between epithelial and stromal cells in each primary CRC (n = 6) in the scRNA-seq dataset (all P < 2.2×10⁻¹⁶; Wilcoxon test). Epithelial cells are shown in green and stromal cells in pink. E, Schematic overview of the BOSS Biopsy cohort consisting of colon cancer resections from 7 patients each with up to n = 5 multi-regional biopsy samples. Heatmaps of ssGSEA scores for the Hallmark gene sets (F) and TF activity scores for the BOSS Biopsy samples (G). Samples are grouped according to patient of origin and the ESTIMATE Stromal Score of each biopsy sample is indicated by the ESTIMATE StromalScore bar at the top of the heatmap. Only the gene sets/TFs significantly and concordantly enriched in stroma or epithelium in both the LCM discovery and LCM validation cohorts are shown (from Fig. 2; Padj < 0.02 – Hallmarks; P < 0.05 – TFs). Gene sets/TFs with names/symbols colored orange were significantly enriched in stroma in the LCM discovery and LCM validation cohorts and gene sets/transcription factors with names/symbols colored blue were significantly enriched in epithelium in the LCM discovery and LCM validation cohorts. H, Scatterplots showing correlation between the ESTIMATE StromalScore and ssGSEA scores for the Hallmark Epithelial Mesenchymal Transition (left; Spearman rho = 0.96, P = 1.7e-08), KRAS Signaling Up (middle; Spearman rho = 0.87, P = 7.9e-07) and MYC Targets V2 (right; Spearman rho = −0.63, P = 0.00037) gene sets. Samples are colored by patient of origin. CRC, colorectal cancer.
Figure 6. Spatial transcriptomic confirms the confounding effects of the stroma. A, Whole slide image of colon cancer case selected for spatial transcriptomic analysis. The tissue was stained with PanCK and CD45 with PanCK+ regions (green) identifying epithelium and CD45+ regions (purple) identifying immune components. Small circles indicate the ROIs selected for spatial transcriptomic analysis; ROI 4: high epithelial content, ROI 11: mixed epithelial content, ROI 10 demonstrates a ROI with low epithelial content, ROI 6: no epithelial content. B, Scatterplot showing the correlation between ssGSEA scores for the full Hallmark Epithelial Mesenchymal Transition gene set (n = 200 genes) and the corresponding reduced GeoMx Epithelial Mesenchymal Transition gene set (n = 81 genes) in the FOCUS clinical trial cohort (Spearman rho = 0.95). Samples colored by CMS calls (CMS1: n = 62; CMS2: n = 155; CMS3: n = 29; CMS4: n = 66; UNK: n = 44). C, Heatmap of ssGSEA scores for the Hallmark gene sets for the PanCK+ (epithelium; n = 8) and PanCK- (stroma; n = 11) areas within the regions of interest. Only the Hallmark gene sets identified as significantly and concordantly enriched in stroma or epithelium in both the LCM discovery and LCM validation cohorts are shown (the GeoMx versions of these Hallmark gene sets were used). D, GSEA comparing PanCK- areas (stroma; n = 11) to PanCK+ areas (epithelium; n = 8) for the Hallmark Epithelial Mesenchymal Transition gene set (GeoMx version). NES, normalized enrichment scale.
Figure 6.
Spatial transcriptomic confirms the confounding effects of the stroma. A, Whole slide image of colon cancer case selected for spatial transcriptomic analysis. The tissue was stained with PanCK and CD45 with PanCK+ regions (green) identifying epithelium and CD45+ regions (purple) identifying immune components. Small circles indicate the ROIs selected for spatial transcriptomic analysis; ROI 4: high epithelial content, ROI 11: mixed epithelial content, ROI 10 demonstrates a ROI with low epithelial content, ROI 6: no epithelial content. B, Scatterplot showing the correlation between ssGSEA scores for the full Hallmark Epithelial Mesenchymal Transition gene set (n = 200 genes) and the corresponding reduced GeoMx Epithelial Mesenchymal Transition gene set (n = 81 genes) in the FOCUS clinical trial cohort (Spearman rho = 0.95). Samples colored by CMS calls (CMS1: n = 62; CMS2: n = 155; CMS3: n = 29; CMS4: n = 66; UNK: n = 44). C, Heatmap of ssGSEA scores for the Hallmark gene sets for the PanCK+ (epithelium; n = 8) and PanCK (stroma; n = 11) areas within the regions of interest. Only the Hallmark gene sets identified as significantly and concordantly enriched in stroma or epithelium in both the LCM discovery and LCM validation cohorts are shown (the GeoMx versions of these Hallmark gene sets were used). D, GSEA comparing PanCK areas (stroma; n = 11) to PanCK+ areas (epithelium; n = 8) for the Hallmark Epithelial Mesenchymal Transition gene set (GeoMx version). CMS, consensus molecular subtypes; LCM, laser capture microdissection; NES, normalized enrichment scale; ROI, region of interest.
Figure 7. Summary diagram. Precise gene expression signatures have been developed to accurately reflect phenotypic changes in epithelial-based models, when assessed under tightly controlled in vitro modeling conditions. When these signatures are used to stratify bulk tumor data, there is an expectation that the same signatures can be used to stratify tumors based on the same distinct phenotypes (top). However, if the genes that make up these signatures are expressed at relatively higher levels in nonepithelial lineages, the signatures can become confounded by even small variations in stromal components, stratifying tumors based on stromal content rather than the phenotype they were developed to represent (bottom).
Figure 7.
Summary diagram. Precise gene expression signatures have been developed to accurately reflect phenotypic changes in epithelial-based models, when assessed under tightly controlled in vitro modeling conditions. When these signatures are used to stratify bulk tumor data, there is an expectation that the same signatures can be used to stratify tumors based on the same distinct phenotypes (top). However, if the genes that make up these signatures are expressed at relatively higher levels in nonepithelial lineages, the signatures can become confounded by even small variations in stromal components, stratifying tumors based on stromal content rather than the phenotype they were developed to represent (bottom).

References

    1. Goossens N, Nakagawa S, Sun X, Hoshida Y. Cancer biomarker discovery and validation. Transl Cancer Res 2015;4:256–69. - PMC - PubMed
    1. Cerami E, Gao J, Dogrusoz U, Gross BE, Sumer SO, Aksoy BA, et al. The cBio cancer genomics portal: an open platform for exploring multidimensional cancer genomics data. Cancer Discov 2012;2:401–4. - PMC - PubMed
    1. Isella C, Terrasi A, Bellomo SE, Petti C, Galatola G, Muratore A, et al. Stromal contribution to the colorectal cancer transcriptome. Nat Genet 2015;47:312–9. - PubMed
    1. Isella C, Brundu F, Bellomo SE, Galimi F, Zanella E, Porporato R, et al. Selective analysis of cancer-cell intrinsic transcriptional traits defines novel clinically relevant subtypes of colorectal cancer. Nat Commun 2017;8:15107. - PMC - PubMed
    1. Dunne PD, Alderdice M, O'Reilly PG, Roddy AC, McCorry AMB, Richman S, et al. Cancer-cell intrinsic gene expression signatures overcome intratumoural heterogeneity bias in colorectal cancer patient classification. Nat Commun 2017;8:15657. - PMC - PubMed

Publication types