. 2022 Oct;44(5):2509-2525.
doi: 10.1007/s11357-022-00597-1. Epub 2022 Jul 6.

Brain age estimation reveals older adults' accelerated senescence after traumatic brain injury

Affiliations

Brain age estimation reveals older adults' accelerated senescence after traumatic brain injury

Anar Amgalan et al. Geroscience. 2022 Oct.

Abstract

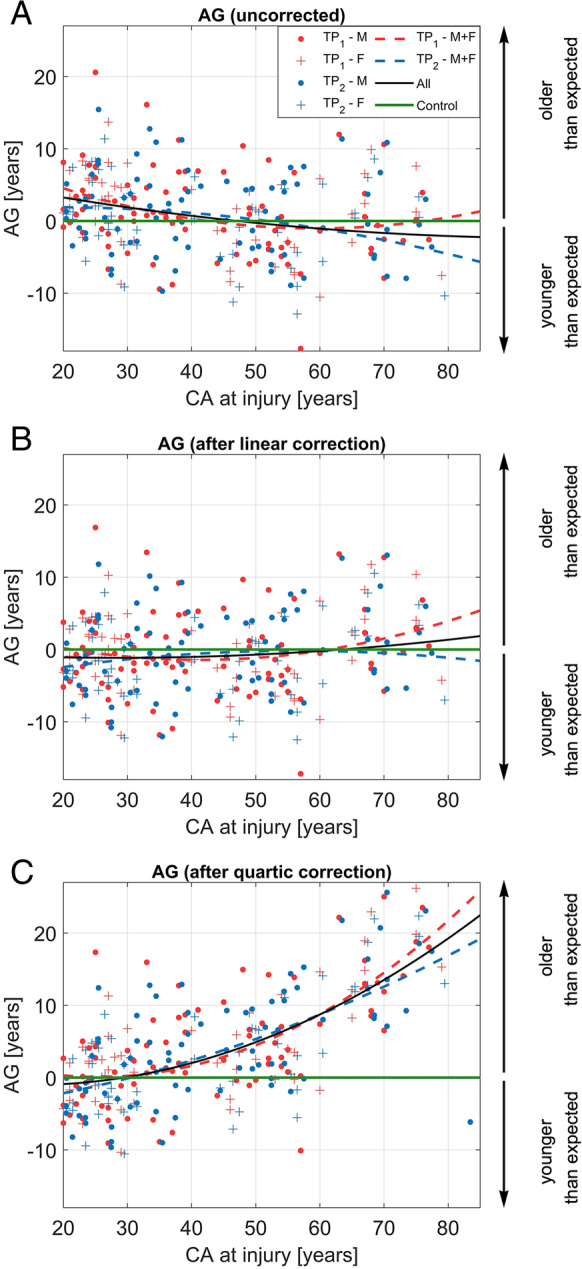
Adults aged 60 and over are most vulnerable to mild traumatic brain injury (mTBI). Nevertheless, the extent to which chronological age (CA) at injury affects TBI-related brain aging is unknown. This study applies Gaussian process regression to T1-weighted magnetic resonance images (MRIs) acquired within [Formula: see text]7 days and again [Formula: see text]6 months after a single mTBI sustained by 133 participants aged 20-83 (CA [Formula: see text] = 42.6 ± 17 years; 51 females). Brain BAs are estimated, modeled, and compared as a function of sex and CA at injury using a statistical model selection procedure. On average, the brains of older adults age by 15.3 ± 6.9 years after mTBI, whereas those of younger adults age only by 1.8 ± 5.6 years, a significant difference (Welch's t32 = - 9.17, p ≃ 9.47 × 10⁻¹¹). For an adult aged [Formula: see text]30 to [Formula: see text]60, the expected amount of TBI-related brain aging is [Formula: see text]3 years greater than in an individual younger by a decade. For an individual over [Formula: see text]60, the respective amount is [Formula: see text]7 years. Despite no significant sex differences in brain aging (Welch's t108 = 0.78, p > 0.78), the statistical test is underpowered. BAs estimated at acute baseline versus chronic follow-up do not differ significantly (t264 = 0.41, p > 0.66, power = 80%), suggesting negligible TBI-related brain aging during the chronic stage of TBI despite accelerated aging during the acute stage. Our results indicate that a single mTBI sustained after age [Formula: see text]60 involves approximately [Formula: see text]10 years of premature and lasting brain aging, which is MRI detectable as early as [Formula: see text]7 days post-injury.

Keywords: Biological age; Chronological age; Machine learning; Magnetic resonance imaging; Neurodegeneration.


Conflict of interest statement

The authors declare no competing interests.

Figures

Fig. 1
Fig. 1
(Color online) AGs for the uncorrected model (A), linear correction (B), and quartic correction (C). AGs are plotted as a function of CA at injury both at the acute and chronic timepoints (TP1 and TP2, respectively). In (A), (B), and (C), second-order polynomials model AG as a function of CA for males (M, circles), females (F, crosses) at TP1 (red data points and trendline), TP2 (blue data points and trendline), and across both TPs (black trendline). In other words, red and blue dashed lines correspond to quadratic polynomial functions whose coefficients were calculated using data from the first (acute baseline) and second (chronic follow-up) timepoints, respectively. The black trace is the polynomial function whose coefficients were calculated using data from both timepoints. The horizontal green line corresponds to the null hypothesis H0:AG = 0, from which older adults’ AGs deviate significantly. Importantly, the second-order polynomial lines in each inset are guides to the eye and are distinct from the polynomials involved for the corrections themselves (see “Methods” section). Vertical arrows indicate the sign of AG (i.e., the direction of the aging effect) and its interpretation in terms of aging trajectory (downward arrow: negative AG, i.e., the participant is younger than expected; upward arrow: positive AG, i.e., the participant is older than expected). AG age gap, CA chronological age, F females, M males, TP timepoint
Fig. 2
Fig. 2
(Grayscale) Comparison of neuroanatomic features across (A) a younger HC male (CA = 24), (B) a younger male participant with TBI (CA = 24 y) imaged at the acute baseline, (C) an older HC female participant (CA = 75 y), and (D) an older female participant with TBI (CA = 75 y) imaged at the acute baseline. The first, second, and third columns correspond to axial, sagittal, and coronal views, respectively. Notable features that assist subject comparison include lateral ventricle size and sulcal depth/width. Comparison of (A) and (B) indicates larger ventricles and sulcal enlargement in the younger participant with TBI (blue arrows show the difference in sulcal enlargement). Whereas comparison of (C) and (D) also illustrates greater brain atrophy after TBI in the OAs, the extent of this phenomenon is clearly greater than in the YAs (red arrows). Comparison of (A) and (C) highlights typical aging-related brain atrophy, whereas comparison of (B) and (D) additionally illustrates TBI-related brain aging, which includes injury-related biological aging
Fig. 3
Fig. 3
(Color online) Boxplots of AGs for each decadal age group in the age range from 20 to 83 for (A) TP1, (B) TP2, and (C) both TPs partitioned into two columns with the left column containing the decadal groupings and the right column containing YA vs. OA. Horizontal red lines indicate the median AG of the respective group. The width of each boxplot notch indicates median AG variability within the respective age group and is computed such that non-overlapping notches between groups indicate significantly different medians at α = 5%. Horizontal blue lines marking the bottom and top edges of each box designate the 25th and 75th percentiles, respectively, of AG within the respective age group. Whiskers extend to values within 1.5 × IQR above or below each box. Red crosses indicate outliers outside 1.5 × IQR. All AGs are bias corrected. Vertical arrows indicate the sign of AG (i.e., the direction of the aging effect) and its interpretation in terms of aging trajectory (downward arrow: negative AG, i.e., the participant is younger than expected; upward arrow: positive AG, i.e., the participant is older than expected). AG age gap, IQR interquartile range, TP timepoint

References

    1. Irimia A, et al. Statistical estimation of physiological brain age as a descriptor of senescence rate during adulthood. Brain Imaging Behav. 2015;9(4):678–689. doi: 10.1007/s11682-014-9321-0. - DOI - PMC - PubMed
    1. Cole JH, et al. Brain age and other bodily 'ages': implications for neuropsychiatry. Mol Psychiatry. 2019;24(2):266–281. doi: 10.1038/s41380-018-0098-1. - DOI - PMC - PubMed
    1. Franke K, Gaser C. Ten years of BrainAGE as a neuroimaging biomarker of brain aging: what insights have we gained? Front Neurol. 2019;10:789. doi: 10.3389/fneur.2019.00789. - DOI - PMC - PubMed
    1. Faden AI, Loane DJ. Chronic neurodegeneration after traumatic brain injury: Alzheimer disease, chronic traumatic encephalopathy, or persistent neuroinflammation? Neurotherapeutics. 2015;12(1):143–150. doi: 10.1007/s13311-014-0319-5. - DOI - PMC - PubMed
    1. Irimia A, et al. Structural and connectomic neuroimaging for the personalized study of longitudinal alterations in cortical shape, thickness and connectivity after traumatic brain injury. J Neurosurg Sci. 2014;58(3):129–144. - PMC - PubMed

Publication types