Multicenter Study
. 2022 Nov;36(11):2101-2112.
doi: 10.1111/jdv.18409. Epub 2022 Jul 22.

Switches between biologics in patients with moderate-to-severe psoriasis: results from the French cohort PSOBIOTEQ

Affiliations
Multicenter Study

Switches between biologics in patients with moderate-to-severe psoriasis: results from the French cohort PSOBIOTEQ

R Curmin et al. J Eur Acad Dermatol Venereol. 2022 Nov.

Abstract

Background: Biologics are the cornerstone of treatment of patients with moderate-to-severe plaque psoriasis and switches between biologics are frequently needed to maintain clinical improvement over time.

Objectives: The main purpose of this study was to describe precisely switches between biologics and how their pattern changed over time with the recent availability of new biologic agents.

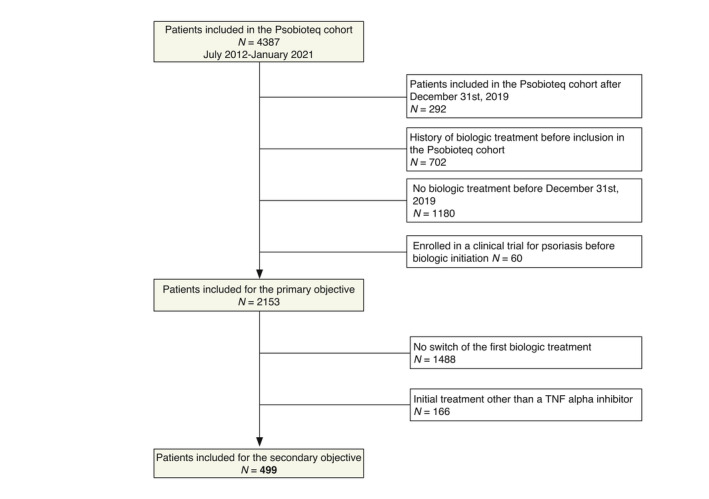
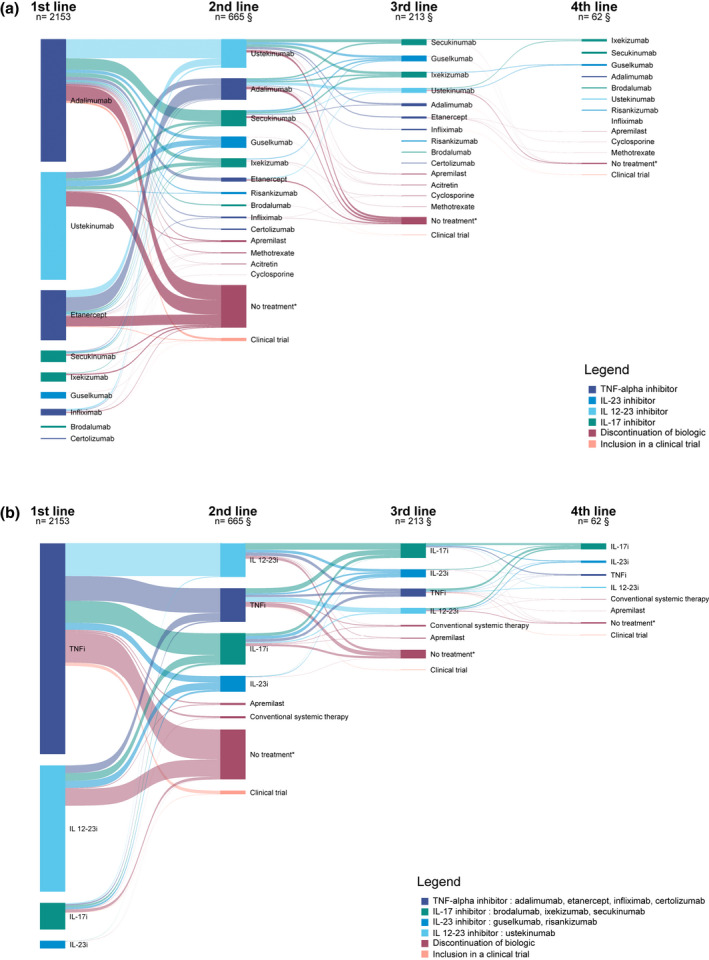
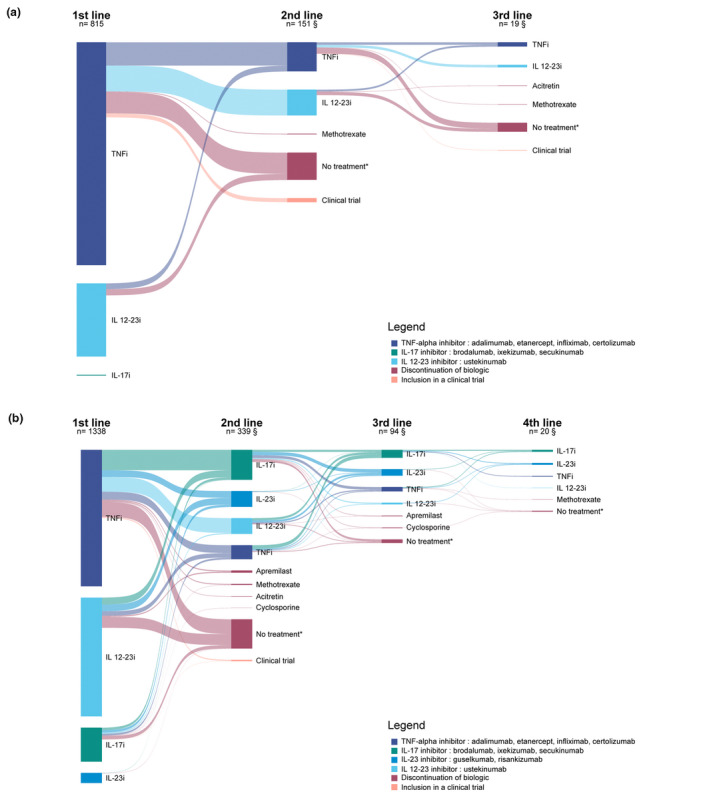
Methods: We included patients receiving a first biologic agent in the Psobioteq multicenter cohort of adults with moderate-to-severe psoriasis receiving systemic treatment. We described switches between biologics with chronograms, Sankey and Sunburst diagrams, assessed cumulative incidence of first switch by competing risks survival analysis and reasons for switching. We assessed the factors associated with the type of switch (intra-class - i.e. within the same therapeutic class - vs. inter-class) in patients switching from a TNF-alpha inhibitor using multivariate logistic regression.

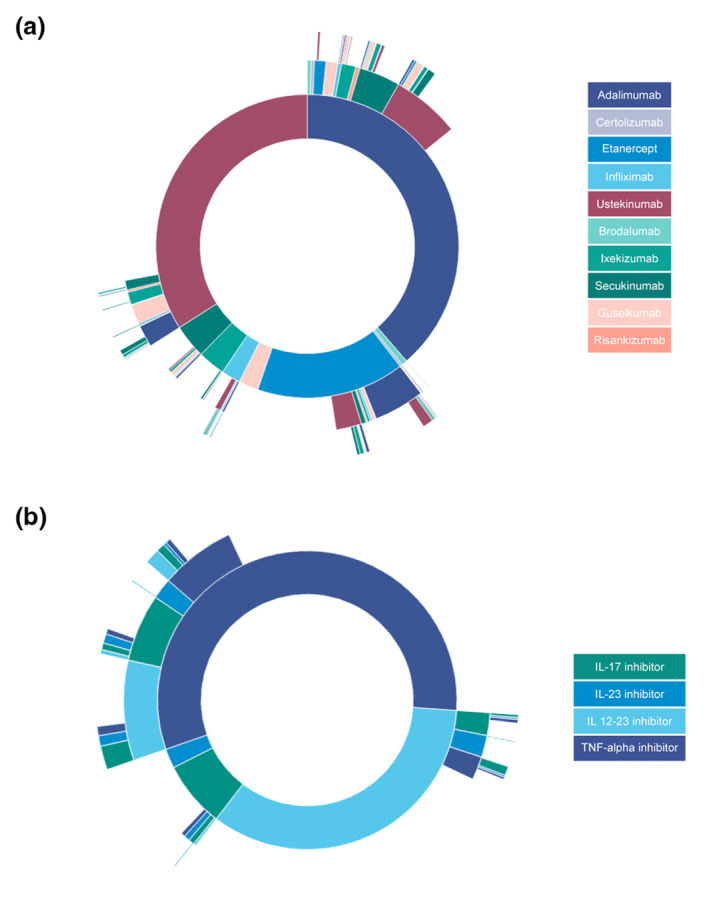
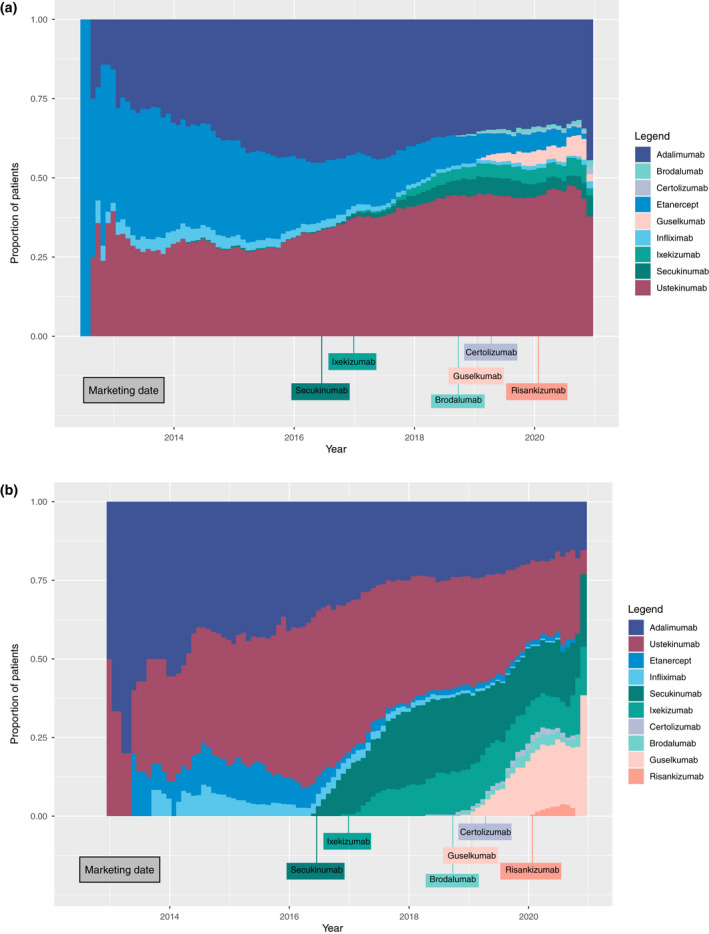
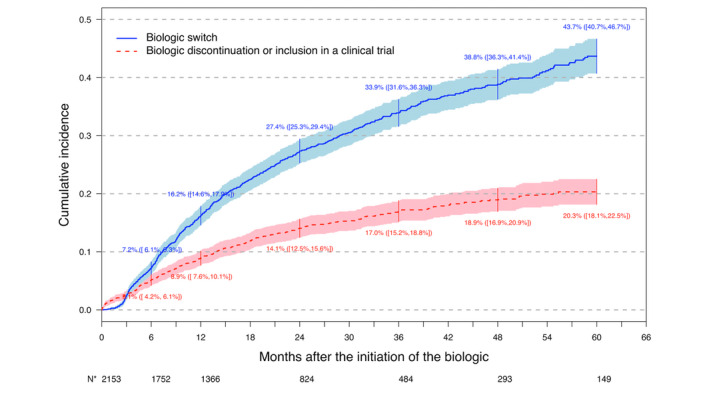
Results: A total of 2153 patients was included. The cumulative incidence of switches from first biologic was 34% at 3 years. Adalimumab and ustekinumab were the most prescribed biologic agents as first and second lines of treatment. The main reason for switching was loss of efficacy (72%), followed by adverse events (11%). Patients receiving a TNF-alpha inhibitor before 2016 mostly switched to ustekinumab, whereas those switching in 2016 or after mostly switched to an IL-17 inhibitor. Patients switching from a first-line TNF-alpha inhibitor before 2016 were more likely to switch to another TNF-alpha inhibitor compared with patients switching since 2018. Patients switching from etanercept were more likely to receive another TNF-alpha inhibitor rather than another therapeutic class of bDMARD compared with patients switching from adalimumab.

Conclusion: This study described the switching patterns of biologic treatments and showed how they changed over time, due to the availability of the new biologic agents primarily IL-17 inhibitors.


Figures

Figure 1
Figure 1
Flow chart of the study population. [Colour figure can be viewed at wileyonlinelibrary.com]
Figure 2
Figure 2
(a) Sankey diagram of switches from a biologic and treatment discontinuation. *No other systemic treatment for 180 days or more. §Number of patients having switched to a biologic. Does not include patients who discontinued their biologic or participated in a clinical trial. Only switches occurring at a frequency of three or more were represented to better visualize the most common switches. Each column represents a biological line of treatment. Treatments are ordered according to frequency, the uppermost biologic in each line of treatment being the most frequent. Following lines of treatment once patients had discontinued their treatment or had been included in a clinical trial were not represented. Tables providing corresponding numbers and percentages are available in the supplementary material (Tables S1–S3). (b) Sankey diagram of switches from a biologic and treatment discontinuation by biologic drug class. *No other systemic treatment for 180 days or more. §Number of patients having switched to a biologic. Does not include patients who discontinued their biologic or participated in a clinical trial. Treatments are ordered according to frequency, the uppermost biologic in each line of treatment being the most frequent. Following lines of treatment once patients had discontinued their treatment or had been included in a clinical trial were not represented. [Colour figure can be viewed at wileyonlinelibrary.com]
Figure 3
Figure 3
(a) Sankey diagram of switches from a biologic and treatment discontinuation from 2012 to 2015. *No other systemic treatment for 180 days or more. §Number of patients having switched to a biologic. Does not include patients who discontinued their biologic or participated in a clinical trial. Treatments are ordered according to frequency, the uppermost biologic in each line of treatment being the most frequent. Following lines of treatment once patients had discontinued their treatment or had been included in a clinical trial were not represented. (b) Sankey diagram of switches from a biologic and treatment discontinuation from 2016 to 2020. *No other systemic treatment for 180 days or more. §Number of patients having switched to a biologic. Does not include patients who discontinued their biologic or participated in a clinical trial. [Colour figure can be viewed at wileyonlinelibrary.com]
Figure 4
Figure 4
(a) Sunburst diagram of biologic switches by biologic agent. Each circle represents a line of treatment, the inner circle being the first line. (b) Sunburst diagram of biologic switches by biologic drug class. Each circle represents a line of treatment, the inner circle being the first line. [Colour figure can be viewed at wileyonlinelibrary.com]
Figure 5
Figure 5
(a) Chronogram of the distribution of first‐line biologics over the study period (July 2012–December 2020). (b) Chronogram of the distribution of second‐line biologics over the study period (July 2012–December 2020). [Colour figure can be viewed at wileyonlinelibrary.com]
Figure 6
Figure 6
Cumulative incidence of first biologic switch with competing risks of biologic discontinuation or inclusion in a clinical trial. *Number of patients free from any event. [Colour figure can be viewed at wileyonlinelibrary.com]

References

    1. Parisi R, Iskandar IYK, Kontopantelis E et al. National, regional, and worldwide epidemiology of psoriasis: systematic analysis and modelling study. BMJ 2020; 28: m1590. - PMC - PubMed
    1. Richard MA, Corgibet F, Beylot‐Barry M et al. Sex‐ and age‐adjusted prevalence estimates of five chronic inflammatory skin diseases in France: results of the « OBJECTIFS PEAU » study. J Eur Acad Dermatol Venereol JEADV 2018; 32: 1967–1971. - PubMed
    1. Di Meglio P, Villanova F, Nestle FO. Psoriasis. Cold Spring Harb Perspect Med 2014; 4(8): a015354. - PMC - PubMed
    1. Amatore F, Villani A‐P, Tauber M, Viguier M, Guillot B. Psoriasis research Group of the French Society of dermatology (Groupe de Recherche Sur le psoriasis de la Société Française de Dermatologie). French guidelines on the use of systemic treatments for moderate‐to‐severe psoriasis in adults. J Eur Acad Dermatol Venereol JEADV. 2019; 33: 464–483. - PMC - PubMed
    1. Özkur E, Kıvanç Altunay İ, Oğuz Topal İ et al. Switching biologics in the treatment of psoriasis: a multicenter experience. Dermatol Basel Switz 2021; 237: 22–30. - PubMed

Publication types