. 2022 Jul 5;40(1):111050.
doi: 10.1016/j.celrep.2022.111050.

A single-cell analysis of thymopoiesis and thymic iNKT cell development in pigs

Affiliations

A single-cell analysis of thymopoiesis and thymic iNKT cell development in pigs

Weihong Gu et al. Cell Rep. .

Abstract

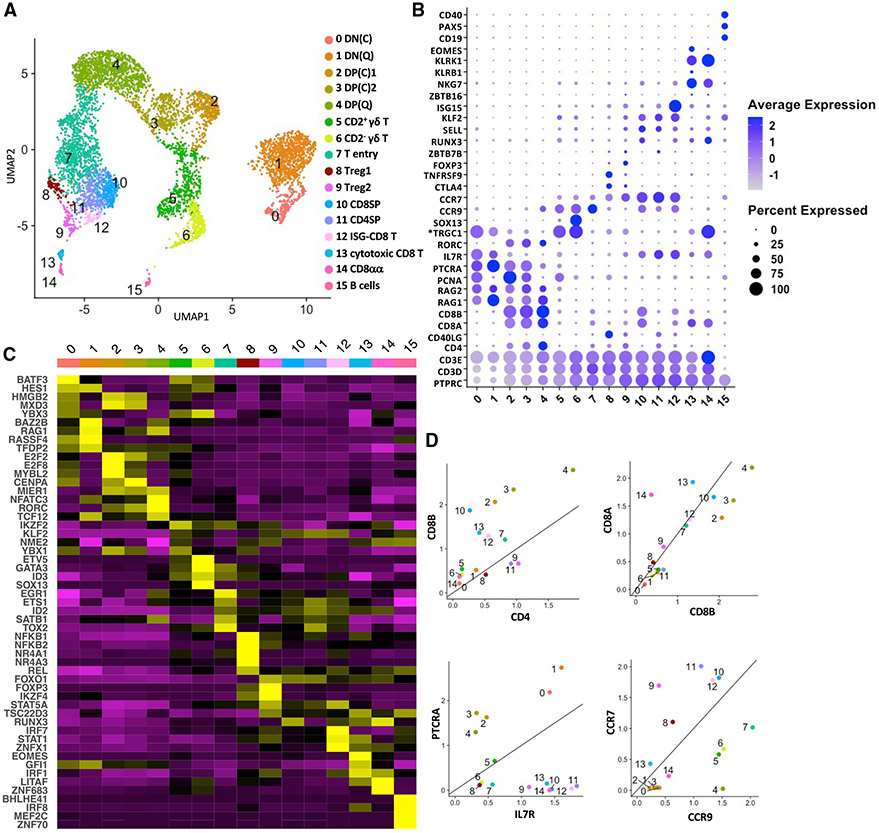
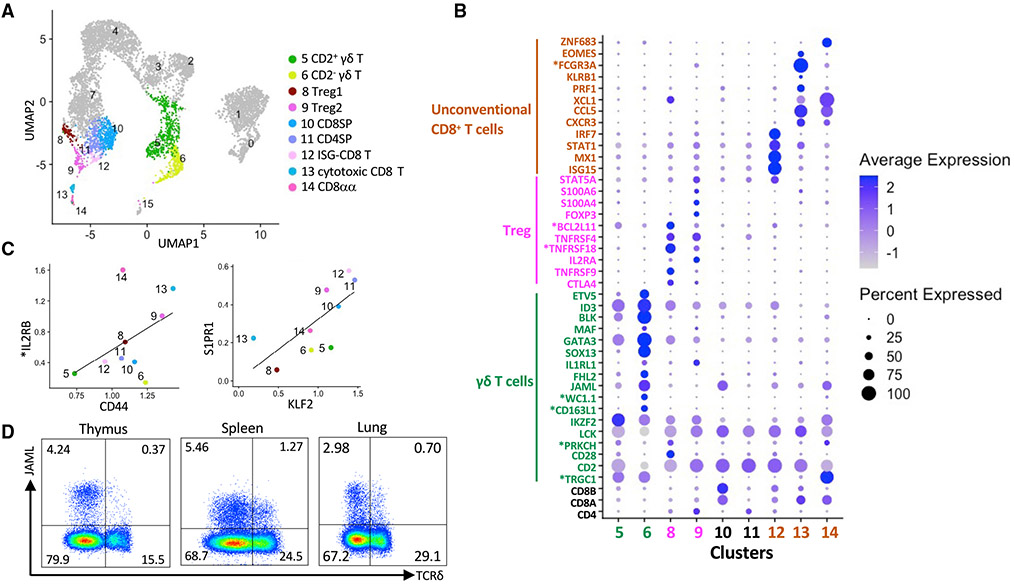
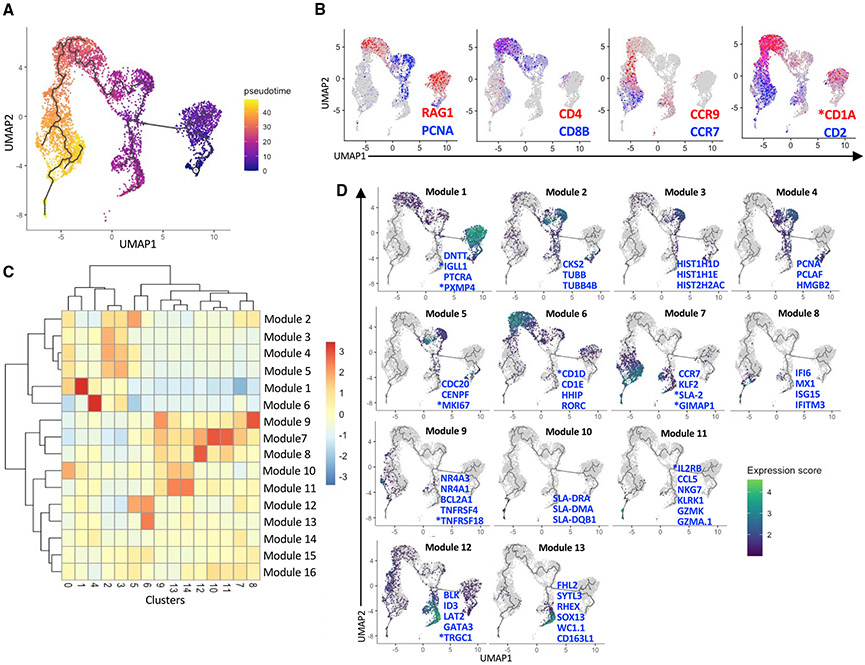
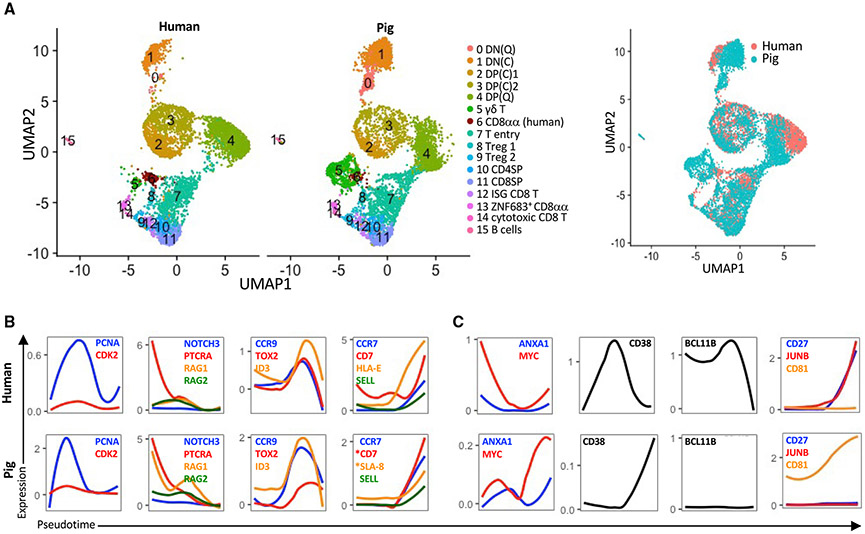
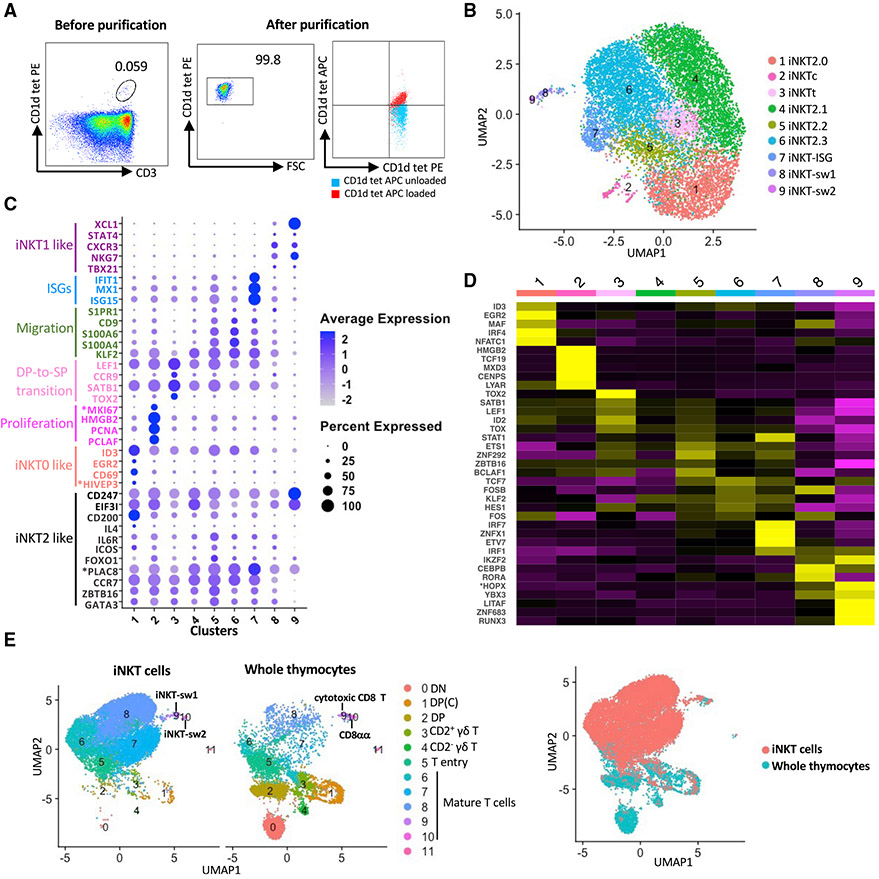
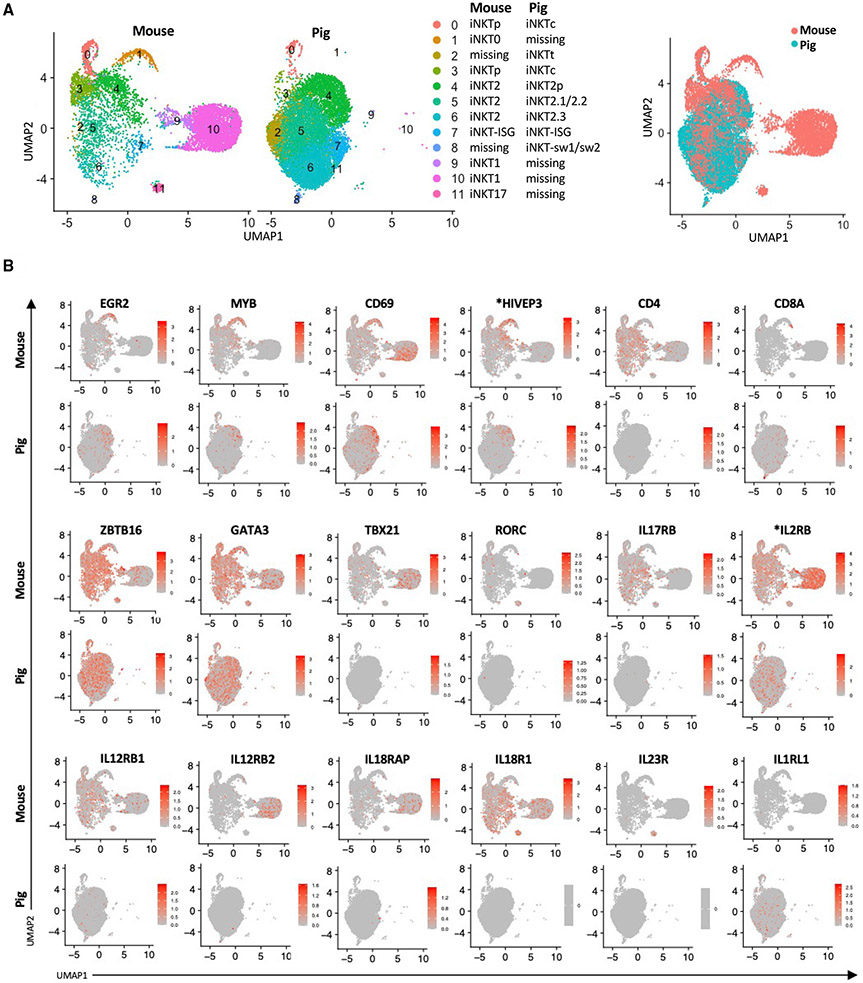
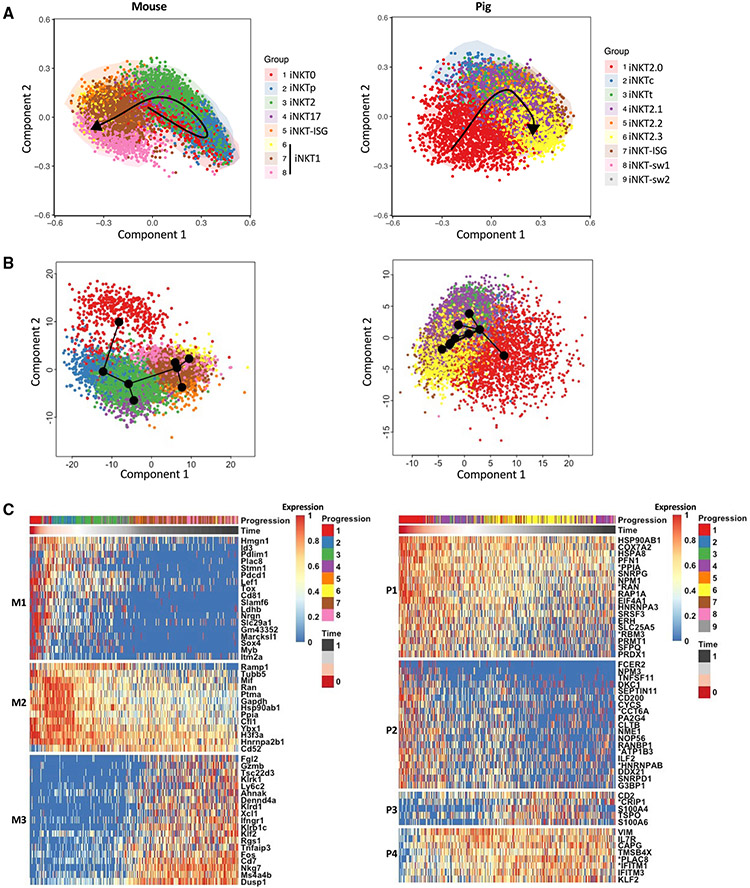
Many aspects of the porcine immune system remain poorly characterized, which poses a barrier to improving swine health and utilizing pigs as preclinical models. Here, we employ single-cell RNA sequencing (scRNA-seq) to create a cell atlas of the early-adolescent pig thymus. Our data show conserved features as well as species-specific differences in cell states and cell types compared with human thymocytes. We also describe several unconventional T cell types with gene expression profiles associated with innate effector functions. This includes a cell census of more than 11,000 differentiating invariant natural killer T (iNKT) cells, which reveals that the functional diversity of pig iNKT cells differs substantially from the iNKT0/1/2/17 subset differentiation paradigm established in mice. Our data characterize key differentiation events in porcine thymopoiesis and iNKT cell maturation and provide important insights into pig T cell development.

Keywords: CP: Immunology; invariant natural killer T cell; porcine; single cell transcriptomics; thymopoiesis.


Conflict of interest statement

Declaration of interests The authors declare no competing interests.

Figures

Figure 1.
Figure 1.. Single-cell transcriptomics analysis of the cellular composition of the pig thymus
(A) Uniform manifold approximation and projection (UMAP) visualization of pig thymus cell types, colored by cell clusters. Clusters were identified using the graph-based Louvain algorithm at a resolution of 0.5. (B)Dot plot showing the Z-scored mean expression of marker genes that were used to designate cell types to cell clusters. The color intensity represents average expression of each marker gene in each cluster. The dot size indicates the proportion of cells expressing each marker gene. Genes with cluster-specific increases in expression are presented in Table S2. (C) Heatmap showing row-scaled mean expression of the five highest differentially expressed transcription factors in each cluster. (D) Scatterplots showing the ratio of various lineage marker genes for each thymocyte cluster (excluding B cells). Asterisks indicate non-annotated genes (described in Table S13).
Figure 2.
Figure 2.. Characterization of unconventional T cells
(A) UMAP visualization of post-committed thymocyte populations. (B) Dot plot showing Z-scored mean expression of selected marker genes in clusters from (A). (C) Scatterplots comparing the characteristics of mature T cells based on the ratio of genes associated with memory T cells (left panel) and thymic emigration (right panel). (D) Representative flow cytometry plots showing JAML expression on thymic, splenic, and lung γδ T cells. Cells were gated on live CD3+ lymphocytes. Asterisks indicate non-annotated genes (described in Table S13).
Figure 3.
Figure 3.. Pseudotemporal analysis of pig thymocyte development
(A) Pseudotime trajectory created by Monocle 3 using clusters 0–14 from Figure 1A. (B) The same UMAP plot showing classical stage-specific markers of thymocyte development. (C) Heatmap of 16 gene modules whose expression varied across pseudotime between clusters. (D) UMAP plots showing the expression profiles of select genes from modules 1–13. See Table S4 for a complete list of module genes. Asterisks indicate non-annotated genes (described in Table S13)
Figure 4.
Figure 4.. Integrative analysis of human and pig thymocytes
(A) UMAP showing an integrative analysis of human CD34 thymocytes and pig thymocytes using a canonical correlation analysis to identify shared genes between datasets. (B and C) Transcription factor and lineage genes with conserved (B) and divergent (C) transcription profiles between pigs and humans. A public dataset containing human thymus samples was used (Le et al., 2020). Also see Figure S3. Asterisks indicate non-annotated genes (described in Table S13).
Figure 5.
Figure 5.. scRNA-seq analysis of porcine thymic iNKT cells
(A) Flow cytometry showing thymic phycoerythrin (PE)-conjugated mouse (m)CD1d tetramer+ cells before (left panel) and after (center panel) isolation with magnetic beads and FACS. Purity was confirmed by co-staining with allophycocyanin (APC)-conjugated PBS57-loaded or unloaded mCD1d tetramers (right panel). (B) UMAP visualization of iNKT thymocyte clusters identified using the graph-based Louvain algorithm at a resolution of 0.5. (C) Dot plot showing the Z-scored mean expression of selected genes encoding key transcription factors and thymocyte differentiation markers for each cluster. (D) Heatmap showing row-scaled mean expression of the five highest differentially expressed transcription factors per cluster. (E) Integrative analysis of iNKT cells and whole thymocytes (excluding B cells) from the same pigs. Asterisks indicate non-annotated genes (described in Table S13).
Figure 6.
Figure 6.. Integrative analysis of pig and mouse thymic iNKT cells
(A) UMAP plots showing the integrative data analyses of thymic iNKT cells from pig and mouse. A public dataset containing thymic iNKT cells isolated from 8- to 9-weeks old C57BL6/J mice was used (Harsha Krovi et al., 2020). Overlapping clusters are in the same figure legend row. Cell clusters that are absent in one species are annotated as “missing.” (B) Expression of 18 genes typically used to distinguish the major subsets of mouse iNKT cells. Asterisks indicate non-annotated genes (described in Table S13).
Figure 7.
Figure 7.. Unsupervised analysis of mouse and pig iNKT cell differentiation
(A and B) Mouse and pig iNKT cells were ordered along their respective differentiation trajectories via unsupervised SCORPIUS (A) and Slingshot (B) analyses. (C) The top 50 most important mouse (left panel) and pig (right panel) genes with respect to the inferred trajectory were, respectively, clustered into three (M1–M3) and four (P1–P4) gene modules by SCORPIUS. Normalized expression values are scaled from 0 to 1 using the scale_quantile function of SCORPIUS with default parameters.

References

    1. Aliahmad P, Seksenyan A, and Kaye J (2012). The many roles of TOX in the immune system. Curr. Opin. Immunol 24, 173–177. 10.1016/j.coi.2011.12.001. - DOI - PMC - PubMed
    1. Allende ML, Dreier JL, Mandala S, and Proia RL (2004). Expression of the sphingosine 1-phosphate receptor, S1P1, on T-cells controls thymic emigration. J. Biol. Chem 279, 15396–15401. 10.1074/jbc.m314291200. - DOI - PubMed
    1. Artiaga BL, Whitener RL, Staples CR, and Driver JP (2014). Adjuvant effects of therapeutic glycolipids administered to a cohort of NKT cell-diverse pigs. Vet. Immunol. Immunopathol 162, 1–13. 10.1016/j.vetimm.2014.09.006. - DOI - PubMed
    1. Baev DV, Peng XH, Song L, Barnhart JR, Crooks GM, Weinberg KI, and Metelitsa LS (2004). Distinct homeostatic requirements of CD4+ and CD4-subsets of Vα24-invariant natural killer T cells in humans. Blood 104, 4150–4156. 10.1182/blood-2004-04-1629. - DOI - PubMed
    1. Baranek T, Lebrigand K, de Amat Herbozo C, Gonzalez L, Bogard G, Dietrich C, Magnone V, Boisseau C, Jouan Y, Trottein F, et al. (2020). High dimensional single-cell analysis reveals iNKT cell developmental trajectories and effector fate decision. Cell Rep. 32, 108116. 10.1016/j.celrep.2020.108116. - DOI - PubMed

Publication types

LinkOut - more resources