. 2022 Jul 5;40(1):111042.
doi: 10.1016/j.celrep.2022.111042.

Hippocampal-evoked inhibition of cholinergic interneurons in the nucleus accumbens

Affiliations

Hippocampal-evoked inhibition of cholinergic interneurons in the nucleus accumbens

Corey Baimel et al. Cell Rep. .

Abstract

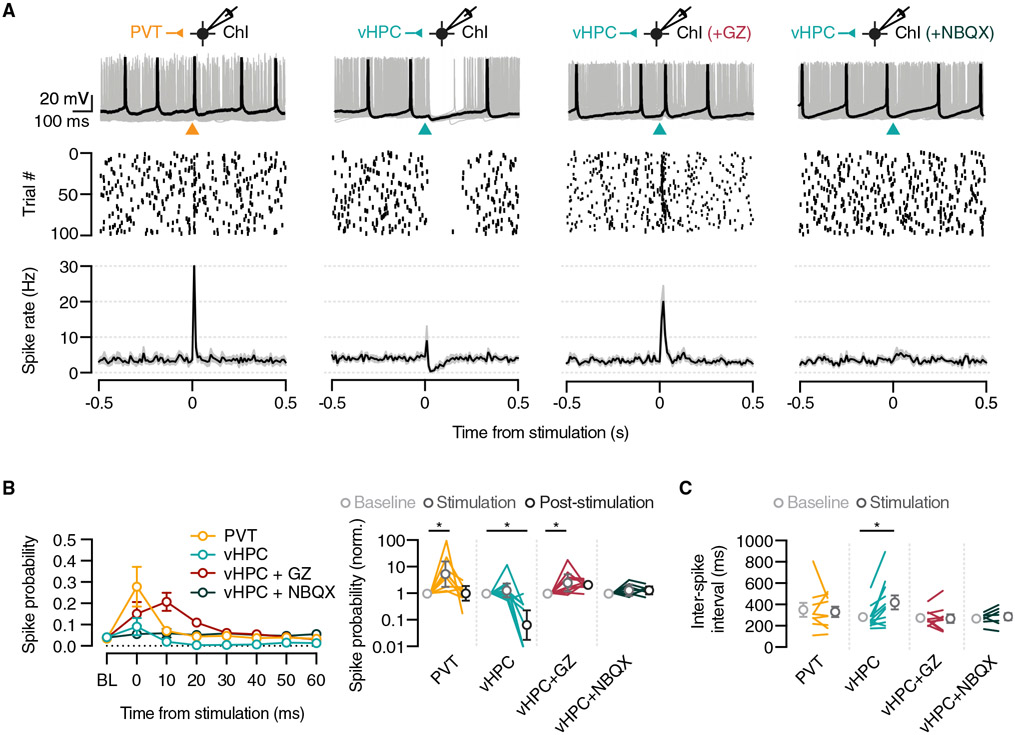
Cholinergic interneurons (ChIs) in the nucleus accumbens (NAc) play a central role in motivated behaviors and associated disorders. However, while the activation of ChIs has been well studied in the dorsal striatum, little is known about how they are engaged in the NAc. Here, we find that the ventral hippocampus (vHPC) and the paraventricular nucleus of the thalamus (PVT) are the main excitatory inputs to ChIs in the NAc medial shell. While the PVT activates ChIs, the vHPC evokes a pronounced pause in firing through prominent feedforward inhibition. In contrast to the dorsal striatum, this inhibition reflects strong connections onto ChIs from local parvalbumin interneurons. Our results reveal the mechanisms by which different long-range inputs engage ChIs, highlighting fundamental differences in local connectivity across the striatum.

Keywords: CP: Neuroscience; cholinergic interneuron; hippocampus; inhibition; nucleus accumbens; thalamus.


Conflict of interest statement

Declaration of interests The authors declare no competing interests.

Figures

Figure 1.
Figure 1.. ChIs receive excitatory inputs from the PVT and vHPC
(A) Left: schematic and protocol for monosynaptic rabies tracing in ChAT-Cre mice. Right: example image of starter cells (white arrows) and local input neurons (green) in the NAcMS. (B) Example images of presynaptic neurons in the PVT and vHPC, where boxed regions are expanded. (C) Summary of the distribution of non-local input neurons throughout the brain (n = 5 mice). OFC, orbitofrontal cortex; mPFC, medial prefrontal cortex; AIC, agranular insular cortex: Other ctx, other cortex; Olf, olfactory areas, HPC, hippocampal formation, Amyg, amygdala, ATN, anterior dorsal thalamus; ILM, intralaminar dorsal thalamus; MED, medial dorsal thalamus; MTN, midline dorsal thalamus, Other thal, other thalamic nuclei; PVZ, periventricular zone of hypothalamus; PVR, periventricular region of hypothalamus; MEZ, medial hypothalamus; LZ, lateral hypothalamus; Other hypo, other hypothalamus. (D) Left: example image showing distribution of ChIs in the NAcMS of ChAT-EGFP mice. Middle: example of a ChI in the NAcMS. Right: physiological responses of ChIs to brief current injections and summary of firing (F) versus current (I) curves, showing ChIs can be readily driven to fire (n = 9 cells/3 mice). (E) Injection schematic and examples of axon labeling in the NAcMS for injections of AAV-ChR2 in the PVT (orange) or the vHPC (teal) of ChAT-EGFP mice. (F) Both PVT (left) and vHPC (right) make monosynaptic excitatory connections onto ChIs. Voltage-clamp recordings of ChIs in the presence of TTX + 4-AP reveal light-evoked EPSCs at −60 mV but not IPSCs at +20 mV (PVT: n = 7 cells/4 mice; vHPC: n = 7 cells/3 mice). (G) Summary of EPSC and IPSC amplitudes for PVT (orange) and vHPC (teal) terminal stimulation, where lines indicate individual neurons. Box and whisker plots represent median and minimum to maximum. Average traces, current amplitude data, and F-I curve are presented as mean ± SEM. *p < 0.05. See also Figure S1.
Figure 2.
Figure 2.. Contrasting impact of the PVT and vHPC on Chi firing
Top: example current-clamp recording of ChIs in response to PVT (orange) (n = 8 cells/6 mice), vHPC (teal) (n = 11 cells/9 mice), vHPC + gabazine (GZ) (red) (n = 7 cells/3 mice), and vHPC + NBQX (dark green) (n = 7 cells/3 mice) stimulation. Middle: raster plot of spike timing. Bottom: summary of spike rate across time. (B) Left: summary of effect of stimulation on spike probability (10 ms bins) for each recording condition. Right: summary of normalized spike probability relative to the pre-stimulus baseline (BL) (note log axis). Stimulation refers to the time from 0–10 ms and post-stimulation from 10–60 ms after optical stimulation. (C) Summary of effect of light stimulation on first inter-spike interval. Average spike rate, spike probability, and inter-spike interval are presented as mean ± SEM. Normalized spike probability data are presented as geometric mean with 95% confidence interval (CI) on a logarithmic axis. *p < 0.05. See also Figure S2.
Figure 3.
Figure 3.. vHPC and PVT differentially recruit local inhibition
(A) Left: PVT-evoked EPSCs and IPSCs in ChIs. Right: summary of absolute amplitudes of PVT-evoked responses, where lines indicate individual neurons (n = 7 cells/4 mice). (B) Similar to (A), showing prominent vHPC-evoked FFI (n = 9 cells/7 mice). (C) Similar to (B), showing inhibition is blocked when gabazine (GZ) (n = 8 cells/5 mice) or NBQX (n = 7 cells/3 mice) are included in the bath. (D) Left: schematic of injections of DIO-RFP in the NAcMS (pink) and AAV-ChR2 in the vHPC (teal) of a PV-2A-Cre × ChAT-eGFP mouse. Middle: example image of the NAcMS illustrating PV+ interneurons (pink) and ChI labeling (green). Right: representative recordings for vHPC-evoked firing of PV+ interneurons (pink) in current clamp and IPSCs in a neighboring ChI (black) in voltage clamp. Firing and IPSCs were assessed at multiple light intensities, with relative intensity shown by the transition from light to dark colors (n = 6 cells/3 mice). (E–F) Similar to (D) for D1-tdTomato × ChAT-eGFP mice (n = 6 cells/3 mice) (E) and SOM-Cre × ChAT-eGFP mice (n = 5 cells/3 mice) (F). (G) Summary of evoked spike probabilities in PV+ (pink), D1+ (red), and SOM+ (purple) neurons relative to IPSC amplitude in ChIs (left) and binned by IPSC amplitude (right). Average traces are presented as mean ± SEM (A–C). For (D)–(F), example paired current- and voltage-clamp recordings are presented. Amplitude (A–C) and spike probability data (G) are presented as mean ± SEM. *p < 0.05. See also Figure S3.
Figure 4.
Figure 4.. vHPC recruits PV+ interneurons to drive FFI onto ChIs
(A) Schematic of injections of DIO-ST-ChroME in the DMS (top) or NAcMS (bottom) of PV-2A-Cre × ChAT-eGFP mice. To assess synaptic connectivity in the local network, sequential-paired voltage-clamp recordings from a Chi and nearby MSN were made. (B) Left: average PV+-evoked IPSCs in ChIs (black) or MSNs (grey) in the DMS. Right: summary of IPSC amplitudes in ChIs and MSNs, where lines represent individual pairs of neurons (n = 8 pairs/4 mice). (C) Similar to (B) but for recordings in the NAcMS (n = 8 pairs/3 mice). (D) Summary of ChI/MSN ratio for PV+-evoked IPSCs in the DMS and NAcMS. (E) Top: schematic of recording condition and example current-clamp recording of ChIs in response to PV+ interneuron stimulation in the NAcMS. Middle: raster plot of spike timing. Bottom: summary of spike rate across time (n = 7 cells/3 mice). (F) Top: summary of effect of PV+ stimulation on spike probability. Bottom: summary of effect of PV+ stimulation on inter-spike interval. (G) Left: schematic of injections of AAV-DIO-ArchT in the NAcMS (pink) and AAV-ChR2 in the vHPC (teal) of PV-2A-Cre × ChAT-eGFP mice. Middle: example recording showing that activating ArchT with 590 nm light suppresses vHPC-evoked firing of PV+ interneurons. Right: summary of reduction in spike probability at different light intensities (n = 8 cells/4 mice). (H) Left: schematic of recording conditions. Middle: average PV+-evoked IPSC amplitudes in ChIs for ChR2 alone (black) and ChR2+ArchT (pink) trials. Right: summary of ArchT-induced reduction in IPSC amplitude (n = 9 cells/4 mice). Average traces are presented as mean ± SEM (B, C, and H). For (E) and (G), example current-clamp recordings are presented. Summary data are presented as mean ± SEM. Ratio data (D) are presented as geometric mean with 95% CI on a logarithmic axis. *p < 0.05. See also Figure S4.

References

    1. Ade KK, Wan Y, Chen M, Gloss B, and Calakos N (2011). An improved BAC transgenic fluorescent reporter line for sensitive and specific identification of striatonigral medium spiny neurons. Front. Syst. Neurosci 5, 32. 10.3389/fnsys.2011.00032. - DOI - PMC - PubMed
    1. Al-Hasani R, Gowrishankar R, Schmitz GP, Pedersen CE, Marcus DJ, Shirley SE, Hobbs TE, Elerding AJ, Renaud SJ, Jing M, et al. (2021). Ventral tegmental area GABAergic inhibition of cholinergic interneurons in the ventral nucleus accumbens shell promotes reward reinforcement. Nat. Neurosci 24, 1114–1428. - PMC - PubMed
    1. Ambroggi F, Ishikawa A, Fields HL, and Nicola SM (2008). Basolateral amygdala neurons facilitate reward-seeking behavior by exciting nucleus accumbens neurons. Neuron 59, 648–661. 10.1016/j.neuron.2008.07.004. - DOI - PMC - PubMed
    1. Anastasiades PG, Marlin JJ, and Carter AG (2018). Cell-type specificity of callosally evoked excitation and feedforward inhibition in the prefrontal cortex. Cell Rep. 22, 679–692. 10.1016/j.celrep.2017.12.073. - DOI - PMC - PubMed
    1. Aosaki T, Tsubokawa H, Ishida A, Watanabe K, Graybiel AM, Kimura M, and IshidA A (1994). Responses of tonically active neurons in the primate’s striatum undergo systematic changes during behavioral sensorimotor conditioning. J. Neurosci 14, 3969–3984. 10.1523/jneurosci.14-06-03969.1994. - DOI - PMC - PubMed

Publication types

LinkOut - more resources