. 2022 Jul 5;40(1):111008.
doi: 10.1016/j.celrep.2022.111008.

Diet and feeding pattern modulate diurnal dynamics of the ileal microbiome and transcriptome

Affiliations

Diet and feeding pattern modulate diurnal dynamics of the ileal microbiome and transcriptome

Ana Carolina Dantas Machado et al. Cell Rep. .

Abstract

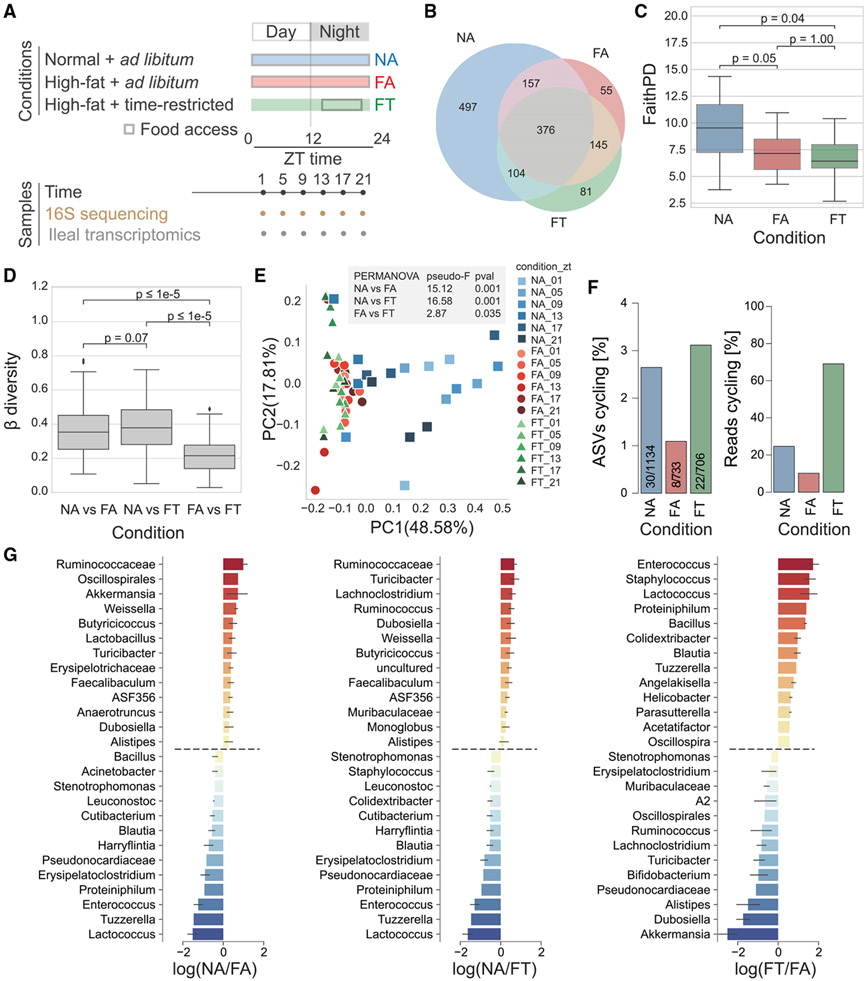
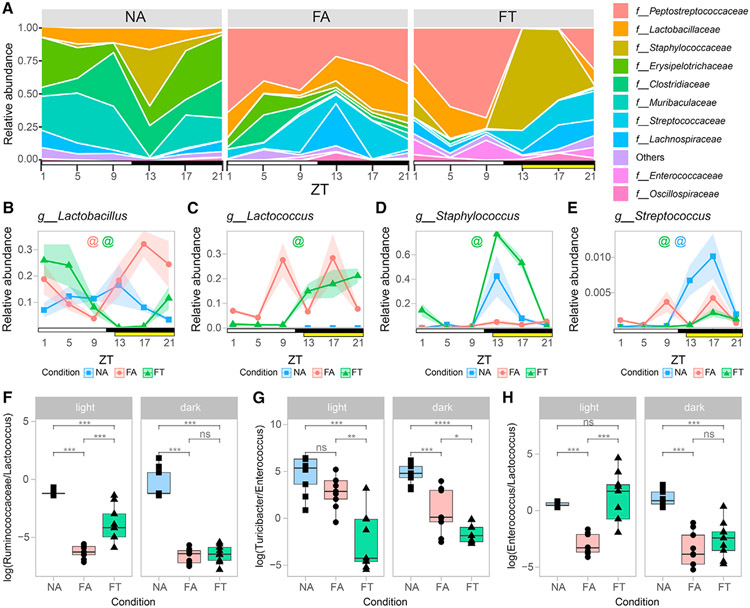
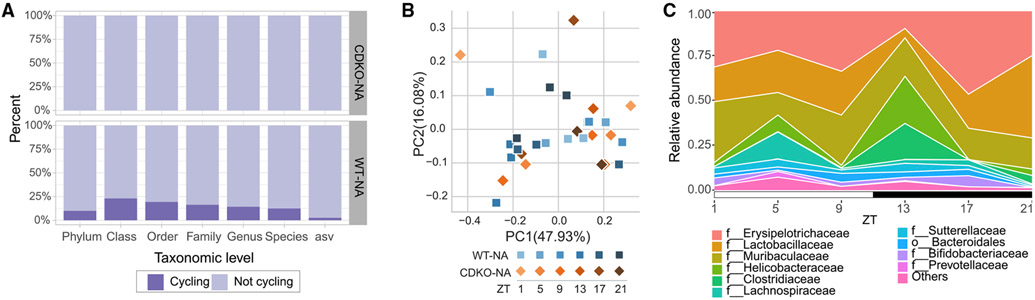
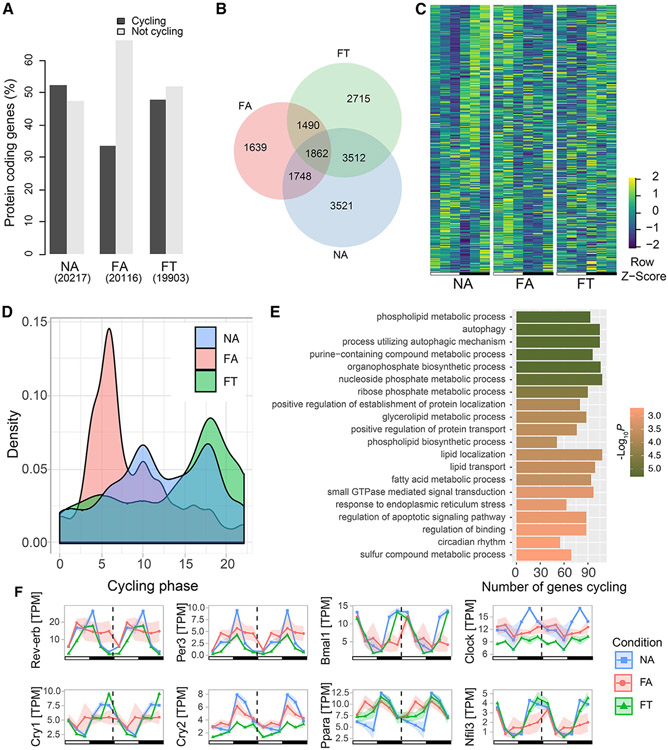
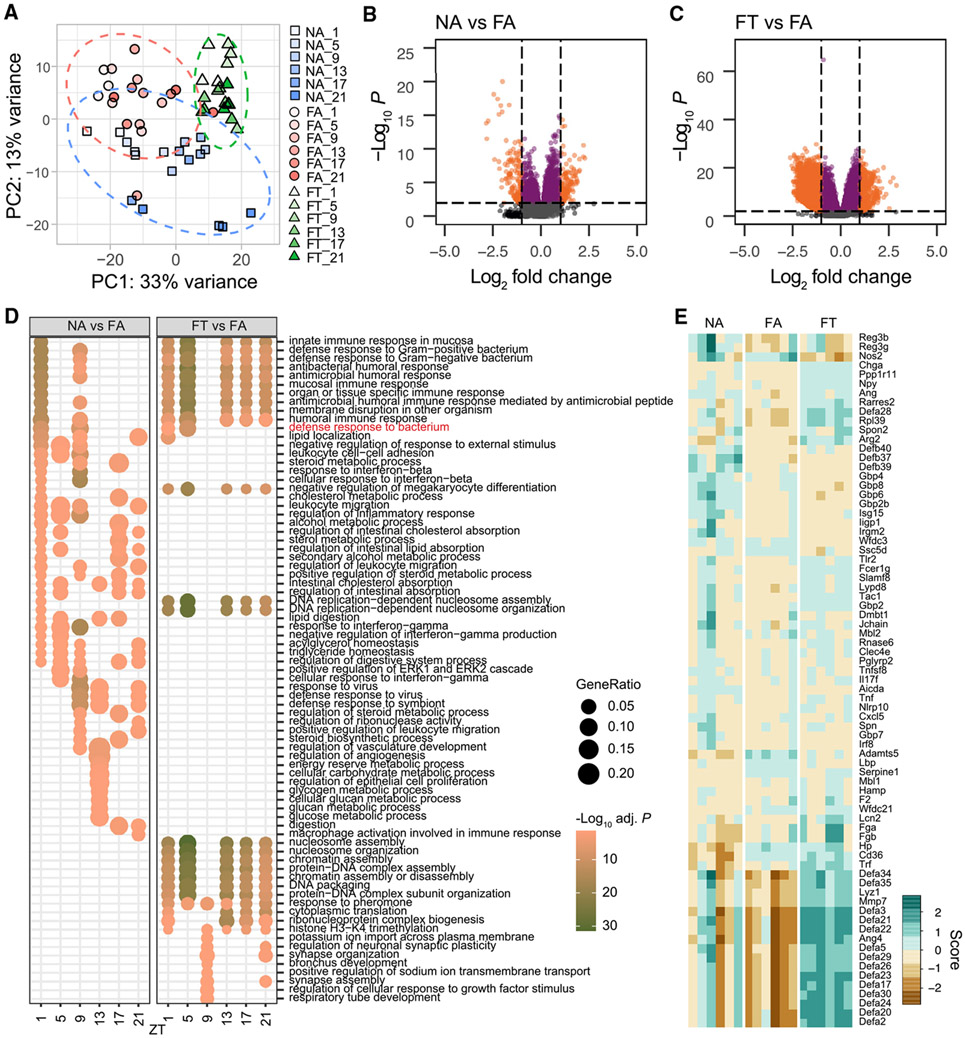
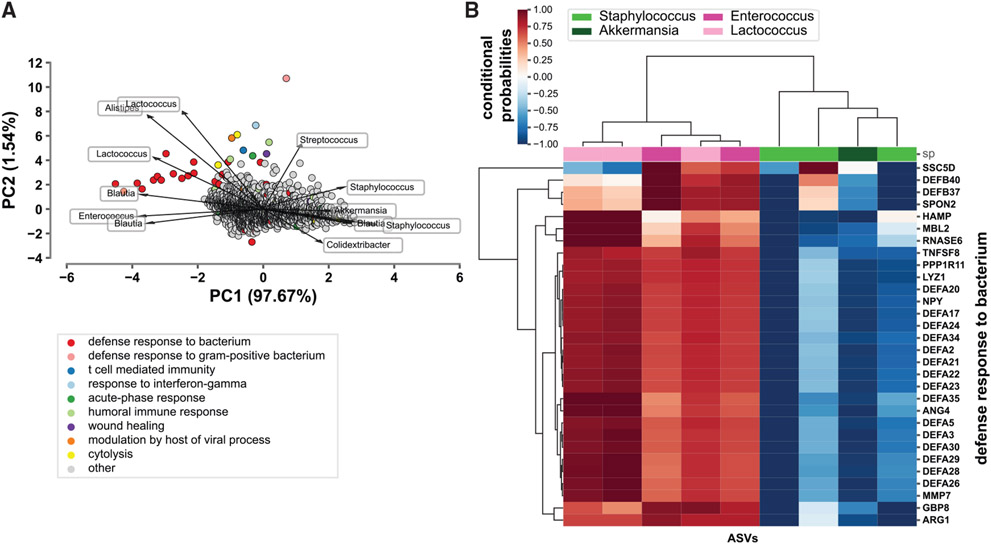
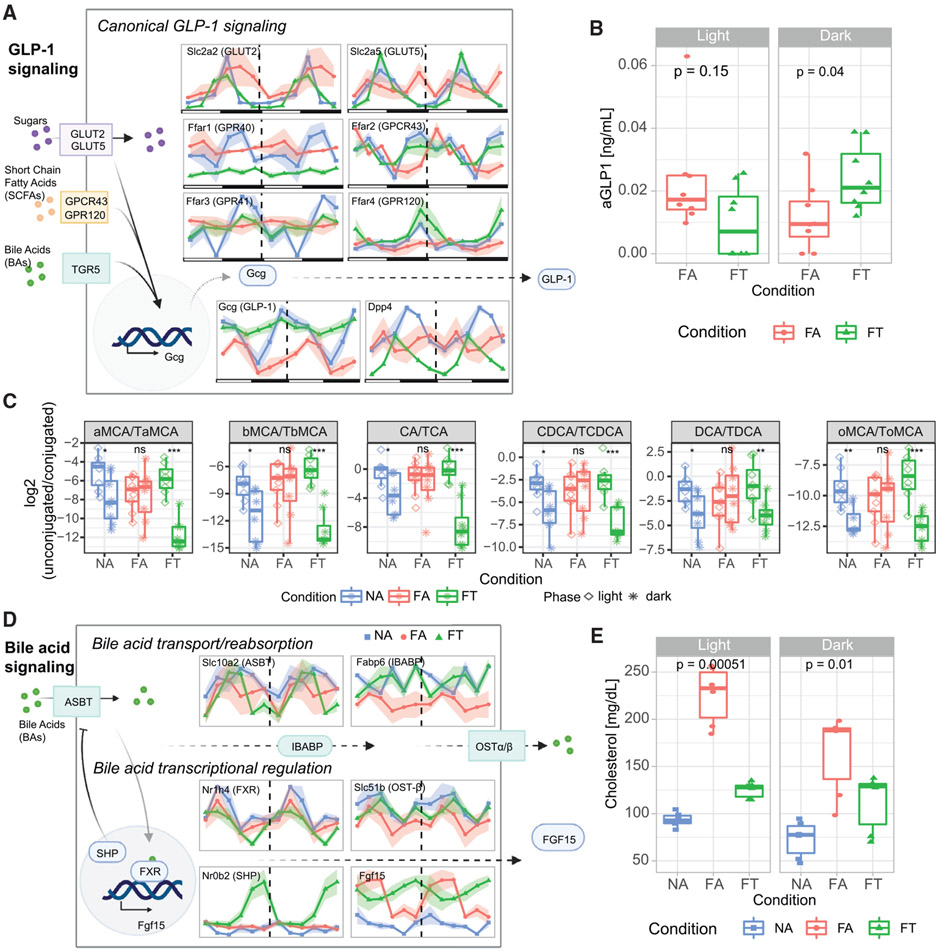
Compositional oscillations of the gut microbiome are essential for normal peripheral circadian rhythms, both of which are disrupted in diet-induced obesity (DIO). Although time-restricted feeding (TRF) maintains circadian synchrony and protects against DIO, its impact on the dynamics of the cecal gut microbiome is modest. Thus, other regions of the gut, particularly the ileum, the nexus for incretin and bile acid signaling, may play an important role in entraining peripheral circadian rhythms. We demonstrate the effect of diet and feeding rhythms on the ileal microbiome composition and transcriptome in mice. The dynamic rhythms of ileal microbiome composition and transcriptome are dampened in DIO. TRF partially restores diurnal rhythms of the ileal microbiome and transcriptome, increases GLP-1 release, and alters the ileal bile acid pool and farnesoid X receptor (FXR) signaling, which could explain how TRF exerts its metabolic benefits. Finally, we provide a web resource for exploration of ileal microbiome and transcriptome circadian data.

Keywords: 16S; CP: Microbiology; FXR; RNA-seq; bile acids; incretins; lumen; microbiota; small intestine.


Conflict of interest statement

Declaration of interests A.Z. and S.D.B. are co-founders and equity holders in Endure Biotherapeutics. S.P. is the author of a book titled The Circadian Code, for which he is paid author’s royalty.

Figures

Figure 1.
Figure 1.. Microbiota diversity and cyclical pattern at the ileum
(A) Schematic representation of study design and sample collection. (B) Shared ASVs between conditions. (C) Measures of α-diversity within each sample based on phylogenetic distance (Faith’s PD). (D) Overall β-diversity across conditions time points. (E) Principal coordinate analysis (PCoA) of ASVs colored by condition and collection time. (F) Cycling (JTK_CYCLE algorithm, MetaCycle) based on the total number of ASVs or reads. (G) Differential ranking between conditions as determined by Songbird. Statistical significance was assessed with the Mann-Whitney U test. *p < 0.05; **p < 0.01; ***p < 0.001; n.s., not significant. Three mice per time point were used for each condition, for a total of NA (n = 18), FA (n = 18), FT (n = 18).
Figure 2.
Figure 2.. Microbiota cycling dynamics signatures of the ileum at the family and genus level
(A) Relative abundance of top 10 bacterial families by time point for each condition. (B–E) Relative abundance for specific bacteria at the genus taxonomic level. Shaded areas show standard error of mean (SEM). (F–H) Log ratios of major differentially ranked bacteria (obtained from Songbird) separated by light and dark phases. Colored “@” symbols represent bacteria cycling under specific feeding conditions (NA = blue; FA = red; FT = green; MetaCycle JTK_CYCLE method p value <0.05). Statistical significance was assessed with Mann-Whitney U test. *p < 0.05; **p < 0.01; ***p < 0.001. Light and dark periods are represented by white and black horizontal bars, respectively. TRF food interval is represented by a yellow bar. Three mice per time point were used for each condition, for a total of NA (n = 18), FA (n = 18), FT (n = 18).
Figure 3.
Figure 3.. Ileal microbiota cycling and composition in CDKO mice
(A) Bar plot illustrates percentage of microbes at various taxonomic levels displaying cyclical dynamics in CDKO mice compared with WT mice with ad libitum access to normal chow (NA). (B) PCoA of weighted UniFrac distances for CDKO-NA compared with WT-NA. (C) Relative abundance of top 10 families in CDKO mice by time point. Light and dark periods are represented by white and black horizontal bars, respectively. Three or two mice per time point were used for WT-NA (n = 18) and CDKO-NA (n = 12), respectively. Animals are from different maternal lines.
Figure 4.
Figure 4.. Host transcriptome cycling dynamics in the ileum
(A) Percentage of cycling and non-cycling transcripts by condition (chi-squared p <0.05). (B) Venn diagram showing number of cycling protein-coding transcripts. (C) Heatmaps show the expression levels of the 1,862 genes that have circadian cycling in all three conditions. Rows were sorted by gene expression cycling phase based on NA. Values are Z scores of expression levels in transcripts per million (TPM). (D) Phase distribution of cycling genes. (E) Enriched gene ontology (GO) terms based on genes that lost cycling in FA, but not FT. (F) Double plot showing gene expression of circadian genes. Three mice per time point were used for each condition, for a total of NA (n = 18), FA (n = 18), FT (n = 18). Shading areas show standard error of mean (SEM).
Figure 5.
Figure 5.. Differential gene expression analysis
(A) PCA of transcriptome shows clustering of transcripts by condition (diet + feeding patterns) with variations with time of the day. Ellipses show 95% confidence level for a group of points. (B and C) Volcano plots show log2 fold change (LFC) of gene expression between conditions and −log10 of p values. Dashed lines represent an absolute LFC cutoff of 1.0 (vertical lines), or −log10(p value) of 2 (horizontal line). Data point colors are based on the following criteria: orange represents significant p value and above LFC cutoff; purple represents significant p value; dark gray represents above absolute LFC cutoff; light gray represents not significant. Number of upregulated and downregulated transcripts based on cutoffs are 160 and 203 respectively for NA versus FA; and 600 and 5984 respectively for FT versus FA. (D) Over-represented GO annotations obtained from differentially expressed (DE) genes between conditions, by time point. The GO annotation “Defense response to bacterium” is highlighted in red and further shown in (E). (E) Heatmap of normalized expression of DE genes based on the GO term defense response to bacteria. Scores are based on vst-transformed values (Love et al., 2014). Three mice per time point were used for each condition, for a total of NA (n = 18), FA (n = 18), FT (n = 18).
Figure 6.
Figure 6.. Relationship between host transcriptome and microbiome
(A) Biplot representing co-occurrence probabilities between ileal host transcripts and gut microbes. Principal components (PCs) PC1 and PC2 based on mmvec conditional probabilities are represented. Points and arrows represent specific transcripts and microbes, respectively. Direction of arrows represent co-occurrence patterns between microbe and transcript. Color of points represent specific GO terms that transcripts belong to. (B) Heatmap showing snapshot of conditional probabilities between ASVs and host transcripts part of the defense response to bacterium GO term. The families of identified ASVs are denoted by the legend. Three mice per time point were used for each condition, for a total of NA (n = 18), FA (n = 18), FT (n = 18).
Figure 7.
Figure 7.. Disruption of metabolic signaling pathways of the ileum
(A) Schematic representation of expression levels of GLP-1 signaling pathway genes. (B) Plasma active GLP-1 (aGLP-1) levels in mice fed HFD under FA or FT conditions. (C) Ratios of unconjugated to conjugated bile acids in light and dark phases for each condition. (D) Schematic representation of expression levels of bile acid signaling pathway genes. (E) Serum cholesterol levels under different feeding conditions. Transcript levels are expressed as TPM. Please see Figure S7 for figures with y axis measures. NA = blue, FA = red, FT = green. Three mice per time point were used for each condition, for a total of NA (n = 18), FA (n = 18), FT (n = 18) in (A) and (B). Shading areas show standard error of mean (SEM).

Comment in

References

    1. Allaband C, Lingaraju A, Martino C, Russell B, Tripathi A, Poulsen O, Dantas Machado AC, Zhou D, Xue J, Elijah E, et al. (2021). Intermittent hypoxia and hypercapnia alter diurnal rhythms of luminal gut microbiome and metabolome. mSystems, e0011621. 10.1128/mSystems.00116-21. - DOI - PMC - PubMed
    1. Alvarez Y, Glotfelty LG, Blank N, Dohnalová L, and Thaiss CA (2020). The microbiome as a circadian coordinator of metabolism. Endocrinology 161, bqaa059. 10.1210/endocr/bqaa059. - DOI - PMC - PubMed
    1. Arora T, Rudenko O, Egerod KL, Husted AS, Kovatcheva-Datchary P, Akrami R, Kristensen M, Schwartz TW, and Bäckhed F (2019). Microbial fermentation of flaxseed fibers modulates the transcriptome of GPR41-expressing enteroendocrine cells and protects mice against diet-induced obesity. Am. J. Physiol. Endocrinol. Metab 316, E453–E463. 10.1152/ajpendo.00391.2018. - DOI - PubMed
    1. Ashburner M, Ball CA, Blake JA, Botstein D, Butler H, Cherry JM, Davis AP, Dolinski K, Dwight SS, Eppig JT, et al. (2000). Gene Ontology: tool for the unification of biology. Nat. Genet 25, 25–29. 10.1038/75556. - DOI - PMC - PubMed
    1. Ayabe T, Satchell DP, Wilson CL, Parks WC, Selsted ME, and Ouellette AJ (2000). Secretion of microbicidal alpha-defensins by intestinal Paneth cells in response to bacteria. Nat. Immunol 1, 113–118. 10.1038/77783. - DOI - PubMed

Publication types

Substances