. 2022 Sep 8;45(9):zsac155.
doi: 10.1093/sleep/zsac155.

Effects of auditory sleep modulation approaches on brain oscillatory and cardiovascular dynamics

Affiliations

Effects of auditory sleep modulation approaches on brain oscillatory and cardiovascular dynamics

Stephanie Huwiler et al. Sleep. .

Abstract

Slow waves, the hallmark feature of deep nonrapid eye movement sleep, do potentially drive restorative effects of sleep on brain and body functions. Sleep modulation techniques to elucidate the functional role of slow waves thus have gained large interest. Auditory slow wave stimulation is a promising tool; however, directly comparing auditory stimulation approaches within a night and analyzing induced dynamic brain and cardiovascular effects are yet missing. Here, we tested various auditory stimulation approaches in a windowed, 10 s ON (stimulations) followed by 10 s OFF (no stimulations), within-night stimulation design and compared them to a SHAM control condition. We report the results of three studies and a total of 51 included nights and found a large and global increase in slow-wave activity (SWA) in the stimulation window compared to SHAM. Furthermore, slow-wave dynamics were most pronouncedly increased at the start of the stimulation and declined across the stimulation window. Beyond the changes in brain oscillations, we observed, for some conditions, a significant increase in the mean interval between two heartbeats within a stimulation window, indicating a slowing of the heart rate, and increased heart rate variability derived parasympathetic activity. Those cardiovascular changes were positively correlated with the change in SWA, and thus, our findings provide insight into the potential of auditory slow wave enhancement to modulate cardiovascular restorative conditions during sleep. However, future studies need to investigate whether the potentially increased restorative capacity through slow-wave enhancements translates into a more rested cardiovascular system on a subsequent day.

Keywords: auditory stimulation; cardiovascular recovery; heart rate variability; slow waves.


Figures

Figure 1.
Figure 1.
Experimental design. (A) Stimulation design of within-night presentation of different auditory stimulation conditions. Whenever the automatic sleep detection algorithm during the complete sleep period of 8 hours detected stable non-rapid eye movement sleep and the PLL reached the threshold target phase, a stimulation window was triggered. A single stimulation window consists of 10 s stimulation ON, where auditory stimulations were applied according to the presented condition, directly followed by a stimulation OFF window, where no auditory stimulation was presented. All conditions were presented in pseudorandomized order, meaning that they got shuffled in the beginning and only after all different conditions have been presented, the order got reshuffled again. Note that during the SHAM condition, no auditory stimulations were presented in neither the ON nor the OFF window. (B) Exemplary stimulation (rhythmic 1 Hz stimulation, ISI1) for a single stimulation window. (C) Circular distribution of the real target phase of the auditory stimulation for the conditions UP (ascending phase of all detected slow waves was targeted), DOWN (descending phase of all detected slow waves was targeted), and ISI1 stimulation for n = 23 participants of Study1 of the stimulation channel FpZ.
Figure 2.
Figure 2.
Results of auditory stimulation conditions on slow-wave dynamics and SWA. A + B: percentage change in Hilbert amplitude in the slow wave frequency band (0.5–2 Hz) for the conditions UP, DOWN, ISI1High relative to SHAM (A), or ENVELOPE and BINAURAL BEATS relative to SHAM (B) respectively, during the complete stimulation windows. Hilbert amplitude change is presented as mean ± standard error of the mean of the electrode Fz. The horizontal line at zero represents no change compared to the SHAM condition. Below the plot, the resulting p-values of post hoc comparisons of linear mixed-effects model with condition as an independent factor and subject as a random factor for every time point, is shown for each condition relative to SHAM in (A): UP, DOWN, ISI1High and (B): ENVELOPE and BINAURAL BEATS. Note that effect is most pronounced during beginning of stimulation ON window and diminishes with time. (C) Topographical change of SWA (0.5–2 Hz) for the conditions UP, DOWN, ISI1High, ENVELOPE, and BINAURAL BEATS compared to SHAM. Because of the difference of the SWA response seen in the Hilbert response, we divided the stimulation ON and OFF window in two 5 s windows each. Black dots indicate significant electrodes (p < .05) for the post hoc p-values resulting from linear mixed-effects effects model models with condition as an independent factor and subject as a random factor. p-values for each topoplot have been corrected for multiple comparisons by applying the false discovery rate. All plots are shown for n = 23 participants.
Figure 3.
Figure 3.
Results of 1 Hz rhythmic stimulation (ISI1) with different sound volumes on slow-wave dynamics. A + C: percentage change of Hilbert amplitude in the slow-wave frequency band (0.5–2 Hz) for the conditions ISI1High (45 dB), ISI1Mod (40–45 dB) compared to SHAM (A) and ISI1High (45 dB), ISI1Low (42.5 dB) compared to SHAM (B), respectively. The horizontal line at zero represents no change compared to the SHAM condition. Data are presented as mean ± standard error of the mean for electrode Fz. Below the plot, the resulting p-values of the post hoc comparison of linear mixed-effects models with the condition as fixed factor and volunteer as random factor for each time point are shown. B + D: Percentage change of Hilbert amplitude in the slow-wave frequency band (0.5–2 Hz) for the condition ISI1High compared to ISI1Mod (C), and ISI1High compared to ISI1Low (B), respectively. The horizontal line at zero represents no change. Data are presented as mean ± standard error of the mean for electrode Fz. Below the plot, the resulting p-values of the post hoc comparison of linear mixed–effects models with condition as a fixed factor and subject as a random factor for each time point are shown. Plots A + B: show n = 9 participants, and plot C + D: n = 19 participants.
Figure 4.
Figure 4.
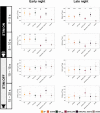
Effects of time of the night on SWA (0.5–2 Hz). Early night shows SWA data of the Fz electrode for all stimulation conditions (UP, DOWN, ISI1High, ENVELOPE, BINAURAL BEATS, SHAM) for the first 4 hr after the first stimulation window started. Late-night represents the remaining hours of stimulations. We employed linear mixed effect models for all 5 s of the stimulation windows entering the stimulation condition as a fixed effect and subject as a random factor. All post hoc p-values represent the significance compared to the SHAM condition and have been adjusted for multiple comparisons using the Hochberg correction. ***p < .001, **p < .01, *p < .05, #0.05 < p < 0.1. All data are shown for n = 23 participants.
Figure 5.
Figure 5.
Cardiovascular response to auditory stimulation. A + B: percentage change in IHR during stimulation window for UP, DOWN, IS1High, and SHAM stimulation (A), or ENVELOPE, BINAURAL BEATS, and SHAM (B) compared to the mean of the closest SHAM window, if the closest window was within 5 min. IHR is presented as mean ± standard error of the mean. (C) Heart rate (variability) features for stimulation windows for the conditions UP, DOWN, ISI1High, ENVELOPE, BINAURAL BEATS, and SHAM stimulation. All data are presented as mean ± standard error of the mean. RRI: interval between two normal heartbeats, RMSSD: root mean square of successive differences between normal heartbeats. SDNN: standard deviation of normal heartbeats. Longest RRI: duration of the longest interval between two consecutive heartbeats in a stimulation window. Shortest RRI: duration of the shortest interval between two consecutive heartbeats in a stimulation window: RRI Diff: difference between the longest and shortest interval within a single stimulation window. Note that the RRI is inversely correlated with heart rate, thus, the longer the RRI, the lower the heart rate. Significance levels of the linear mixed-effects model with the condition as an independent factor and subject as a random factor are shown for each cardiovascular feature in the plot and corrected for multiple comparisons using the Hochberg method. ***p < .001, **p < .01, *p < .05, #0.05 < p < 0.1. Data is shown for n = 23 participants.
Figure 6.
Figure 6.
Repeated measures correlations between percentage change for heart rate (variability; HR(V)) features and percentage change of SWA (0.5–2 Hz) in the first 5 s of the stimulation ON window of electrode Fz. For every participant (n = 22) and every condition a mean value for each variable was calculated. We excluded one participant because not all conditions had ECG measurements of high enough qualities. Topoplots show r values and significant electrodes (p < .05) are marked with black dots. We corrected the p-values for multiple comparisons using false discovery rate. The repeated measures correlation is plotted for the example electrode F3 (marked with a gray point in the topoplots), and the respective p-values and rrm values are shown in the plots. (A) Mean difference of consecutive heart beats (RRI). (B) Difference in the root mean square of successive difference of normal heart beats (RMSSD). (C) Differences of the longest RRI. (D) Difference in the standard deviation of differences between normal heartbeats (SDNN). (E) Percentage of difference of the shortest RRI.

Comment in

References

    1. Eugene AR, et al. . The neuroprotective aspects of sleep. MEDtube Sci. 2015;3(1):35–40. - PMC - PubMed
    1. Underwood E. Sleep: the brain’s housekeeper? Science. 2013;342(6156):301. doi: 10.1126/science.342.6156.301. - DOI - PubMed
    1. Eide PK, et al. . Sleep deprivation impairs molecular clearance from the human brain. Brain. 2021;144(3):863–874. doi: 10.1093/brain/awaa443. - DOI - PubMed
    1. Tononi G, et al. . Sleep function and synaptic homeostasis. Sleep Med Rev. 2006;10(1):49–62. doi: 10.1016/j.smrv.2005.05.002. - DOI - PubMed
    1. Ong JL, et al. . Effects of phase-locked acoustic stimulation during a nap on EEG spectra and declarative memory consolidation. Sleep Med. 2016;20:88–97. doi: 10.1016/j.sleep.2015.10.016. - DOI - PubMed

Publication types