. 2022 Jul;10(7):e004616.
doi: 10.1136/jitc-2022-004616.

Inhibition of stearoyl-CoA desaturase 1 (SCD1) enhances the antitumor T cell response through regulating β-catenin signaling in cancer cells and ER stress in T cells and synergizes with anti-PD-1 antibody

Affiliations

Inhibition of stearoyl-CoA desaturase 1 (SCD1) enhances the antitumor T cell response through regulating β-catenin signaling in cancer cells and ER stress in T cells and synergizes with anti-PD-1 antibody

Yuki Katoh et al. J Immunother Cancer. 2022 Jul.

Abstract

Background: Understanding the mechanisms of non-T cell inflamed tumor microenvironment (TME) and their modulation are important to improve cancer immunotherapies such as immune checkpoint inhibitors. The involvement of various immunometabolisms has recently been indicated in the formation of immunosuppressive TME. In this study, we investigated the immunological roles of stearoyl-CoA desaturase 1 (SCD1), which is essential for fatty acid metabolism, in the cancer immune response.

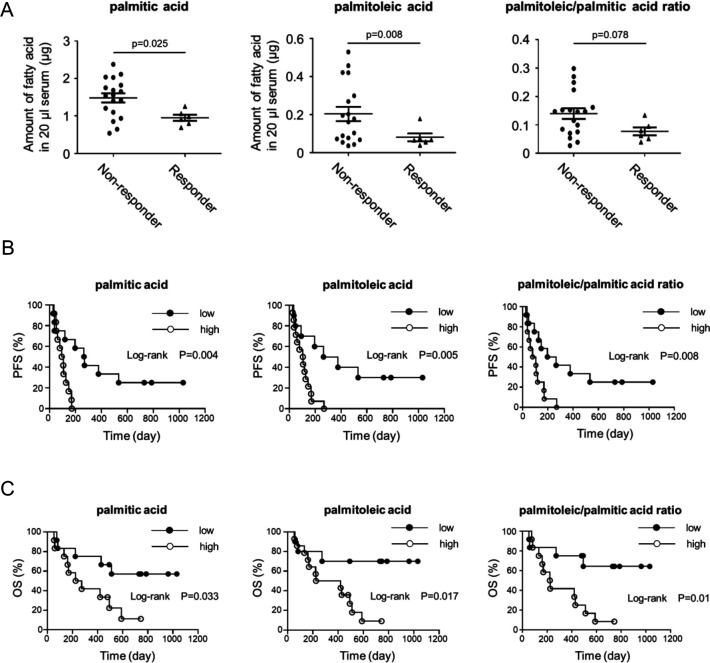
Methods: We investigated the roles of SCD1 by inhibition with the chemical inhibitor or genetic manipulation in antitumor T cell responses and the therapeutic effect of anti-programmed cell death protein 1 (anti-PD-1) antibody using various mouse tumor models, and their cellular and molecular mechanisms. The roles of SCD1 in human cancers were also investigated by gene expression analyses of colon cancer tissues and by evaluating the related free fatty acids in sera obtained from patients with non-small cell lung cancer who were treated with anti-PD-1 antibody.

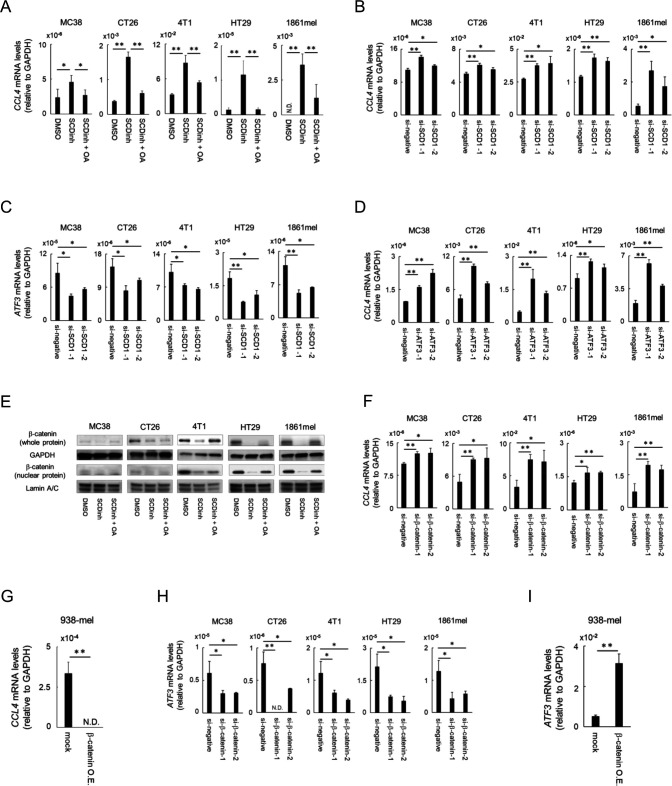
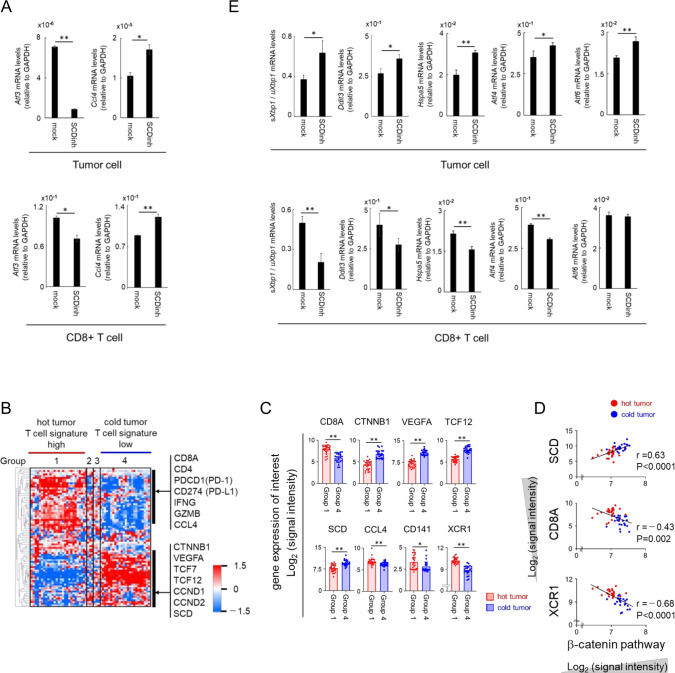
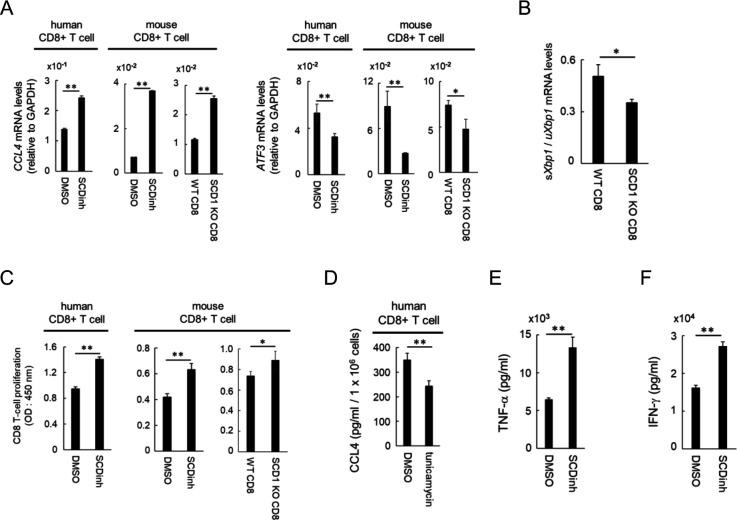
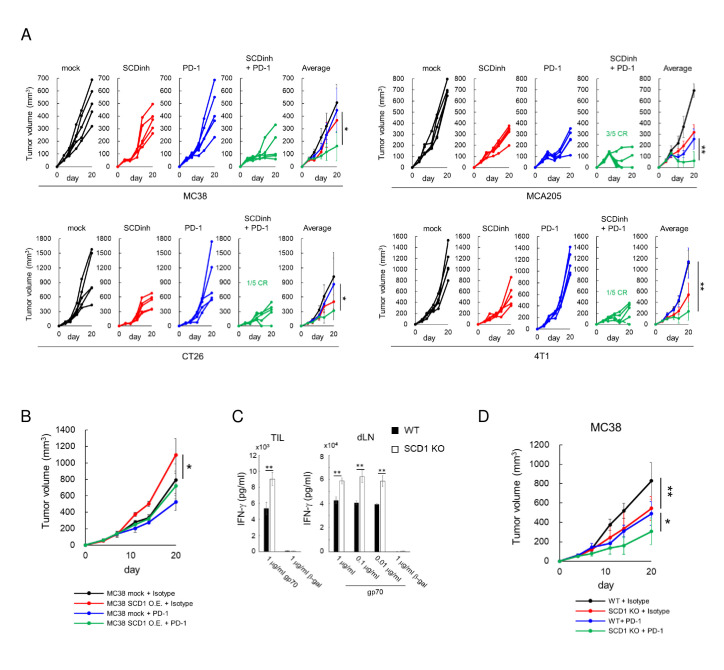
Results: Systemic administration of a SCD1 inhibitor in mouse tumor models enhanced production of CCL4 by cancer cells through reduction of Wnt/β-catenin signaling and by CD8+ effector T cells through reduction of endoplasmic reticulum stress. It in turn promoted recruitment of dendritic cells (DCs) into the tumors and enhanced the subsequent induction and tumor accumulation of antitumor CD8+ T cells. SCD1 inhibitor was also found to directly stimulate DCs and CD8+ T cells. Administration of SCD1 inhibitor or SCD1 knockout in mice synergized with an anti-PD-1 antibody for its antitumor effects in mouse tumor models. High SCD1 expression was observed in one of the non-T cell-inflamed subtypes in human colon cancer, and serum SCD1 related fatty acids were correlated with response rates and prognosis of patients with non-small lung cancer following anti-PD-1 antibody treatment.

Conclusions: SCD1 expressed in cancer cells and immune cells causes immunoresistant conditions, and its inhibition augments antitumor T cells and therapeutic effects of anti-PD-1 antibody. Therefore, SCD1 is an attractive target for the development of new diagnostic and therapeutic strategies to improve current cancer immunotherapies including immune checkpoint inhibitors.

Keywords: CD8-Positive T-Lymphocytes; Drug Therapy, Combination; Immunotherapy; Tumor Microenvironment.


Conflict of interest statement

Competing interests: None declared.

Figures

Figure 1
Figure 1
Inhibition of SCD1 enhances antitumor immune responses. C57BL/6 mice bearing MC38 or MCA205 tumors and Balb/c mice bearing CT26 or 4T1 tumors were treated with a SCD inhibitor (SCDinh) or with vehicle only (mock). (A) Ratios of palmitoleic acid / palmitic acid and oleic acid / stearic acid in the tumor, draining lymph nodes (dLN) and sera in C57BL/6-MC38 and Balb/c-CT26 model. (B) Tumor-growth curves in mean tumor volumes (mm3 ± standard deviation (SD); n=5) in four models. (C) Mean tumor volumes (mm3 ± SD; n=5) in MC38 tumor-bearing C57BL/6 mice that received a CD8-depleting or an isotype-matched monoclonal antibody. (D) Tumor‐infiltrating CD8+ T cells and irradiated syngeneic splenocytes cocultured and restimulated with gp70 peptide or β-gal peptide (negative control). In vivo tumor antigen‐specific T‐cell induction from tumor (TIL) and dLN evaluated by IFN-γ release assays in C57BL/6-MC38 (left panel) and in C57BL/6-MCA205 (right panel) models (means ± SD; n=3). (E) Percentages of gp70-specific CD8+ T cells in Balb/c-CT26 tumors analyzed by flow cytometry. Representative gp70-tetramer staining of CD8+ T cells in each group (left panel) and for all individuals (right panel) (n=5). *P<0.05, **P<0.01. Dep, depleted.
Figure 2
Figure 2
Inhibition of SCD1 enhances the infiltration of CD8+ T cells and DCs into tumors via production of CCL4. C57BL/6 mice bearing MC38 or MCA205 tumors and Balb/c mice bearing CT26 or 4T1 tumors were treated with a SCD inhibitor (SCDinh) or with vehicle only (mock). Tumors were excised on day 20. (A) Analysis of tumor-infiltrating CD8+ T cells by qPCR, flow cytometry, immunostaining and image analysis (n=5). (B) Percentages of 4-1BB+, PD-1+, TIGIT+ and Lag3+ CD8+ T cells in tumors analyzed by flow cytometry in C57BL/6-MC38 model (n=5). (C) Absolute numbers of CD45+ CD11c+ cells analyzed by flow cytometry (n=5). (D, E) Ccl4 and Atf3 gene expression evaluated by real-time RT-PCR (n=5). *P<0.05, **P<0.01. N.D., not determined. Data are expressed as means ± SD.
Figure 3
Figure 3
SCD1 regulates CCL4 production via β-catenin in tumor cells. (A) Mouse (MC38, CT26 and 4T1) and human (HT29 and 1861mel) cancer cells were cultured in RPMI medium containing 2% serum supplemented with a SCD inhibitor (SCDinh), with SCDinh + oleic acid (SCDinh + OA) or with dimethylsulfoxide (DMSO). Total RNA was extracted and CCL4 mRNA was evaluated using real-time RT-PCR. (B, C) Cancer cells were transfected with small interfering RNA (siRNA)-SCD1 or with siRNA-control (si-negative) after which CCL4 (B) and ATF3 (C) mRNA levels were evaluated by real-time RT-PCR at 48 h post-transfection. (D) Cancer cells were transfected with siRNA-ATF3 or with siRNA-control after which mRNA levels were evaluated by real-time RT-PCR at 48 h post-transfection. (E) Whole cell and nuclear β-catenin protein levels were measured by western blot; GAPDH and lamin A/C were used as controls. (F-I) Knockdown (F, H) or overexpression (G, I) of β-catenin in mouse and human cancer cell lines. Cancer cells were transfected with siRNA-β-catenin or with si-negative after which CCL4 (F) and ATF3 (H) mRNA levels were evaluated by real-time RT-PCR at 48 h post-transfection. CCL4 (G) and ATF3 (I) gene expression in a human melanoma cell line (938mel) overexpressing β-catenin. Data are expressed as means ± SD (n=3). *P<0.05, **P<0.01. N.D., not determined. O.E., over-expressing.
Figure 4
Figure 4
SCD1 is involved in the production of CCL4 and the infiltration of immune cells into tumors via β-catenin and ER stress. (A) C57BL/6 mice bearing DsRed-MC38 tumors were treated with SCDinh or with vehicle after which DsRed+ tumor cells (upper panel) and CD8+ T cells (lower panel) were isolated at day 20. Total RNA was extracted and CCL4 and ATF3 gene expression was analyzed by real-time RT-PCR. (B) Heat map of 57 colorectal tumors classified focusing on immune related genes, fatty acid metabolism related genes and β-catenin pathway genes (dataset 1). (C) Comparison of expression levels of genes of interest (CD8A, β-catenin pathway genes (CTNNB1, VEGFA, TCF12), SCD, CCL4, CD141 and XCR1) in Group 1 (hot tumor; n=27) and in Group 4 (cold tumor; n=24). (D) Correlation analysis of β-catenin pathway (dataset 2) with SCD, CD8A and XCR1 in Group 1 (hot tumor) and in Group 4 (cold tumor). (E) sXbp1/uXbp1 ratio, Ddit3, Hspa5, Atf4 and Atf6 mRNA levels in DsRed+ tumor cells (upper panel) and tumor-infiltrating CD8+ T cells (lower panel) in C57BL/6 mice bearing DsRed-MC38. Data are expressed as means ± SD (n=3). *P<0.05, **P<0.01.
Figure 5
Figure 5
A SCD1 inhibitor directly enhances the function of CD8 + T cells and DCs in vitro. (A-C) CD8+ T cells were isolated from human PBMCs and spleens of wild-type (WT) or SCD1 knockout (KO) mice using MACS and were activated with an anti-CD3 monoclonal antibody, with an anti-CD28 monoclonal antibody and with IL-2. CD8+ T cells were cultured in RPMI medium containing 2% serum, after which DMSO or 1 µM SCD inhibitor (SCDinh) was added 2 days later, and cells were collected on day 4. (A) CCL4 and ATF3 expression levels in human and mouse CD8+ T cells. (B) sXbp1 / uXbp1 ratio in SCD1 KO mice CD8+ T cells. (C) Effect of SCD1 depletion on the proliferation of human and mouse CD8+ T cells evaluated by WST-1 assay. (D) Human CD8+ T cells were treated with DMSO or tunicamycin as described in materials and methods. On day 3, supernatants were collected and CCL4 levels were measured by ELISA. (E, F) Human DCs were differenciated from CD14+ PBMCs as described in the Methods. Differentiated DCs were activated by LPS stimulation. (E) TNF-α levels in the supernatant the day after LPS stimulation were evaluated by ELISA. (F) Activated DCs and allogenic CD8+ T cells were co-cultured and IFN-γ levels in the supernatant were measured the following day by ELISA. Data are expressed as means ± SD (n=3). *P<0.05, **P<0.01. SCDinh, SCD1 inhibitor; DMSO, dimethylsulfoxide control.
Figure 6
Figure 6
Inhibition of SCD1 enhances the therapeutic effect of anti-PD-1 antibodies. (A) Mice bearing MC38, MCA205, CT26 and 4T1 tumors were treated with a SCD1 inhibitor (SCDinh; 10 mg/kg) or with vehicle and with an anti-PD-1 antibody (200 µg /mouse) or an isotype-matched antibody. Tumor-growth curves for individual mice (left 4 panels) and average tumor volumes (right panel) (means ± SD; n=5). (B) C57BL/6 mice bearing vector control MC38 (MC38 mock) or SCD1 over-expressed MC38 tumors were treated with an anti-PD-1 (200 µg /mouse) or an isotype-matched antibody. (C) Antigen (gp70)‐specific T‐cell induction in SCD1 KO mice bearing MC38 tumors. (D) Wild-type (WT) or SCD1 KO mice bearing MC38 tumors were treated with an anti-PD-1 (200 µg /mouse) or an isotype-matched antibody.
Figure 7
Figure 7
SCD1-related free fatty acids and ratio are potential biomarkers to predict PD-1 antibody responses and prognosis. (A) Pretreatment serum levels of palmitic and palmitoleic acid and ratio of palmitoleic/palmitic acid from NSCLC patients who subsequently did (Responder, n=6) or did not (Non-responder, n=18) respond to anti-PD-1 antibody treatment. (B, C) Kaplan–Meier analyses of NSCLC patients before anti-PD-1 antibody treatment. Kaplan–Meier curve of high (n=12) and low (n=12) palmitic acid, palmitoleic acid and palmitoleic/palmitic acid ratio in the serum of PFS patients (B) (HR 0.34, 95% CI 0.13 to 0.85; HR 0.32, 95% CI 0.13 to 0.77; HR 0.35, 95% CI 0.14 to 0.87, respectively) or OS patients (C) (HR 0.34, 95% CI 0.12 to 0.94; HR 0.25, 95% CI 0.09 to 0.69; HR 0.25, 95% CI 0.09 to 0.71, respectively). The threshold between high and low was median (palmitic acid; 1.33, palmitoleic acid; 0.10, palmitoleic/palmitic acid ratio; 0.10).

References

    1. Robert C, Long GV, Brady B, et al. . Nivolumab in previously untreated melanoma without BRAF mutation. N Engl J Med 2015;372:320–30. 10.1056/NEJMoa1412082 - DOI - PubMed
    1. Hodi FS, O'Day SJ, McDermott DF, et al. . Improved survival with ipilimumab in patients with metastatic melanoma. N Engl J Med 2010;363:711–23. 10.1056/NEJMoa1003466 - DOI - PMC - PubMed
    1. Le DT, Durham JN, Smith KN, et al. . Mismatch repair deficiency predicts response of solid tumors to PD-1 blockade. Science 2017;357:409–13. 10.1126/science.aan6733 - DOI - PMC - PubMed
    1. Spranger S, Gajewski TF. Impact of oncogenic pathways on evasion of antitumour immune responses. Nat Rev Cancer 2018;18:139–47. 10.1038/nrc.2017.117 - DOI - PMC - PubMed
    1. Ayers M, Lunceford J, Nebozhyn M, et al. . IFN-γ-related mRNA profile predicts clinical response to PD-1 blockade. J Clin Invest 2017;127:2930–40. 10.1172/JCI91190 - DOI - PMC - PubMed

Publication types

MeSH terms