. 2022 Jul 6;13(1):3888.
doi: 10.1038/s41467-022-31487-x.

Population genomics of ancient and modern Trichuris trichiura

Affiliations

Population genomics of ancient and modern Trichuris trichiura

Stephen R Doyle et al. Nat Commun. .

Abstract

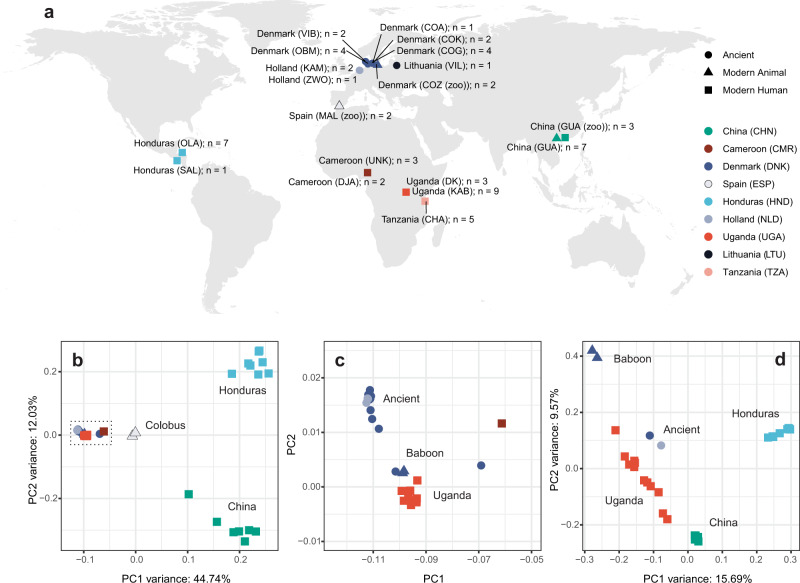
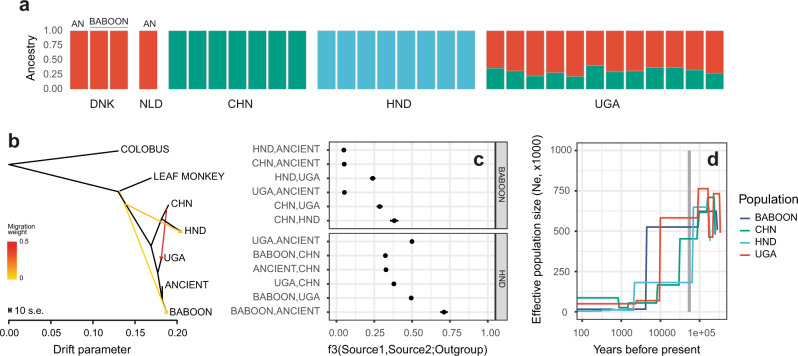
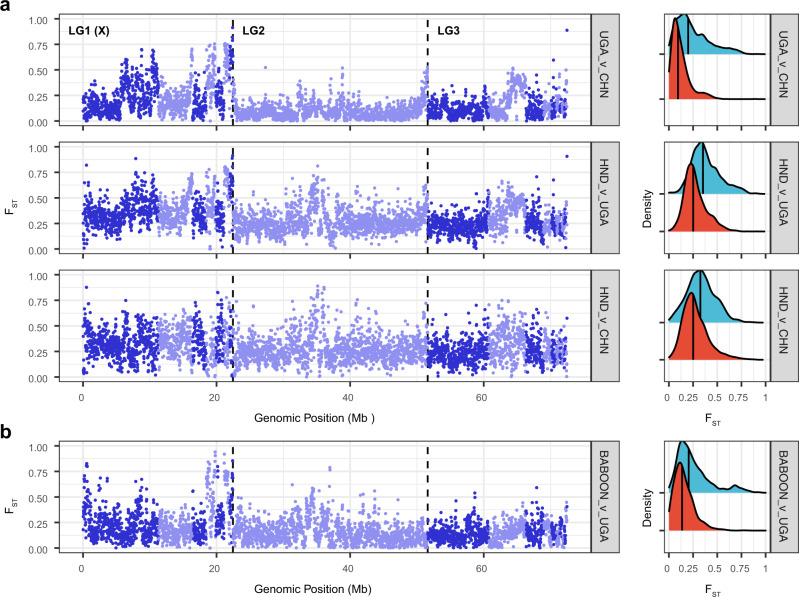
The neglected tropical disease trichuriasis is caused by the whipworm Trichuris trichiura, a soil-transmitted helminth that has infected humans for millennia. Today, T. trichiura infects as many as 500 million people, predominantly in communities with poor sanitary infrastructure enabling sustained faecal-oral transmission. Using whole-genome sequencing of geographically distributed worms collected from human and other primate hosts, together with ancient samples preserved in archaeologically-defined latrines and deposits dated up to one thousand years old, we present the first population genomics study of T. trichiura. We describe the continent-scale genetic structure between whipworms infecting humans and baboons relative to those infecting other primates. Admixture and population demographic analyses support a stepwise distribution of genetic variation that is highest in Uganda, consistent with an African origin and subsequent translocation with human migration. Finally, genome-wide analyses between human samples and between human and non-human primate samples reveal local regions of genetic differentiation between geographically distinct populations. These data provide insight into zoonotic reservoirs of human-infective T. trichiura and will support future efforts toward the implementation of genomic epidemiology of this globally important helminth.


Conflict of interest statement

The authors declare no competing interests.

Figures

Fig. 1
Fig. 1. Global sampling distribution and broad-scale genetic relatedness of ancient and modern Trichuris trichiura.
a World map showing the approximate sampling locations of samples used in the study, highlighting geographic regions of ancient and modern sampling and host species. Sample site abbreviations: CHA = Chake; COA = Adelgade, Copenhagen; COG = Gammel Strand, Copenhagen; COK = Kultorvet, Copenhagen; COZ = Copenhagen Zoo; DJA = Dja Fauna Reserve; GUA = Guangdong; KAB = Kabale, Nyakitokoli; KAM = Kampen; MAL = Málaga Zoo; OMB = Odense By Midte; OLA = Olanchito; SAL = San Lorenzo; VIB = Viborg; VIL = Vilnius; ZWO = Zwolle. b Principal component analysis of mitochondrial diversity (56 samples, 802 variants). c Zoomed-in view of the cluster of samples indicated by the dashed box in b, containing ancient, Ugandan, and baboon-derived samples. d Principal component analysis of nuclear diversity using a subset of higher quality samples (31 samples, 2,544,110 autosomal variants).
Fig. 2
Fig. 2. Changes in ancient parasite diversity across space and time.
a Genetic differentiation between ancient sample sites based on pairwise estimates of mitochondrial genome diversity (pooled sample FST) is shown. The width of the dashed line connecting pairs of sample sites reflects the degree of similarity between mitochondrial genomes. b Comparison of the levels of nucleotide diversity (π) within the ancient mitochondrial genomes over time. Pearson’s correlation (r) and associated p-value (cor.test; two-sided; adjusted p-value [“holm”]), together with the linear regression (grey trendline line) and 95% confidence level interval (grey shaded area), are shown. Samples are coloured based on the scheme in Fig. 1. Sample site abbreviations: COA = Adelgade, Copenhagen; COG = Gammel Strand, Copenhagen; COK = Kultorvet, Copenhagen; OMB = Odense By Midte; VIB = Viborg; KAM = Kampen; ZWO = Zwolle; VIL = Vilnius.
Fig. 3
Fig. 3. Fine-scale genetic relationships and admixture between global populations.
a Admixture plot depicting population ancestry proportions determined using NGSadmix (K = 3, variants = 484,914). See Supplementary Fig. 6 for a complete analysis of K from 2 to 10. Ancient (AN) and baboon samples are highlighted. b Treemix maximum likelihood tree of ancient and modern samples, including Colobus and Leaf monkey samples as outgroups, showing three migration edges. See Supplementary Fig. 8 for a complete analysis of migration edges from 0 to 5. c Outgroup f3 statistics were determined using qp3Pop in ADMIXTOOLS to compare allele frequency correlations between two source populations (indicated on the left side of the panel) relative to an outgroup population (right side of the panel). f3 values (f3 = [foutgroup-fsource1]*[foutgroup-fsource2], where f is the allele frequency, averaged over all variable sites) are indicated by a point and whiskers represent the standard error, calculated using a weighted block jackknife (2,575,411 SNPs; n = 3 blocks; default parameters). For all data presented, the Z score was significant (|Z| > 3). d The population demographic history of each population was determined using SMC++ to compare effective population size (Ne) over recent evolutionary history. The grey vertical box highlights the period between 50 and 60 thousand years ago, coinciding with the migration of modern humans out of Africa. Sample abbreviations: CHN = China; UGA = Uganda; HND = Honduras.
Fig. 4
Fig. 4. Genome-wide comparison of genetic variation between populations.
a Comparison of genome-wide genetic differentiation between human-infective T. trichiura from genetically and geographically defined populations. Pairwise FST was measured in 20 kb windows between China and Uganda (top), Uganda and Honduras (middle), and China and Honduras (bottom). Alternating dark and light blue colours represent different scaffolds, with the vertical dashed lines separating the three chromosomal linkage groups (LG). The sex-linked linkage group is indicated as LG1 (X). b Comparison of closely related human-infective Ugandan and baboon-infective T. trichiura. Sample abbreviations: CHN = China; UGA = Uganda; HND = Honduras. Density plots in a and b show the distribution of FST values for the sex-linked (blue) and autosomal (red) scaffolds. The median FST value for each is shown (solid vertical line).

References

    1. Pullan RL, Smith JL, Jasrasaria R, Brooker SJ. Global numbers of infection and disease burden of soil transmitted helminth infections in 2010. Parasit. Vectors. 2014;7:37. doi: 10.1186/1756-3305-7-37. - DOI - PMC - PubMed
    1. Duque-Correa MA, et al. Defining the early stages of intestinal colonisation by whipworms. Nat. Commun. 2022;13:1725. doi: 10.1038/s41467-022-29334-0. - DOI - PMC - PubMed
    1. Hansen EP, et al. Faecal egg counts and expulsion dynamics of the whipworm, Trichuris trichiura following self-infection. J. Helminthol. 2016;90:298–302. doi: 10.1017/S0022149X1500019X. - DOI - PubMed
    1. Else KJ, et al. Whipworm and roundworm infections. Nat. Rev. Dis. Prim. 2020;6:44. doi: 10.1038/s41572-020-0171-3. - DOI - PubMed
    1. Clarke NE, et al. Efficacy of anthelminthic drugs and drug combinations against soil-transmitted helminths: a systematic review and network meta-analysis. Clin. Infect. Dis. 2019;68:96–105. doi: 10.1093/cid/ciy1108. - DOI - PubMed

Publication types