. 2022 Jul 6;13(1):3897.
doi: 10.1038/s41467-022-31257-9.

Periarteriolar spaces modulate cerebrospinal fluid transport into brain and demonstrate altered morphology in aging and Alzheimer's disease

Affiliations

Periarteriolar spaces modulate cerebrospinal fluid transport into brain and demonstrate altered morphology in aging and Alzheimer's disease

Humberto Mestre et al. Nat Commun. .

Abstract

Perivascular spaces (PVS) drain brain waste metabolites, but their specific flow paths are debated. Meningeal pia mater reportedly forms the outermost boundary that confines flow around blood vessels. Yet, we show that pia is perforated and permissive to PVS fluid flow. Furthermore, we demonstrate that pia is comprised of vascular and cerebral layers that coalesce in variable patterns along leptomeningeal arteries, often merging around penetrating arterioles. Heterogeneous pial architectures form variable sieve-like structures that differentially influence cerebrospinal fluid (CSF) transport along PVS. The degree of pial coverage correlates with macrophage density and phagocytosis of CSF tracer. In vivo imaging confirms transpial influx of CSF tracer, suggesting a role of pia in CSF filtration, but not flow restriction. Additionally, pial layers atrophy with age. Old mice also exhibit areas of pial denudation that are not observed in young animals, but pia is unexpectedly hypertrophied in a mouse model of Alzheimer's disease. Moreover, pial thickness correlates with improved CSF flow and reduced β-amyloid deposits in PVS of old mice. We show that PVS morphology in mice is variable and that the structure and function of pia suggests a previously unrecognized role in regulating CSF transport and amyloid clearance in aging and disease.


Conflict of interest statement

The authors declare no competing interests.

Figures

Fig. 1
Fig. 1. Pial cells are reticulated, express ERTR7, and prominently ensheath large arteries in ventral brain regions, forming the epipia.
Routine (a), ultrastructural (b, c), and super-resolution fluorescent ERTR7 labeled (d) images of the brain surface demonstrate the reticulated nature of pial cells. On coronal section (e), the proximal middle cerebral artery is observed to be thickly ensheathed (open arrow), while a distal oblique arterial segment exhibits a thin sheath (solid arrow) and small arterial branches are unsheathed by ERTR7. Large subarachnoid arteries in ventral brain region are depicted on longitudinal (e) and cross (e, f) sections. Enlargement of the boxed area in f highlights ERTR7-positive tunica adventitia in apposition to the arterial tunica media (g); insets at upper right are representative of the boxed area and show punctate ERTR7 label, consistent with matted pial cell processes. Partial pial ensheathment is appreciated on cross section of a small artery (h), and enlargement of the boxed area (i). Diagram depicting brain regions used for quantification (j). Analysis of epipial coverage according to anatomical brain region (k) and vessel size (l, m); n = 145 vessels from 6 mice. a H&E; b transmission electron micrograph; c Immuno-EM for ERTR7; di green/FITC, ERTR7; red/CY3, SMA; blue, DAPI; scale bars = (ad) 2 μm; c and d (insets) 200 nm; e, f 50 μm; gi 10 μm. Primary (1o), secondary (2o), and tertiary (3o) processes are depicted within pial cells (b, d). Source data are provided as a Source Data file. TEM data are representative of 50 vessels from 3 young mice and immuno-EM data are representative of 6 sections from 2 young mice.
Fig. 2
Fig. 2. The epipia attenuates and loosens around small-to-medium leptomeningeal arteries, forming the epipial space.
Schematic (a) and routine sections (bd) demonstrate the relationships of pial cells on leptomeningeal, i.e., subarachnoid space (SAS) arteries and penetrating arterioles. Medium-sized SAS arteries at the brain surface demonstrate attenuation and loosening of the epipia layer, creating an epipial space (e), whereas smaller SAS arteries and penetrating arterioles demonstrate further thinning and coalescence of pial layers with the vessel walls, with occasional envelopment of the arteriolar smooth muscle cell layer (f, g). Analysis of epipial sheath thickness, expressed as a percentage (%) of vessel area, is shown according to vessel size (h) and brain region (i); Pearson correlation coefficient; n = 86 vessels. Likewise, analysis of epipial fenestration, expressed as a percentage (%) of total vessels, is shown according to brain region (j) and vessel size (k); one-way ANOVA with Tukey’s multiple comparisons test; n = 122 vessels. A medium-sized artery in ventral mouse brain (l, the same vessel shown in e), is depicted at higher magnification and demonstrates the loosened epipial sleeve composed of interlinking pial cells that partially enclose the epipial space (asterisks). Features of the epipial space are highlighted by immunohistochemistry (l, right-hand side), and are shown to advantage in ultrastructural images (m). Enlargements of boxed micrograph areas demonstrate the intra-adventitial space, in which scattered collagen fibrils are appreciated (arrows). Analysis of epipial space areas are shown relative to vessel size (n); Pearson correlation coefficient; n = 115 vessels from 6 mice. Analysis of epipial space areas are shown relative to brain region (o); one-way ANOVA with Tukey’s multiple comparisons test; n = 115 vessels from 6 mice. (bd, L left) H&E; (eg, L right) red/CY3, SMA; green/FITC, ERTR7; blue, DAPI; m transmission electron micrographs, with scale bars as indicated (asterisks represent the epipial space); scale bars = (b) 100 μm; ce 20 μm; f, g 10 μm. Source data are provided as a Source Data file. TEM data are representative of 50 vessels from 3 mice.
Fig. 3
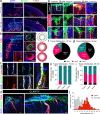
Fig. 3. Variability in intimal pial and epipial relationships give rise to distinct PAS architectures in superficial brain regions.
As shown on volumetric lightsheet image of a tissue-cleared (CLARITY) specimen, the intimal pia and epipia adjoin at the brain surface and create a basket-like sieve around penetrating arterioles (a). The anatomy is further delineated on confocal Z-stack images of longitudinal and axial cortical mouse brain sections (b). Heterogeneous relationships of the intimal pia and epipia around penetrating arterioles result in a spectrum of periarteriolar space (PAS) anatomy, with three primary structures in healthy young mouse brains: Type A (c), Type B (d), or Type C (e); white arrows represent separate pial sheaths (i.e., the intimal pia and epipia), while arrowheads mark sites of pial coalescence with the tunica media. The variable anatomy are depicted in longitudinal images with enlargements of boxed areas (ce, left-hand side) and axial schematics (ce, right-hand side) that depict deeper levels, from left to right (labeled 1–4, respectively). Type A PAS is shown in relation to an unsheathed arteriole (i.e., an arteriole lacking epipial coverage at the site of brain penetration). The distribution of PAS types at the brain surface is summarized in (f). PAS types are further characterized according to brain region (g) and vessel size (h and i); one-way ANOVA with Tukey’s multiple comparisons test; n = 57 vessels from 6 mice. ae Red/CY3, SMA; green/FITC, ERTR7; blue, DAPI or lectin; violet/CY5, aquaporin 4; scale bars = a, e 50 μm; b, c 10 μm; d 30 μm. Source data are provided as a Source Data file.
Fig. 4
Fig. 4. Influx of CSF tracer is delayed, but not restricted across “covered” Type A and Type B PAS.
Distribution of an immunofluorescent tracer (Texas Red conjugated to bovine serum albumin, TxRd; mw 66 kDa) was evaluated in mice sacrificed at 15 versus 30 min following slow intracisternal infusion (a), and revealed heterogeneous spatiotemporal deposition patterns as shown in right-hand images that represent the boxed areas. Enlargement of the small box at lower right panel in a illustrates tracer passage into a Type B PAS (b). Enlarged inset depicts pooling of tracer in PAS, creating a scalloped appearance around smooth muscle cells (b, inset). Cross-sectional images from axial sections (labeled 1–3) of another Type B PAS is shown in the middle panel and the anatomic relationships are summarized in axial schematics on right-hand side. Triple labeling of a Type B penetrating arteriole (shown in longitudinal section) depicts TxRd tracer signal around the ERTR7-labeled pial cell elements (c). Volumetric lightsheet image of a tissue-cleared (CLARITY) specimen further demonstrates variable penetration of the tracer (d). Examples of tracer-positive PAS are shown (e) and distributions are quantified in different brain regions at 15 min (f, h) and 30 min (g, i) post-infusion; n = 57 vessels from 6 mice. j At 30 min post-infusion, tracer was mostly found around large diameter arteries; n = 141 vessels from 6 mice. Red/Texas Red, TxRd; green/FITC, ERTR7; white/CY5, SMA; blue, DAPI or lectin; scale bars = a 500 μm; be 10 μm. Source data are provided as a Source Data file.
Fig. 5
Fig. 5. The pia is not a barrier to CSF tracer transport (size 66 kDa), irrespective of periarteriolar space (PAS) type.
a A CSF tracer (bovine serum albumin conjugated to Texas Red, TxRd-BSA; 66 kDa) was injected into the cisterna magna of live ketamine–xylazine anesthetized mice. After dura had been removed, the pial surface and CSF tracer movement patterns were imaged through a cranial window using two-photon (2P) laser scanning microscopy. b Second harmonic generation (SHG) was used to visualize the collagen fibers in the inner arachnoid and pia. c SHG imaging of an arteriole in the subarachnoid space (SAS), with an orthogonal reconstruction in the XZ plane (top panel), showing the inner arachnoid overlying the vessel surrounded by epipia coursing within the SAS on top the intimal pial layer. d SHG imaging of a penetrating arteriole (PA) showing how the epipia coalesces with the intimal pia as it dives down into cerebral cortex. Bottom right: YZ orthogonal view of the PA entering cortex. e Representative images of each PAS type surrounding penetrating arterioles at −20, −30, −40 µm below the cortical surface: Type A (top panel), Type B (middle panel), Type C (bottom panel). f CSF tracer in the surface perivascular spaces (PVS) is surrounded by the inner arachnoid superiorly, the intimal pia inferiorly, the fusion of the inner arachnoid/intimal pia laterally, and the epipia of the accompanying artery medially. This space coincides with the SAS of the surrounding leptomeningeal arterioles. g CSF tracer enters penetrating PAS and traverses across the merged epipial and intimal pial membranes. h Distribution of PAS by type (n = 42 PVS from 8 mice). i Area (µm2) of tracer coverage in the PVS as a function of depth from the brain surface. One-way ANOVA with Tukey’s post hoc for multiple comparisons, P = 0.4257, ns: not significant. j Probability of observing CSF tracer influx at varying depths of PAS type at 60 min after injection. Log-rank (Mantel–Cox) test, P = 0.7952, ns. k Time to tracer influx after the start of the intracisternal tracer injection in minutes (min). One-way ANOVA, P = 0.6399, ns. Scale bars = bd, f, g 20 µm. Data are presented as mean ± SEM. Source data are provided as a Source Data file.
Fig. 6
Fig. 6. Pial coverage, thickness and depth of penetration vary with age, brain region, and PAS type in young, old, and APP/PS1 mice.
ERTR7-labeled coronal brain sections from young (2 months), old (13 months), and APP/PS1 (13 months) mice demonstrate pial coverage at the brain surface (a). Notice variable coverage, thickness, and depths of penetration. Analyses of percent (%) intimal pial/surface coverage (b), intimal pial/surface thickness (µm) (c), and depth of pial penetration (µm) according to brain region (d), and PAS type (e) are shown; two-way ANOVA with Tukey’s multiple comparisons test. The overall distribution of pial depths and areas (µm2) of pial coverage surrounding penetrating arterioles are shown in plots f and g, respectively. Young: n = 141 vessels from 3 mice; Old: n = 139 vessels from 3 mice; APP/PS1: n = 141 vessels from 3 mice. Green/FITC, ERTR7; cyan/CY5, MeX04; blue, lectin; scale bars = ac, left 500 μm; ac, right 50 μm. Data are presented as mean ± SEM. Source data are provided as a Source Data file.
Fig. 7
Fig. 7. Disordered and plaque-like PAS appear with aging along with conversion to covered or “closed” PAS types in APP/PS1 mice.
In old (13 months) mice, pial distribution is irregular at the brain surface and around penetrating arterioles (a), resulting in PAS without any pial coverage, i.e., Type 0 (b), and PAS with thickened, superficial plaque-like coverage, i.e., Type D (c), in addition to usual type PAS (i.e., Type ac). The anatomy of Type 0 and Type D PAS are depicted in schematics shown in (d) and (e), respectively. PAS types observed in old and APP/PS1 mice are illustrated in (f) and (g). The overall distribution of PAS types at the cerebral cortical brain surface of old mice is summarized in (h). The overall distribution of PAS types at the cerebral cortical brain surface of APP/PS1 mice is summarized in (i). Note diminishment of type 0 and absence of type C PAS in APP/PS1 mice. Old: n = 139 vessels from 3 mice; APP/PS1: n = 141 vessels from 3 mice. Cyan/CY5, MeX04; blue, lectin; green/FITC, ERTR7. Scale bars = a 50 μm; b, c 10 μm; f, g 20 µm.
Fig. 8
Fig. 8. CSF tracer accumulation patterns are variable within PAS of healthy, old, and APP/PS1 mice, and correlate with perivascular MeX04 (i.e., amyloid-β plaque) and ERTR7 (i.e., pial cell) density.
Coronal images demonstrate TxRd tracer accumulation in brains of young, old and APP/PS1 mice (a). The distribution of vessel sizes in young, old and APP/PS1 mice are shown (b) along with the proportion of tracer-positive PAS (c) and tracer positivity according to PAS type (d). Distribution of tracer-positive PAS are further depicted in the three groups according to arterial diameter (e). The overall distribution of tracer mean pixel intensity (MPI) is shown (f) along with distribution of MPI according to PAS type (g); two-way ANOVA with Tukey’s multiple comparisons test. A penetrating arteriole from APP/PS1 mouse is shown at higher power (h) and illustrates diminishment of tracer accumulation below PAS abutting plaques, with brisk fluorescence in secondary penetrating arterioles, possibly representative of regurgitant flow. The distribution of MeX04 (amyloid-β plaque) label according to MPI is summarized in (i). TxRd tracer accumulation (MPI) is summarized in plaque-positive (>1 PAS abutting plaques) versus plaque-negative PAS in (j), showing marked diminishment of tracer accumulation that may be indicative of decreased flow; unpaired t-test. Correlation of MeX04 with ERTR7 pixel are is shown in (k); simple linear regression with 95% CI. Correlation of tracer MPI with ERTR7 label is shown in (l); simple linear regression with 95% CI. Correlation of tracer MPI with MeX04 MPI is shown in (m); simple linear regression with 95% CI. Cyan/CY5, MeX04; blue, lectin; green/FITC, ERTR7; red/Texas Red, TxRd. Scale bars = (a) 500 μm; (h) 50 μm. Data are depicted 30 min following intracisternal tracer infusion. Young: n = 141 vessels from 3 mice; Old: n = 139 vessels from 3 mice; APP/PS1: n = 141 vessels from 3 mice. Source data are provided as a Source Data file.
Fig. 9
Fig. 9. CSF tracer undergoes differential macrophagic processing within distinct PAS types.
At sites of arteriolar penetration (a), the intimal pia and epipia merge and distinct patterns of tracer deposition are observed around ensheathed vessels (i.e., Type A-D PAS), with free tracer passage, stagnation of the tracer bolus (open arrow) and/or cellular sequestration of tracer (solid arrows) noted. Cross and oblique PAS sections (b, lower panel) depict tracer-positive cells studding the ERTR7-positive PAS cell network. As demonstrated in the oblique section and lower panel representing an enlargement of the boxed area, the TxRd tracer positive cells represent ED1-positive macrophages. ED1-positive cells are shown within Type B PAS of young, old, and APP/PS1 mice (c) and the distribution of tracer among ED1-positive macrophages in type A–D PAS of young mice is shown in (d). The number of ED1-expressing cells is variable among PAS types, being prominent in type D PAS (e) and correlating strongly with ERTR7 density (f); n = 107 vessels. Two-way ANOVA with Tukey’s multiple comparisons test in D. Simple linear regression with 95% CI in E, F; P values in legend refer to testing between slopes. Moreover, the depths of ED1-positive macrophages in PAS correlate strongly with pial (i.e., ERTR7) depth (g). The distribution of tracer among ED1-positive macrophages in type A–D PAS is quantified in (h). Two-way ANOVA with Tukey’s multiple comparisons test in (h). ag Red/Texas Red, TxRd; green/FITC, ERTR7; white/CY5, ED1; blue, DAPI; Scale bars = (a, upper panel) 30 μm; (a, lower panels, b upper panel, c, g) 10 μm; (b, lower panel) 5 µm. Young: n = 87 vessels from 3 mice; Old: n = 71 vessels from 3 mice; APP/PS1: n = 66 vessels from 3 mice. Data are presented as mean ± SEM. Source data are provided as a Source Data file.

References

    1. Fame RM, Lehtinen MK. Emergence and developmental roles of the cerebrospinal fluid system. Dev. Cell. 2020;52:261–275. doi: 10.1016/j.devcel.2020.01.027. - DOI - PubMed
    1. Mestre H, et al. Cerebrospinal fluid influx drives acute ischemic tissue swelling. Science. 2020;367:eaax7171. doi: 10.1126/science.aax7171. - DOI - PMC - PubMed
    1. Rennels ML, Gregory TF, Blaumanis OR, Fujimoto K, Grady PA. Evidence for a 'paravascular' fluid circulation in the mammalian central nervous system, provided by the rapid distribution of tracer protein throughout the brain from the subarachnoid space. Brain Res. 1985;326:47–63. doi: 10.1016/0006-8993(85)91383-6. - DOI - PubMed
    1. Mestre H, Kostrikov S, Mehta RI, Nedergaard M. Perivascular spaces, glymphatic dysfunction, and small vessel disease. Clin. Sci. 2017;131:2257–2274. doi: 10.1042/CS20160381. - DOI - PMC - PubMed
    1. Peng W, et al. Suppression of glymphatic fluid transport in a mouse model of Alzheimer's disease. Neurobiol. Dis. 2016;93:215–225. doi: 10.1016/j.nbd.2016.05.015. - DOI - PMC - PubMed

Publication types

Substances