. 2022 Jul 6;12(1):11064.
doi: 10.1038/s41598-022-15132-7.

New land tenure fences are still cropping up in the Greater Mara

Affiliations

New land tenure fences are still cropping up in the Greater Mara

Mette Løvschal et al. Sci Rep. .

Abstract

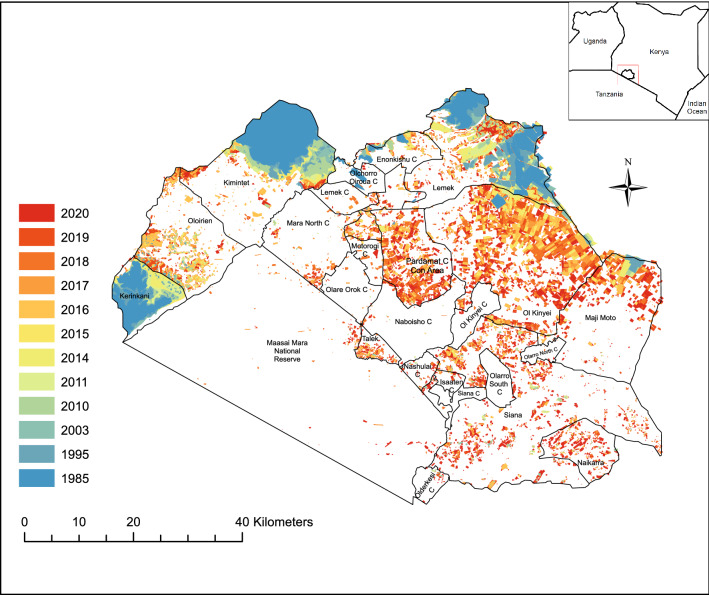
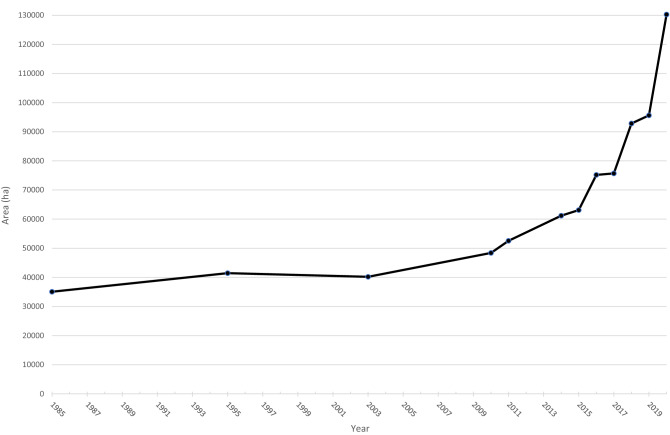
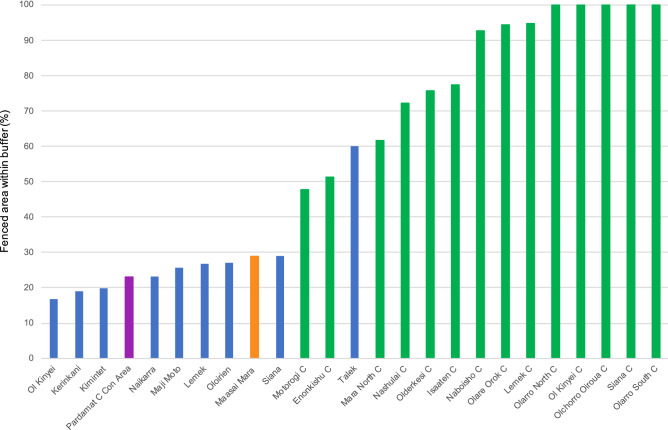
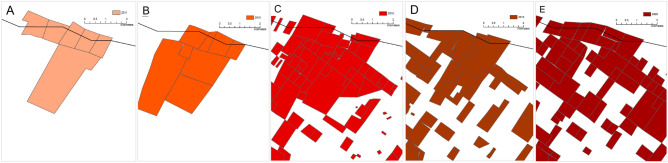
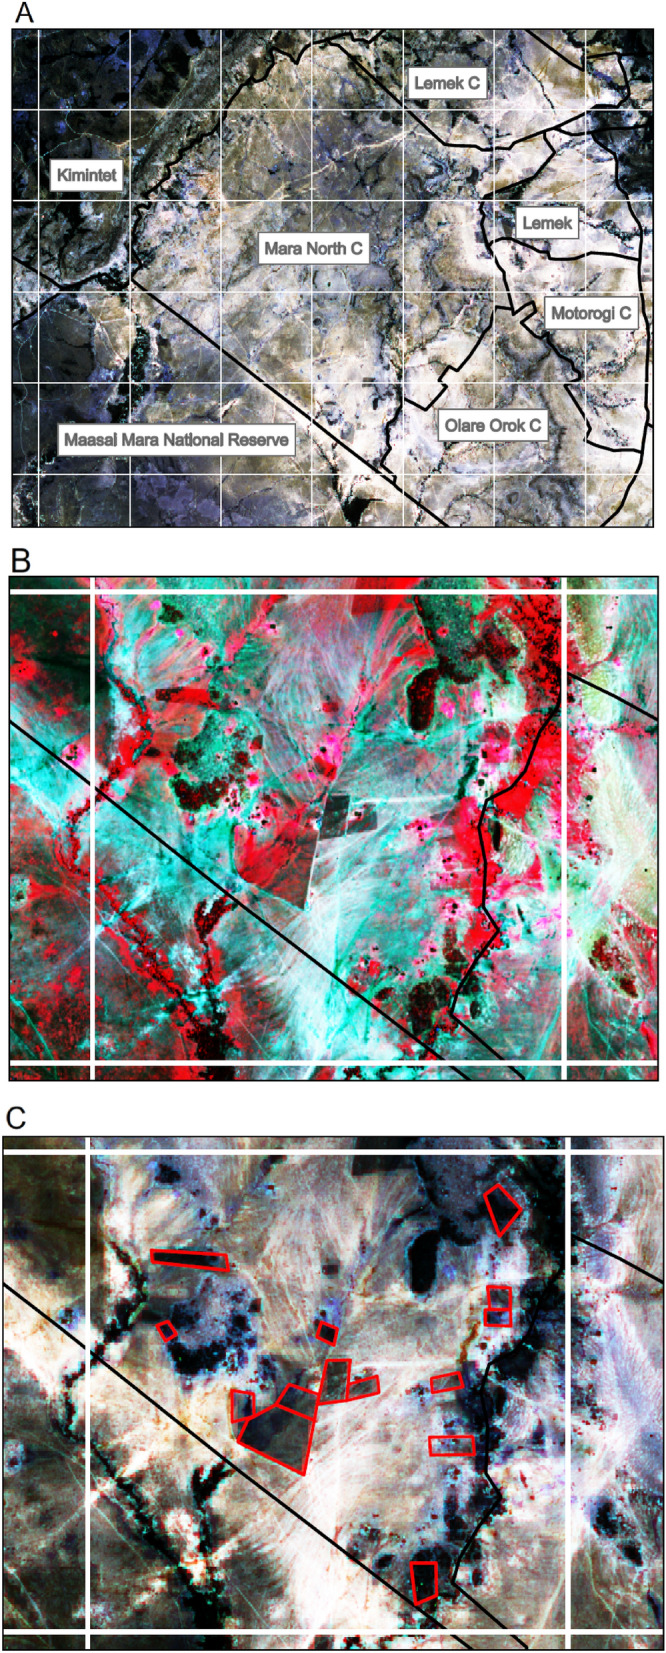
Expanding and intensifying anthropogenic land use is one of the greatest drivers of changes of biodiversity loss and political inequality worldwide. In the Greater Mara, Kenya, a trend of private land enclosure is currently happening, led by smallholders wishing to protect and uphold their land titles. Here we expand on previous work by Løvschal et al. quantifying the rapid, large-scale development of fencing infrastructure that began in 1985 but has increased by 170% from 2010 onwards. We provide fine-scale analysis of the spatial and temporal trends in fencing using high-resolution Sentinel-2 imagery. The formally unprotected regions have distinctly more fences than the rest of the Mara, one experiencing a 740% increase in fenced land in four years. Conservancies have an effect in stemming fencing but fences crop up within and along conservancy boundaries. We estimate the actual geographical coverage of the fences in the Mara to be 130,277 ha (19% of the total region) using an error margin of 8%, derived by calibrating our satellite mapping with ground-truth data. The study suggests the need for revising community-based eco-conservation efforts and pursuing a richer understanding of the socio-political and historical dynamics underlying this phenomenon.


Conflict of interest statement

The authors declare no competing interests.

Figures

Figure 1
Figure 1
Fences in the Greater Mara, Kenya (1985–2020). Based on a systematic digitization of the fences from Landsat and Sentinel from 1985 to 2016 and 2017–2020 using ArcMap (vs. 10.6.1). Fences are indicated on a sliding color scale described by the legend.
Figure 2
Figure 2
Conservative estimate of the fenced area of the entire Greater Mara, Kenya (1985–2020) expressed in hectares.
Figure 3
Figure 3
Conservative estimate of the fenced area of the Greater Mara, categorized in terms of level of formal protection (hectares over time from 1985 to 2020).
Figure 4
Figure 4
Upper: The areal enclosure of fences in all regions of the Greater Mara in hectares (hectares over time from 1985 to 2020). To illustrate the differences in areal enclosure between the four types of protected land, regions of the type have been assigned the same color ranges. Orange: National Reserve; purple: Conservation Area; green: Conservancy; blue: Remaining land. Lower: The five most fenced regions (cf. formally unprotected land) are illustrated to make it easier to read graph (upper).
Figure 5
Figure 5
Percentage of fenced area within one kilometer of every border in 2020 relative to the total fenced area of each region of the Greater Mara. Green bars are conservancy areas, the orange bar is the national reserve, the purple bar is the conservation area, and the blue bars are remaining (formally unprotected) regions. The size of the regions is not taken into account in this figure.
Figure 6
Figure 6
The expansion of fencing around a plot of land in Maji Moto, the Greater Mara, Kenya. (A) 2011, (B) 2015, (C) 2018, (D) 2019, and (E) 2020. Each section is 5.5 × 5.5 km on the ground. Based on ArcMap (vs. 10.6.1).
Figure 7
Figure 7
Pardamat fences collected between late September 2019 and September 2021 using GPS ground-truthing. Enclosed areas were calculated by converting recorded fencelines to polygons within Esri ArcGIS Pro vs. 2.9 software allowing for smaller than 2 m gaps. Green lines represent fences that were removed by landowners during the reported period.
Figure 8
Figure 8
Method illustrated. White lines are the 4.5 × 4.5 km grid; black lines are the regional borders within the Greater Mara; red lines are digitalized fences based on a Sentinel-2 satellite image. (A) Mara North seen on Sentinel-2, with normal colors (bands: 4, 3, and 2). (B) One grid cell within Mara North (bold white square on Fig. 4A) based on near infrared, red and green, which makes fenced plots stand out as bright red. (C) The digitized fences. Based on ArcMap (vs. 10.6.1).

References

    1. Taylor JL. Negotiating the grassland: The policy of pasture enclosures and contested resource use in inner Mongolia. Human Org. 2006;65:374–386. doi: 10.17730/humo.65.4.43nlykfuchg1cbk8. - DOI
    1. Netz, R. Barbed Wire: An Ecology of Modernity (1st ed.). (Wesleyan University Press, 2009).
    1. Greer A. Commons and enclosure in the colonization of north America. Am. Hist. Rev. 2012;117:365–386. doi: 10.1086/ahr.117.2.365. - DOI
    1. Løvschal M. The logics of enclosure: deep-time trajectories in the spread of land tenure boundaries in late prehistoric northern Europe. J. Roy. Anthropol. Inst. 2020;26:365–388. doi: 10.1111/1467-9655.13252. - DOI
    1. Tucker MA, et al. Moving in the Anthropocene: Global reductions in terrestrial mammalian movements. Science. 2018;359:466–469. doi: 10.1126/science.aam9712. - DOI - PubMed