

Null Function of Npr1 Disturbs Immune Response in Colonic Inflammation During Early Postnatal Stage
- PMID: 35794311
- PMCID: PMC9646613
- DOI: 10.1007/s10753-022-01702-4
Null Function of Npr1 Disturbs Immune Response in Colonic Inflammation During Early Postnatal Stage
Abstract
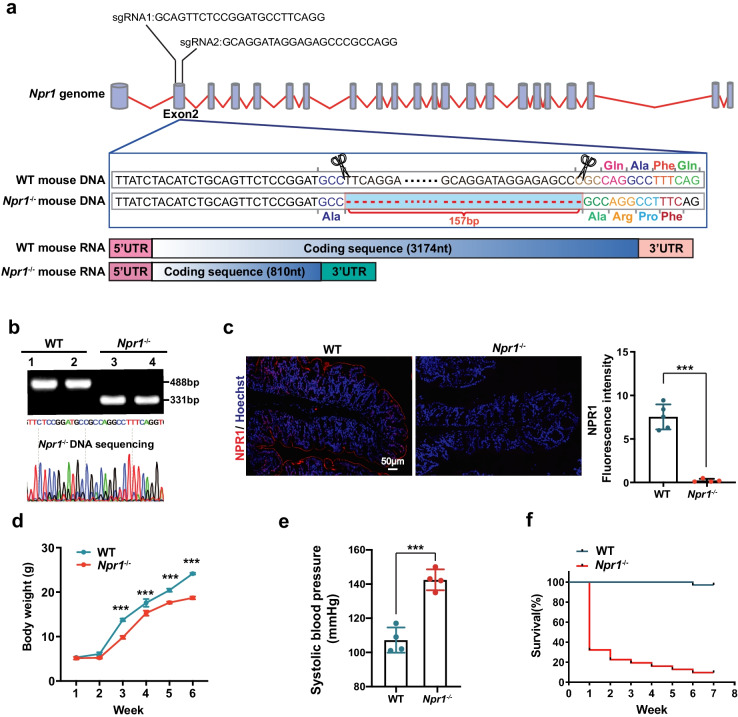
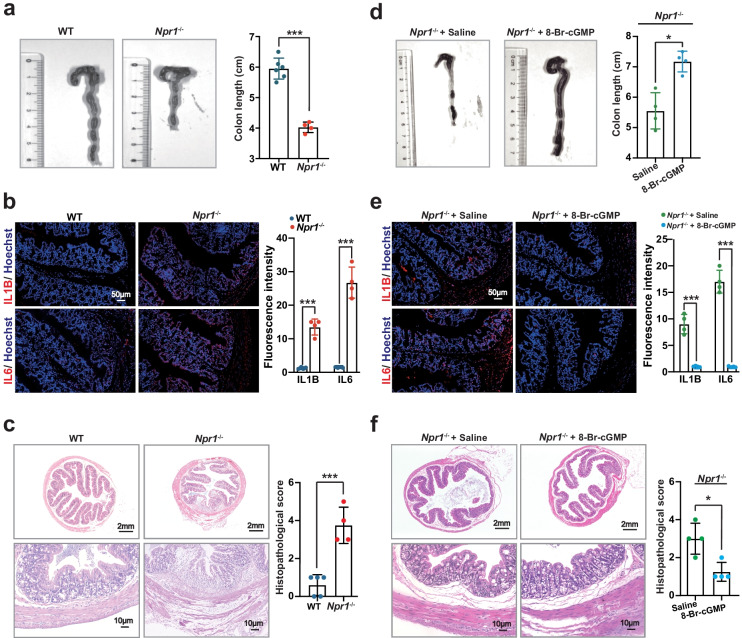
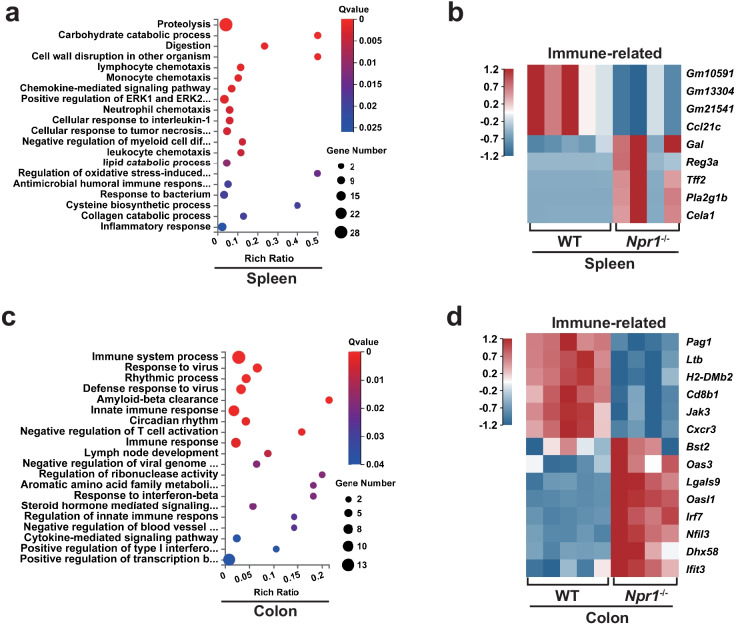
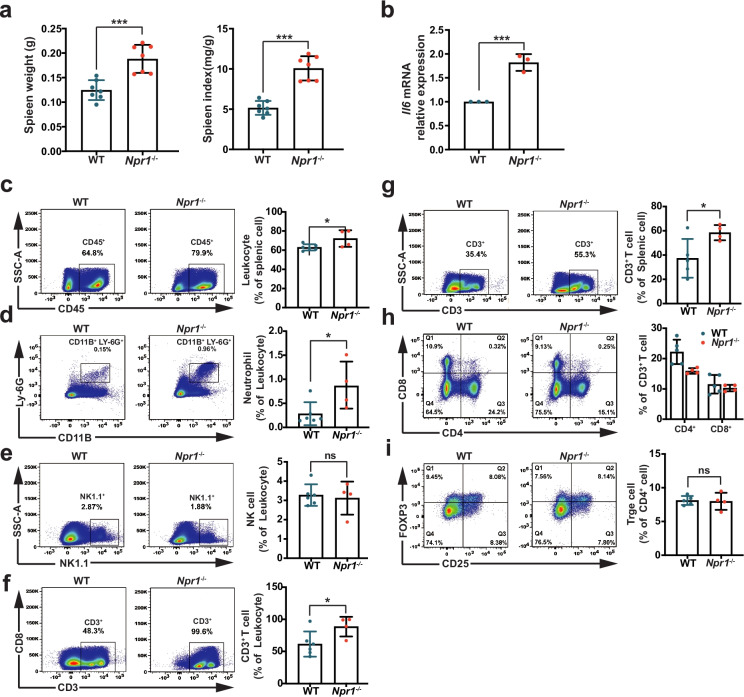
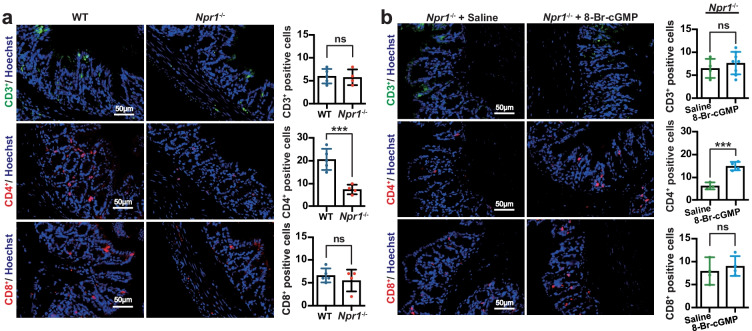
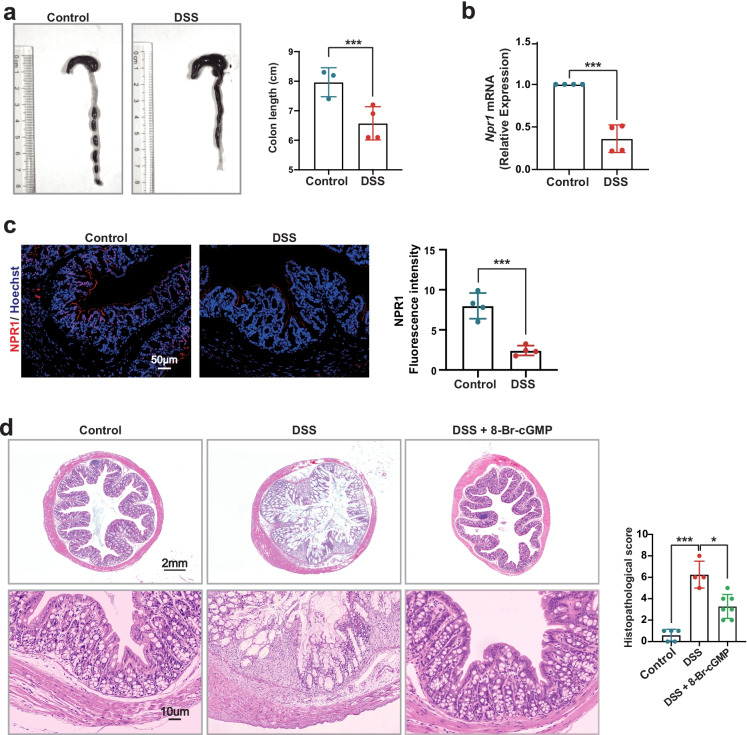
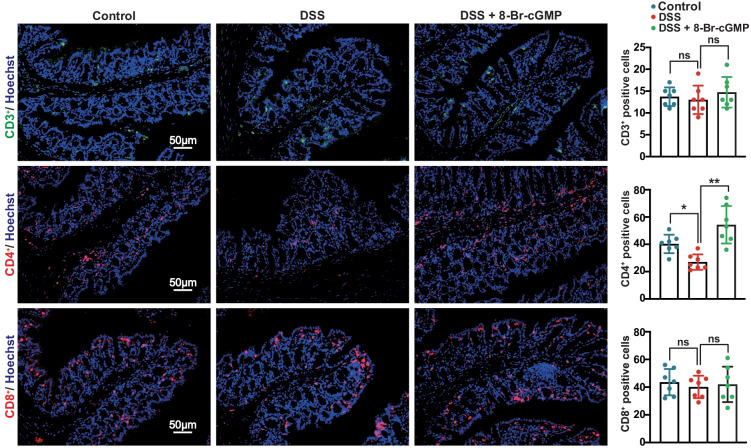
Natriuretic peptide receptor 1 (NPR1) is conventionally known as a regulator of vascular homeostasis. Here, we generated an Npr1 knockout mouse model with CRISPR/Cas9 technology and found that homozygous mice (Npr1-/-) exhibited weight loss and poor survival rate during early postnatal stage. Careful examination revealed unexpectedly that Npr1-/- mice developed colitis characterized by shortened colon, evident colonic mucosal damage, increased histopathological score, and higher colonic expression of proinflammatory cytokines interleukin-1B (IL1B) and -6 (IL6). RNA-sequencing analysis revealed that differentially expressed genes were prominently enriched in the biological pathways related to immune response in both spleen and colon of Npr1-/- mice. Cytofluorimetric analysis demonstrated that leukocytes in the spleen were significantly increased, particularly, the populations of neutrophil and CD3+ T cell were elevated but CD4+ T cells were decreased in Npr1-/- mice. Administration of 8-Br-cGMP, a downstream activator of NPR1, restored these immune-cell populations disturbed in Npr1-/- mice and lessened the colitis-related phenotypes. To validate the involvement of Npr1 in colitis, we examined another mouse model induced by dextran sodium sulfate (DSS) and found a decreased Npr1 expression and shifted immune-cell populations as well. Importantly, 8-Br-cGMP treatment exhibited a similar effect in the restoration of immune-cell populations and attenuation of colonic inflammation in DSS mice. Our data indicate that loss of Npr1 possibly interrupts immune response, which is critical to the pathogenesis of colitis in the early life.
Keywords: CD4+ T cells; Npr1; colitis; colonic inflammation; immune response.
© 2022. The Author(s).
Conflict of interest statement
The authors declare no competing interests.
Figures
Similar articles
-
PepT1 expressed in immune cells has an important role in promoting the immune response during experimentally induced colitis.Lab Invest. 2013 Aug;93(8):888-99. doi: 10.1038/labinvest.2013.77. Epub 2013 Jun 24. Lab Invest. 2013. PMID: 23797361
-
Deletion of Endogenous Neuregulin-4 Limits Adaptive Immunity During Interleukin-10 Receptor-Neutralizing Colitis.Inflamm Bowel Dis. 2023 Nov 2;29(11):1778-1792. doi: 10.1093/ibd/izad092. Inflamm Bowel Dis. 2023. PMID: 37265326 Free PMC article.
-
Curcumin alleviated dextran sulfate sodium-induced colitis by recovering memory Th/Tfh subset balance.World J Gastroenterol. 2023 Sep 28;29(36):5226-5239. doi: 10.3748/wjg.v29.i36.5226. World J Gastroenterol. 2023. PMID: 37901446 Free PMC article.
-
Elevated ER stress exacerbates dextran sulfate sodium-induced colitis in PRDX4-knockout mice.Free Radic Biol Med. 2019 Apr;134:153-164. doi: 10.1016/j.freeradbiomed.2018.12.024. Epub 2018 Dec 19. Free Radic Biol Med. 2019. PMID: 30578917
-
TFF2 deficiency exacerbates weight loss and alters immune cell and cytokine profiles in DSS colitis, and this cannot be rescued by wild-type bone marrow.Am J Physiol Gastrointest Liver Physiol. 2015 Jan 1;308(1):G12-24. doi: 10.1152/ajpgi.00172.2014. Epub 2014 Oct 16. Am J Physiol Gastrointest Liver Physiol. 2015. PMID: 25324506 Free PMC article.
Cited by
-
Lack of NPR1 Increases Vascular Endothelial Adhesion through Induction of Integrin Beta 4.Int J Mol Sci. 2022 Oct 20;23(20):12627. doi: 10.3390/ijms232012627. Int J Mol Sci. 2022. PMID: 36293483 Free PMC article.
-
Glucocorticoids ameliorate cardiorenal syndrome through the NPR1/SGK1 pathway in natriuretic peptide receptor A‑heterozygous mice.Exp Ther Med. 2023 Jun 22;26(2):374. doi: 10.3892/etm.2023.12073. eCollection 2023 Aug. Exp Ther Med. 2023. PMID: 37415837 Free PMC article.
References
MeSH terms
Substances
Grants and funding
LinkOut - more resources
Full Text Sources
Molecular Biology Databases
Research Materials
Miscellaneous
